Key Takeaways
- Both stocks carry 24% implied upside from Street mean targets today, but TIKR’s model prices the difference where it compounds: 201% total return for Netflix versus 35% for Disney over the model period.
- TIKR’s model targets a ~14% IRR for Netflix stock versus 7% for Disney stock at mid case, a 650 basis point gap driven by Netflix’s simpler, higher-margin business compounding faster than Disney can rationalize its segments.
- Netflix’s ~30% operating margin is nearly double Disney’s 15%, with consensus revenue growth of 14% in 2026 against Disney’s 7%, and the gap persists into 2027.
Key Stats
Netflix, Inc. (NFLX)
- Current Price: $92(May 1, 2026)
- 52-Week Range: $75 – $134
- Market Cap: $387.6B
- Enterprise Value: $392.1B
- LTM Net Debt: $4.5B
- LTM Net Debt / EBITDA: 0.30x
- TIKR Mid-Case Target: $277
- Mid-Case IRR: 14%
- Forward P/E (NTM): 27.69x
- NTM Market Cap / FCF: 33.01x
The Walt Disney Company (DIS)
- Current Price: $103 (May 1, 2026)
- 52-Week Range: $90 – $125
- Market Cap: $182.6B
- Enterprise Value: $229.1B
- LTM Net Debt: $41.0B
- LTM Net Debt / EBITDA: 1.99x
- TIKR Mid-Case Target: $139
- Mid-Case IRR: 7%
- Forward P/E (NTM): 14.87x
- NTM Market Cap / FCF: 12.18x
Trying to decide between NFLX and DIS? TIKR lets you pull up Netflix stock and Disney stock side by side with the same institutional-grade financial data professional analysts use, for free →
One Platform, One Model — and One Managing Five Segments at Once
Netflix (NFLX) runs one business.
Subscribers pay a monthly fee, Netflix converts that into a 29.5% operating margin, and the advertising tier now scaling across its 300-plus million member base adds a second revenue stream without adding a single new cost structure.
Disney (DIS) runs five businesses inside one stock price.
The Entertainment segment holds Disney+, Hulu, ABC, and the studio alongside linear cable networks whose subscriber base is contracting faster than streaming is growing.
ESPN anchors a Sports segment in the middle of a direct-to-consumer transition, with its standalone streaming product still unproven at scale.
Experiences, the parks, resorts, and cruise lines segment, carries the heaviest capital intensity in the portfolio and currently provides the consolidated FCF floor that holds Disney’s model together.
Every dollar of margin improvement Disney earns in streaming competes with capital absorption from segments that require physical infrastructure to operate.
Netflix’s model gets simpler and more profitable as revenue scales; Disney’s model stays complex as it manages four concurrent transitions without a clear margin ceiling in sight.
That structural difference is what separates a 13.6% IRR from a 7.1% one.
Wall Street’s Take: The Comparison
Netflix’s single-segment structure means every point of operating leverage flows to EPS without segment mix diluting the consolidated number.
Disney’s EPS story requires parks to hold, linear to not deteriorate faster than modeled, and streaming to scale without absorbing unexpected content cost overruns — three conditions running in parallel.

Netflix stock carries a 2026 consensus revenue estimate of $51.4B, a 14% growth, driven by subscriber expansion and advertising tier monetization scaling across an installed base no new platform can replicate quickly.
EPS consensus for Netflix reaches 42% growth in 2026, the product of operating leverage on a content cost base that no longer grows proportionally to revenue as the subscriber base matures.
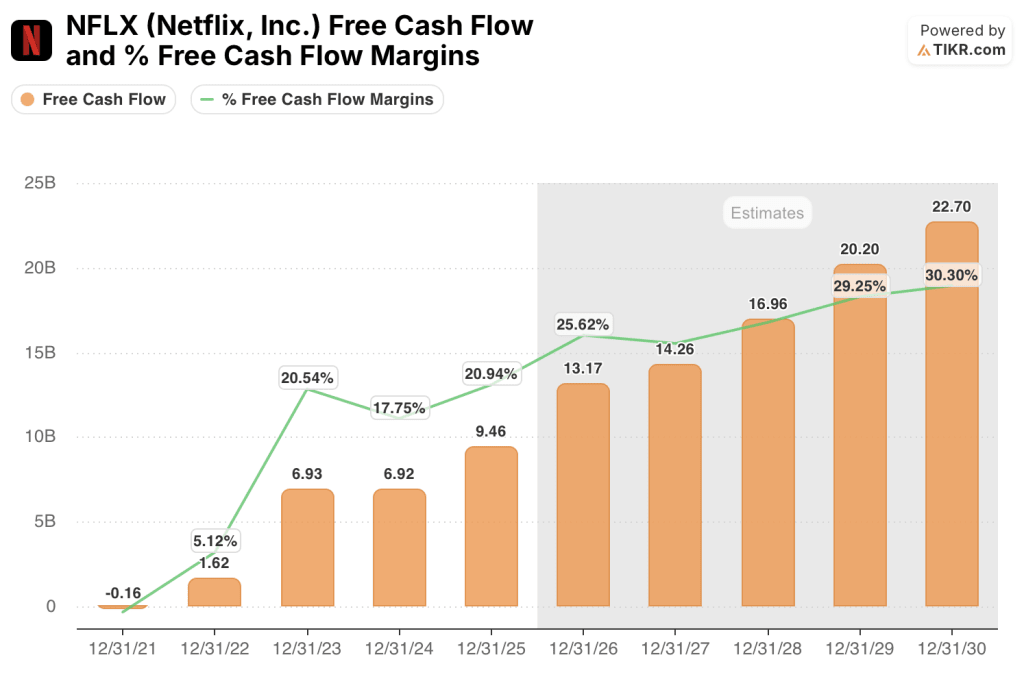
FCF is to reach $13.2B in 2026 at a 25.6% margin, expanding from $9.46B and 20.9% in 2025, with no capital-intensive segment consuming the incremental cash.
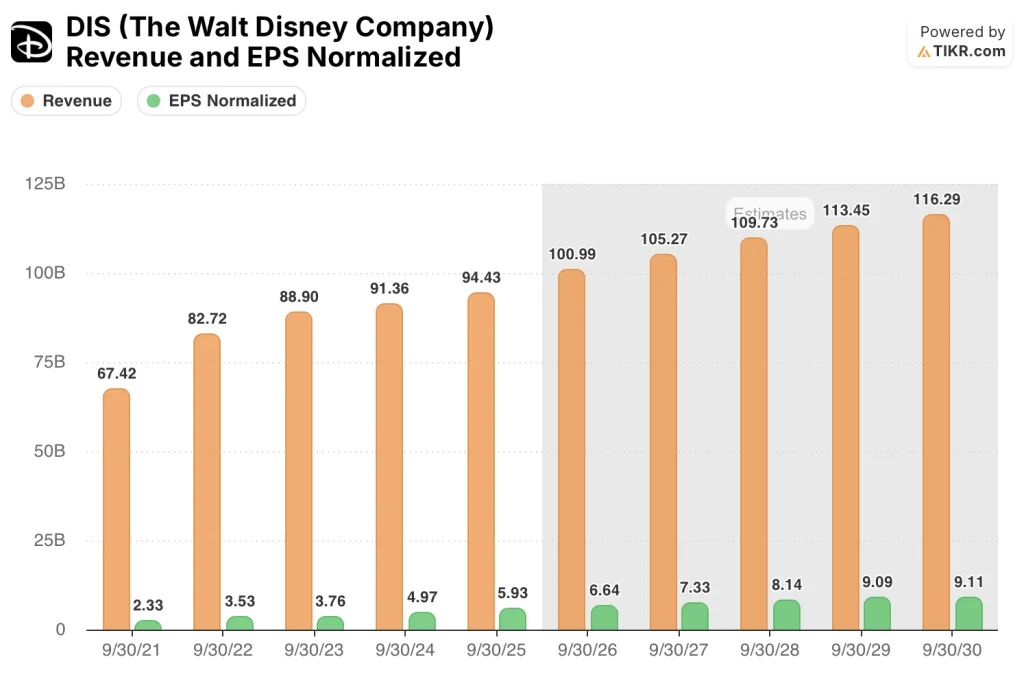
Meanwhile, Disney stock carries a 2026 consensus revenue estimate of $101.0B, representing 7% growth, slowing further to 4.2% in 2027 as parks normalization fades and linear decline continues.
EPS is expected to grow 12% in 2026 to a consensus $6.64, constrained by a segment mix where parks capital intensity and linear media decline limit how fast the consolidated earnings base can expand.
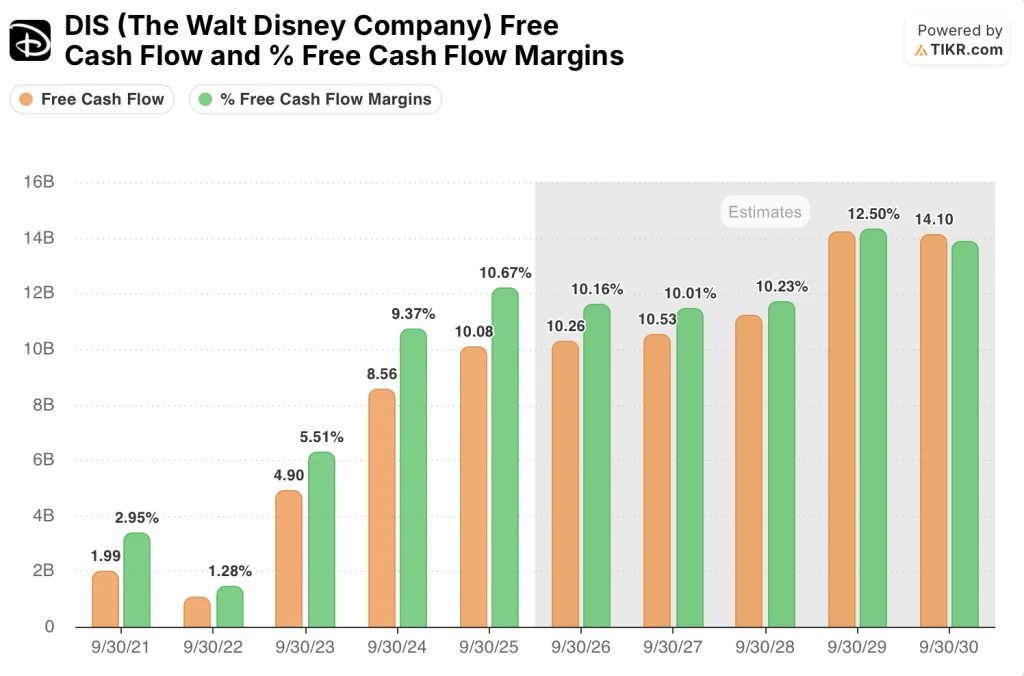
FCF moves from $10.08B in 2025 to $10.26B in 2026, a 1.8% increase, with FCF margins compressing slightly to 10.2% as capital expenditure requirements for parks and cruise lines absorb operating cash flow.

37 analysts covering Netflix stock set a mean target of $115, implying 24% upside from the current $92 price, with 29 buys, 8 outperforms, 12 holds, and just 1 underperform against zero sells.

29 analysts covering Disney stock set a mean target of $128, also implying 24% upside from the current $103 price, with 20 buys, 7 outperforms, 3 holds, and 1 sell.
The identical implied upside obscures a meaningful difference in conviction: Netflix draws 37 of 44 analysts to a buy or outperform rating, while Disney draws 27 of 29 — a tighter coverage base with less dissent but also less depth of institutional interest behind the thesis.

Netflix stock appears fairly valued to modestly undervalued at 27.69x forward P/E and 33.01x NTM FCF, with 42% consensus EPS growth in 2026 making both multiples look undemanding relative to the earnings trajectory, and a Street high target of $151 implying around 65% upside for investors who believe the advertising tier scales faster than the mean assumes
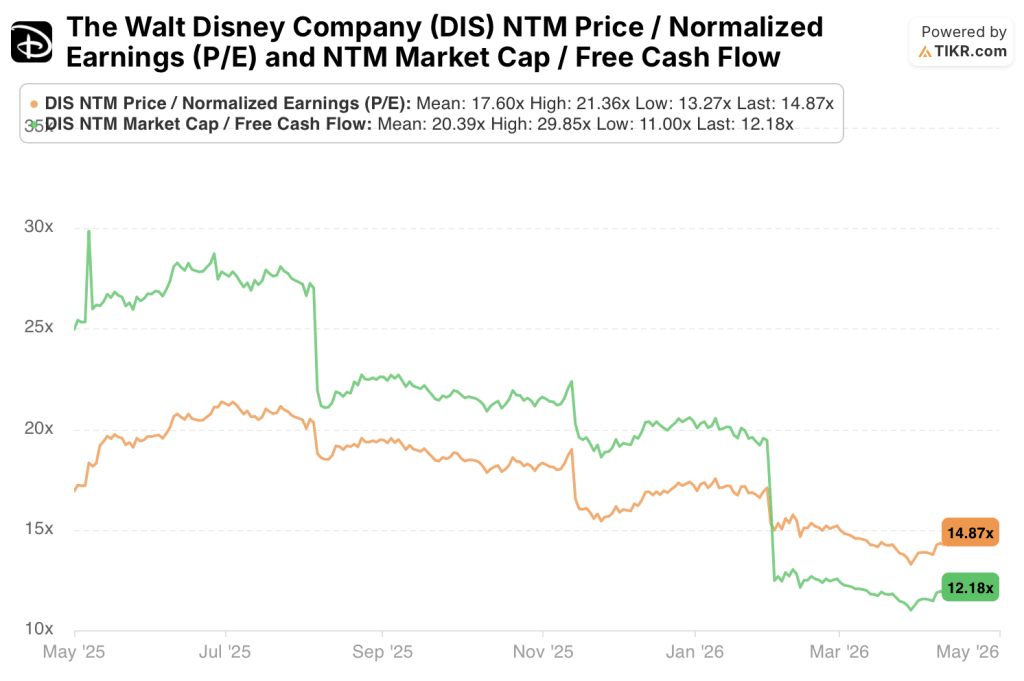
Disney stock appears undervalued on a multiple basis at 14.87x forward P/E and 12.18x NTM FCF, but the Street mean of $128 against a high of $160 signals that even the most optimistic analysts do not see a re-rating catalyst powerful enough to close the structural gap with Netflix.
Simple Model Expanding Margins vs. Segment Complexity Holding the Line
Netflix grew revenue 16% in fiscal 2025 and reached about 30% operating margin, expanding from 21% in 2021 without adding a single new business segment to the cost structure.
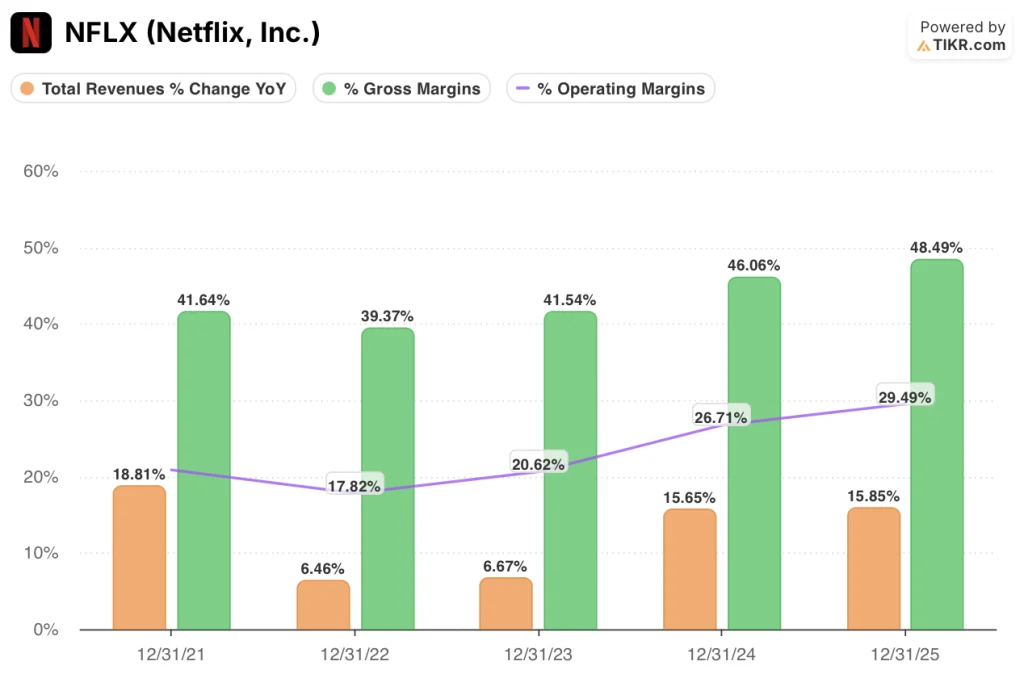
The gross margin tells the structural story: approximately 49% for Netflix in fiscal 2025, up from 42% in 2021, reflecting content costs scaling more slowly than revenue as the subscriber base matures into a high-retention, low-marginal-cost asset.
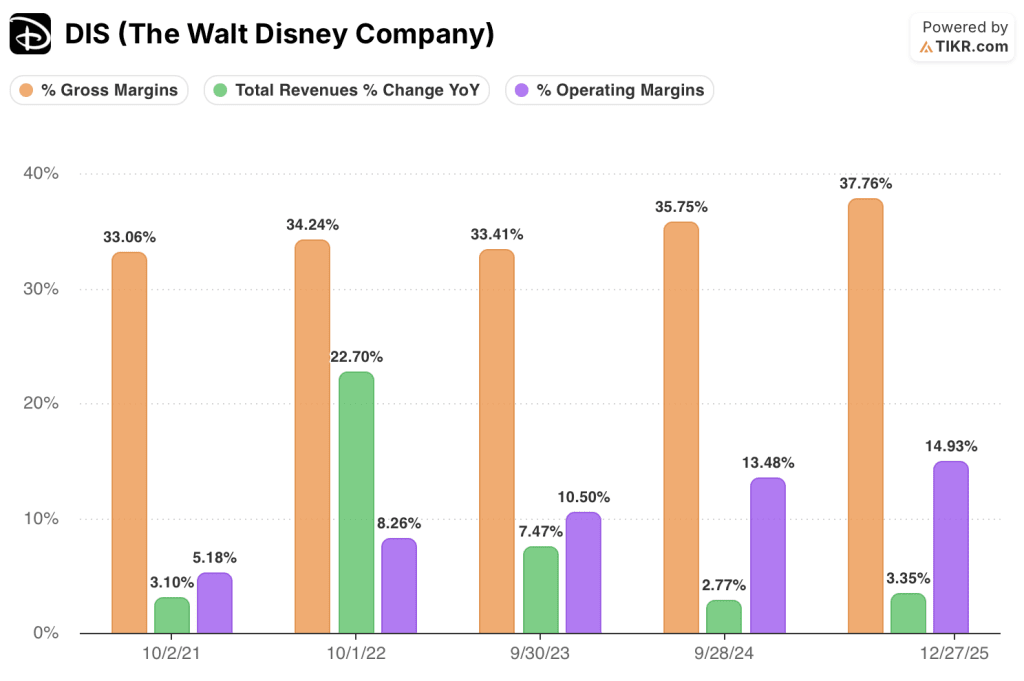
On the other hand, Disney grew revenue 3.4% in fiscal 2025 and reached a 38% gross margin, a genuine improvement from 33% in 2021, but the 1,070 basis point gap between the two companies’ gross margins sets a structural ceiling on how far Disney’s consolidated operating margins can expand regardless of streaming progress
Disney’s operating margin reached 15% in fiscal 2025, up from 5% in 2021, but that recovery reflects parks utilization normalization and Disney+ reaching segment-level profitability — not the kind of compounding operating leverage that drives Netflix’s margin trajectory.
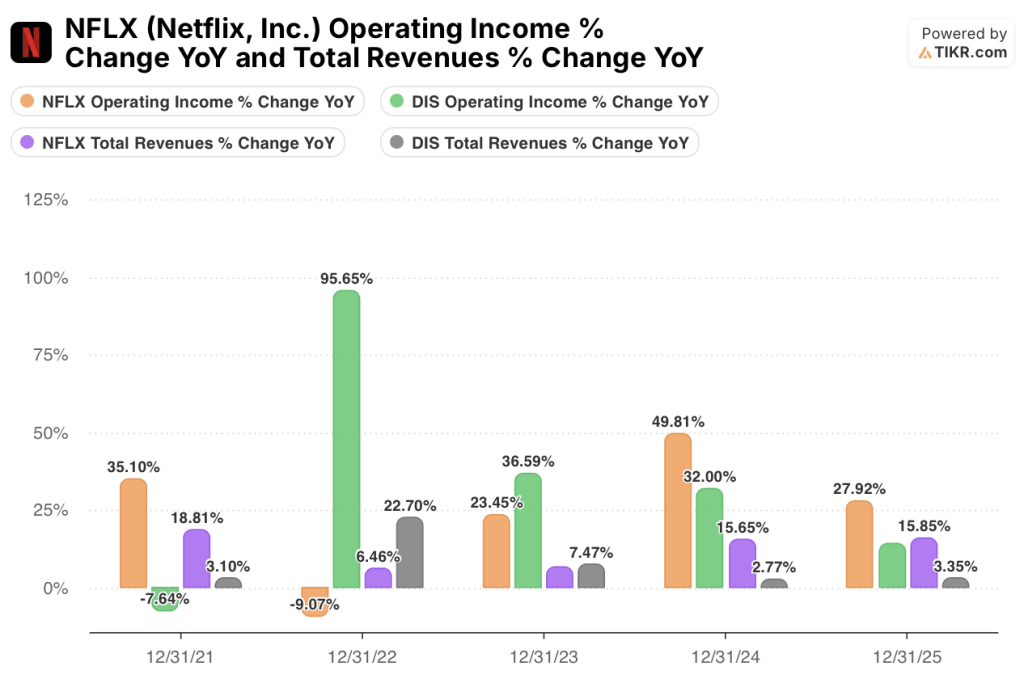
Netflix grew operating income 28% in fiscal 2025 on 16% revenue growth; Disney grew operating income 14% on 3% revenue growth, with the improvement driven by mix shift rather than consolidated leverage.
The ceiling argument is the sharpest distinction: Netflix’s path to 33%-plus operating margins runs through revenue scale alone, while Disney’s path requires structural simplification that consensus does not currently price.
What Does the Valuation Model Say?
TIKR’s model for Netflix stock targets $277 at mid case, built on an around 10% revenue CAGR and a 33% net income margin, reflecting advertising tier contribution lifting consolidated margins meaningfully above the current 24% level through the model period.
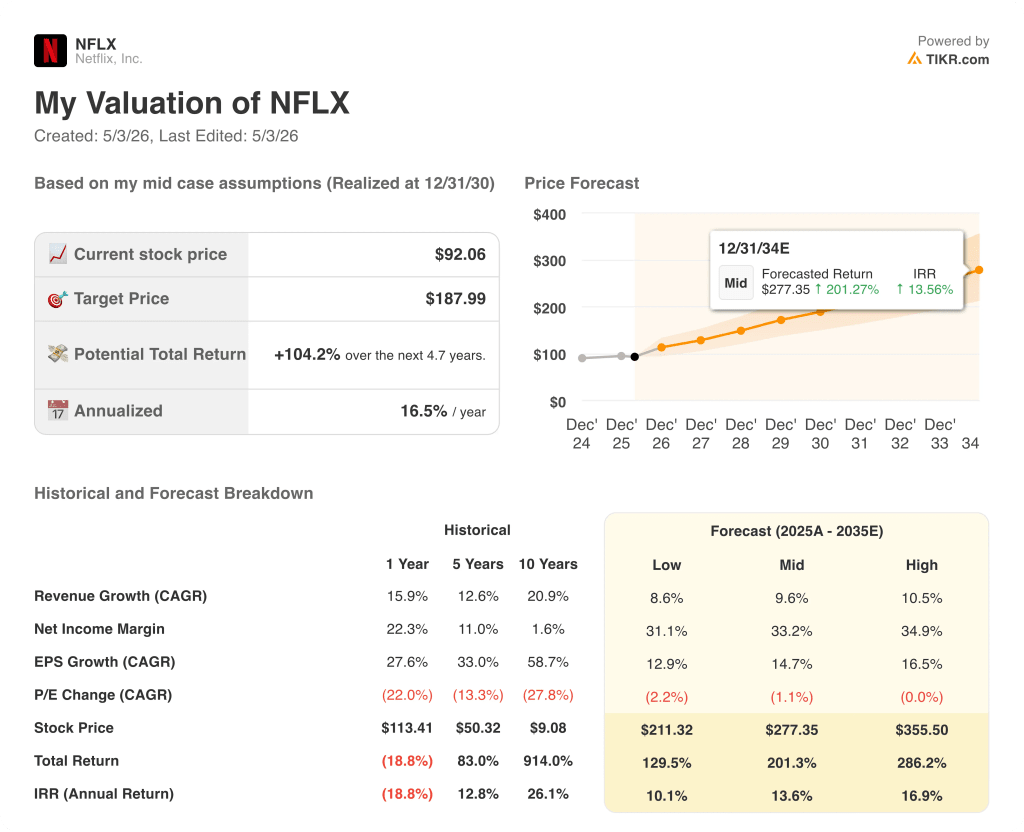
Netflix stock appears undervalued at current levels, with a mid-case IRR of approximately 14% and a total return of 201%; even the low case at 10% IRR implies a return profile most equity investors would accept without negotiation.
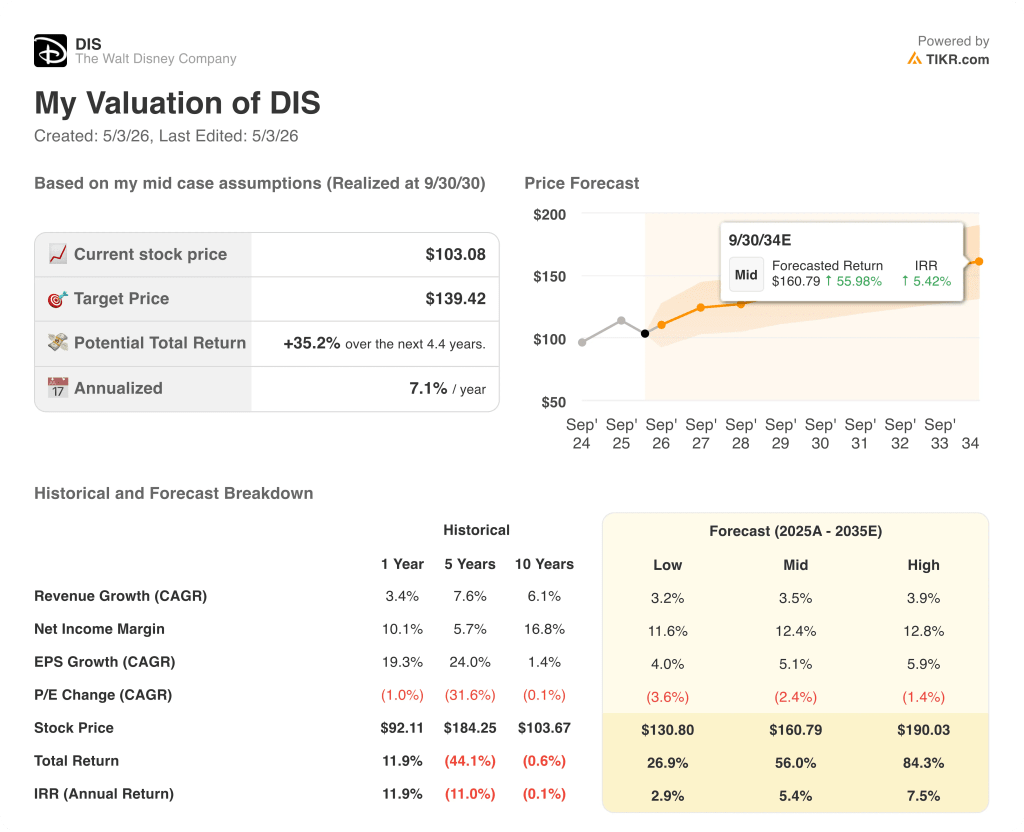
TIKR’s model for Disney stock targets $139 at mid case, built on a ~4% revenue CAGR and a 12% net income margin, assumptions that reflect a portfolio where low-single-digit growth across mixed segments is the realistic base case rather than a conservative one.
Disney stock appears fairly valued at current levels, with a mid-case IRR of 7% and a total return of 35%; the high case reaches only ~8% IRR, meaning even optimistic assumptions produce a return that barely clears a reasonable equity hurdle rate.
TIKR’s model prices the gap between NFLX and DIS at 650 basis points of annualized return at mid case, and Disney’s high-case IRR of ~8% does not reach Netflix’s low-case IRR of 10%.
The argument between these two stocks is whether Disney’s conglomerate discount is a buying opportunity or a fair price for structural complexity — and the scenario data lands firmly on the latter.
The Case for Netflix Stock
- Consensus revenue growth of 14% in 2026 is nearly double Disney’s 7%, with the gap persisting at 11.7% versus 4.2% in 2027, anchored by subscriber expansion and advertising tier scaling.
- FCF reaches $13.2B in 2026 at a 25.6% margin, expanding from $9.46B and 20.9% in 2025, with no capital-intensive segment consuming the incremental cash generation.
- EPS consensus growth of 42.2% in 2026 makes the 27.69x forward P/E look undemanding relative to the earnings trajectory, particularly against Disney’s 12.0% EPS growth at 14.87x.
- TIKR’s low-case IRR for Netflix stock of 10.1% exceeds Disney’s mid-case IRR of 7.1%, meaning Netflix’s floor return sits above Disney’s base case.
- The advertising tier scales into an existing 300-plus million member base without new infrastructure investment, keeping the margin expansion path structurally credible through the model period.
The Case for Disney Stock
- Forward P/E of 14.87x and NTM FCF multiple of 12.18x price in minimal margin expansion; any improvement above consensus would compress the valuation gap to Netflix quickly.
- Disney+ reached consolidated segment profitability in fiscal 2024, removing the streaming drag that suppressed earnings for three consecutive years and establishing a cleaner earnings base.
- FCF of $10.08B in fiscal 2025 is comparable to Netflix’s $9.46B on a nominal basis, supported by parks cash generation that does not depend on subscriber growth to sustain itself.
- EPS grows from $5.93 in fiscal 2025 to a consensus $6.64 in fiscal 2026, a 12.0% increase, with further expansion modeled through fiscal 2028 as streaming scale compounds without incremental content cost drag.
- The 1.9% dividend yield as of May 2026 provides an income return layer that Netflix stock does not offer, relevant for investors with yield requirements alongside total return.
Should You Invest in Netflix, Inc. or The Walt Disney Company?
The only way to really know is to look at the numbers yourself. TIKR gives you free access to the same institutional-quality financial data that professional analysts use to answer exactly that question.
Pull up Netflix, Inc. stock and The Walt Disney Company stock and you’ll see years of historical financials, what Wall Street analysts expect for revenue and earnings in the quarters ahead, how valuation multiples have moved over time, and whether price targets are trending up or down for both companies.
You can build a free watchlist to track Netflix, Inc. and The Walt Disney Company alongside every other stock on your radar. No credit card required. Just the data you need to decide for yourself.
Access Professional Tools to Analyze NFLX and DIS stock on TIKR for Free →