
Key Stats
NKE: Nike, Inc.
- Price: $44
- Analyst Mean Target: $62
- Implied Upside: 39%
- Consensus: 15 Buys, 2 Outperforms, 19 Holds, 1 Underperform, 1 Sell
LULU: Lululemon Athletica Inc.
- Price: $134
- Analyst Mean Target: $181
- Implied Upside: 36%
- Consensus: 3 Buys, 0 Outperforms, 29 Holds, 0 Underperforms, 1 Sell
Two Brands in Reset, Two Very Different Problems
Nike (NKE) is the largest athletic footwear and apparel company in the world, with direct-to-consumer (DTC) channels, wholesale partnerships, and brand equity built across six decades. The problem is self-inflicted.

Under the previous leadership team, Nike cut wholesale partners aggressively to accelerate DTC, a strategy that damaged retailer relationships and ceded shelf space to competitors like On Running and Hoka. Revenue peaked at $51.4B in FY24, then fell 9.8% to $46.3B in FY25.
New CEO Elliott Hill, who returned to the company in late 2024, has explicitly reversed the DTC-first directive. He is rebuilding wholesale relationships, reinvesting in sport-specific product lines, and restoring brand investment that was cut during the margin-optimization era.
The reset is real and acknowledged. The question is how long it takes to show up in revenue.

Operating income at Nike tells the damage clearly. It fell from $6.75B in FY24 to $3.70B in FY25, a 45.2% decline, compressing operating margins from 13.1% to 8%.
The LTM operating margin has deteriorated further to 6.7%. That is the entry point for anyone buying Nike stock today: a business with a 42.7% gross margin structure and a leadership team with a credible plan, sitting at a price that reflects a worst-case operating environment, not a recovery.
The problem of Lululemon (LULU) is different. It is not a strategic misstep or a leadership failure. It is the natural deceleration of a premium brand that ran out of addressable growth in its core North American market.
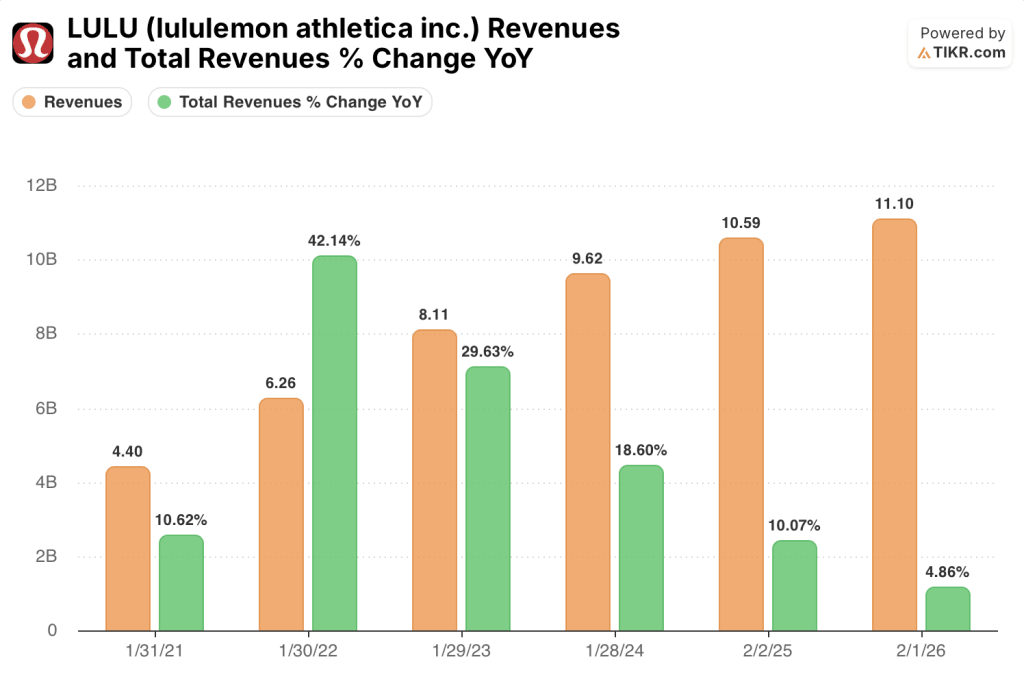
Revenue grew at a 29.6% rate in FY23, then 18.6%, then 10.1%, and most recently 4.9%. The growth engine has not broken. It has normalized.
The international business, which includes China and Europe, continues to expand. But North America, which still drives the majority of revenue, is saturating.

Lululemon’s operating margins peaked at 23.7% in FY25 and slipped to 19.9% in FY26 as SG&A rose from $3.76B to $4.07B to fund international expansion and product category extensions including footwear and menswear.
The distinction that matters for valuation: Nike is in a deeper hole with a higher ceiling. Lululemon is on a plateau with a narrower path back to the growth rates the market once paid a premium for. Nike stock’s discount reflects uncertainty about timing. Lululemon stock’s discount reflects uncertainty about whether the premium was ever permanent.
The Earnings Gap Wall Street Can’t Ignore
The business identity gap between Nike and Lululemon translates directly into divergent forward earnings trajectories. Nike’s recovery requires channel normalization, inventory clearance, and brand reinvestment to work simultaneously before operating leverage can return.
Lululemon’s path is narrower: it needs North America to stabilize and international to compound fast enough to offset slowing domestic growth. Neither story resolves in the next twelve months.
But the consensus numbers show one company with more room to surprise to the upside.

Nike stock’s FY26 consensus revenue is $46.3B, essentially flat against the prior year at -0.1%. EPS normalized is expected to fall further to $1.49, a 30.9% decline year over year, as the cost of the wholesale rebuild flows through the income statement before the revenue benefits materialize.
FY27 begins the recovery: revenue up 0.8% to $46.6B, EPS up 23.7% to $1.85. Free cash flow is expected to fall to $1.98B in FY26 before recovering to $2.85B in FY27. The consensus is pricing in one more year of pain before the inflection.

Meanwhile, Lululemon’s FY27 estimates tell a different story. Revenue is expected to grow 3.4% to $11.5B, but EPS is projected to fall 7.2% to $12.31, and FCF is expected to decline 41.8% in FY26 to $0.92B before a partial recovery.
The Street is not modeling an acceleration. It is modeling a company managing a soft landing at lower margins and lower earnings power than the peak FY25 year delivered.

The analyst consensus confirms the divergence in conviction. Nike stock carries 17 Buys or Outperforms among 33 analysts covering it, with a mean target of $62 implying 39% upside from $44.
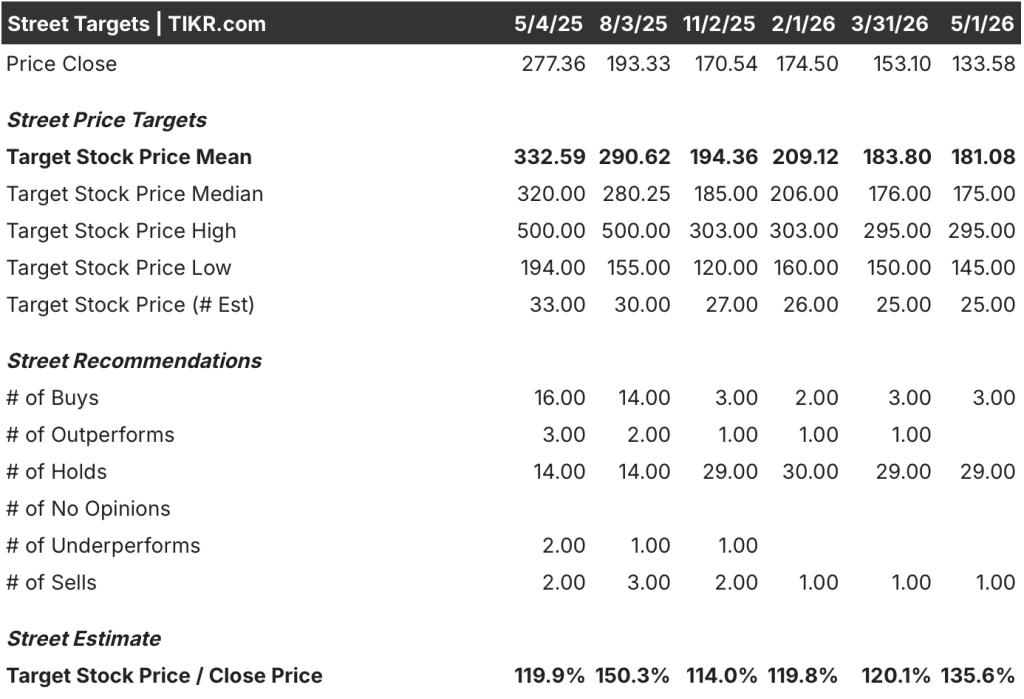
On the other hand, Lululemon stock has only 3 Buys among 33 analysts, with 29 Holds and a mean target of $181 implying 36% upside from $134. The upside percentages are similar. The conviction behind them is not.
A consensus of 29 Holds means most analysts see fair value near current levels with limited near-term catalyst. A consensus of 17 constructive ratings on Nike means the majority of the Street believes the reset is underpriced.
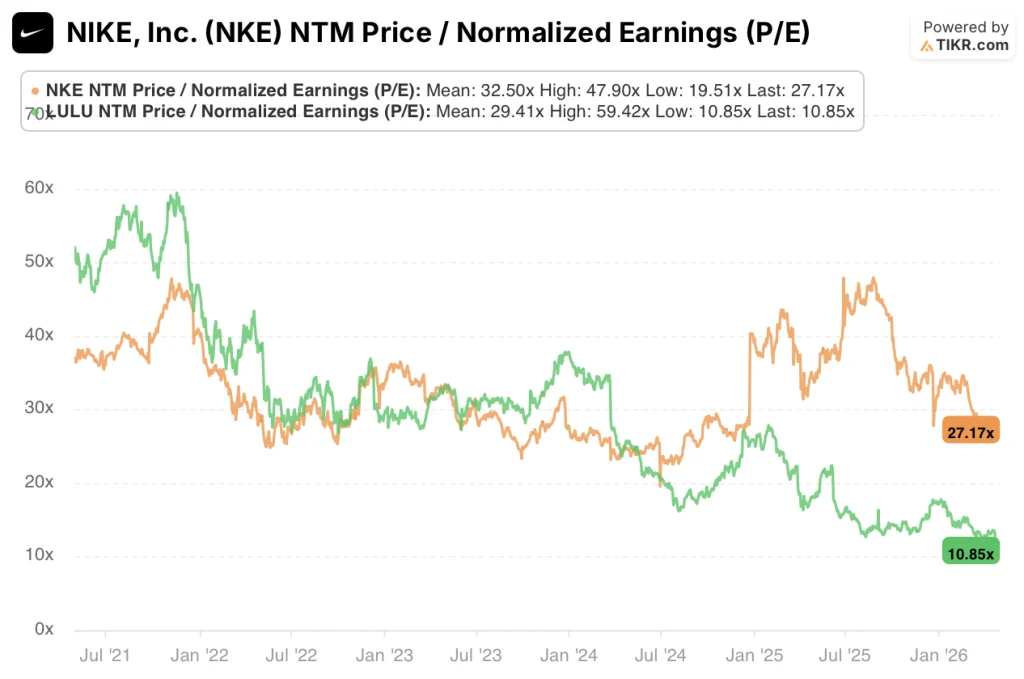
Nike stock appears undervalued at current levels, with the NTM P/E of 27.17x sitting below its 5-year mean of 32.50x, a discount that closes the moment operating margins begin recovering toward their historical range while Lululemon stock appears fairly valued, with the NTM P/E of 10.85x now at its 5-year low and less than half its mean of 29.41x, reflecting a market that has fully stripped out the growth premium and is pricing the business as a mature compounder.
Nike’s discount is a timing discount. Lululemon’s is a structural repricing, and those are harder to recover from.
Nike’s key risk: the wholesale channel rebuild stalls if key retail partners have already allocated shelf space to competitors permanently. If revenue growth does not inflect in FY27, the consensus EPS recovery timeline collapses.
Lululemon’s key risk: North American comparable sales turn negative. A second consecutive quarter of declining North America revenue would signal saturation, not normalization, and force further estimate cuts.
Nike’s catalyst to watch: the FY26 Q1 earnings call. Revenue inflection above the -0.1% consensus in FY26 is the single data point that confirms the Hill reset is gaining traction. Watch North America wholesale revenue specifically.
Lululemon’s catalyst to watch: international revenue as a percentage of total in the next quarter. If China and Europe are compounding at 20%-plus, the deceleration story becomes a geographic mix story, which is a much better setup for re-rating.
Why Lululemon Earns More From Less
The most important number in this comparison is not revenue growth. It is the gross margin gap.
Lululemon’s gross margins have held between 55.4% and 59.2% across five fiscal years, landing at 56.6% in FY26.
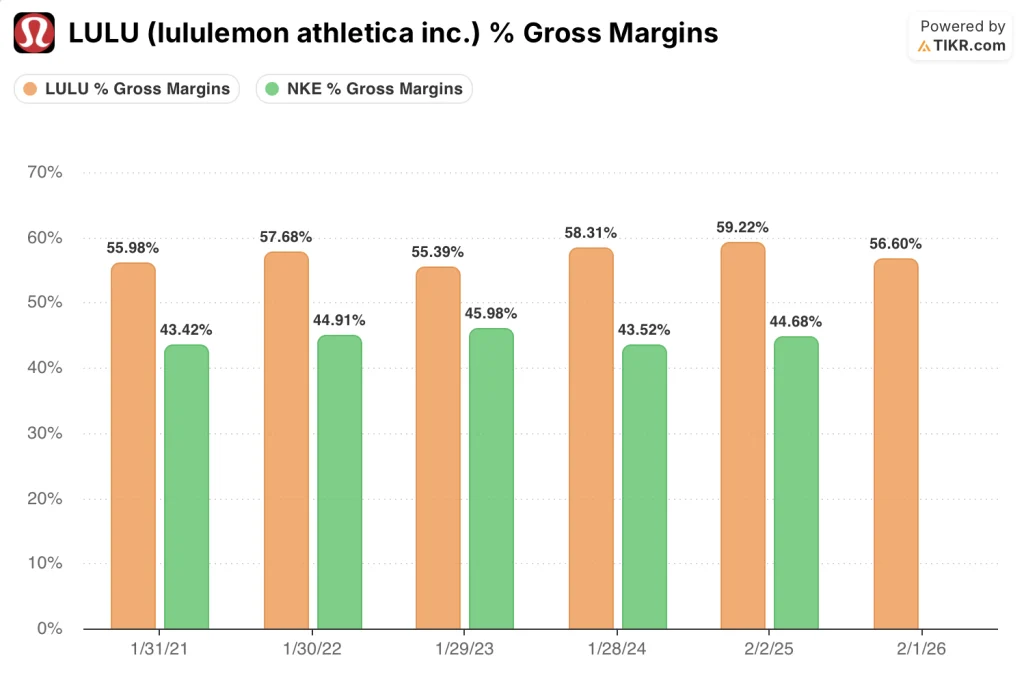
Nike’s gross margins have ranged from 43.5% to 46% across the same period and have now compressed to 42.7% in FY25, with the LTM figure deteriorating further to 40.9%. That is a roughly 1,500 basis point structural gap, and it explains why Lululemon generates better operating margins from a smaller revenue base.
Lululemon’s operating margins peaked at 23.7% in FY25 and compressed to 19.9% in FY26, a contraction driven by SG&A growth outpacing revenue growth as the company expanded internationally and invested in new categories.

Nike’s operating margins tell a worse story. They fell from 13.1% in FY24 to 8% in FY25, with the LTM sitting at 6.7%. The absolute level is nearly three times lower than Lululemon’s current margin despite Nike’s gross margins historically sitting within a workable range for a business of its scale and distribution mix.
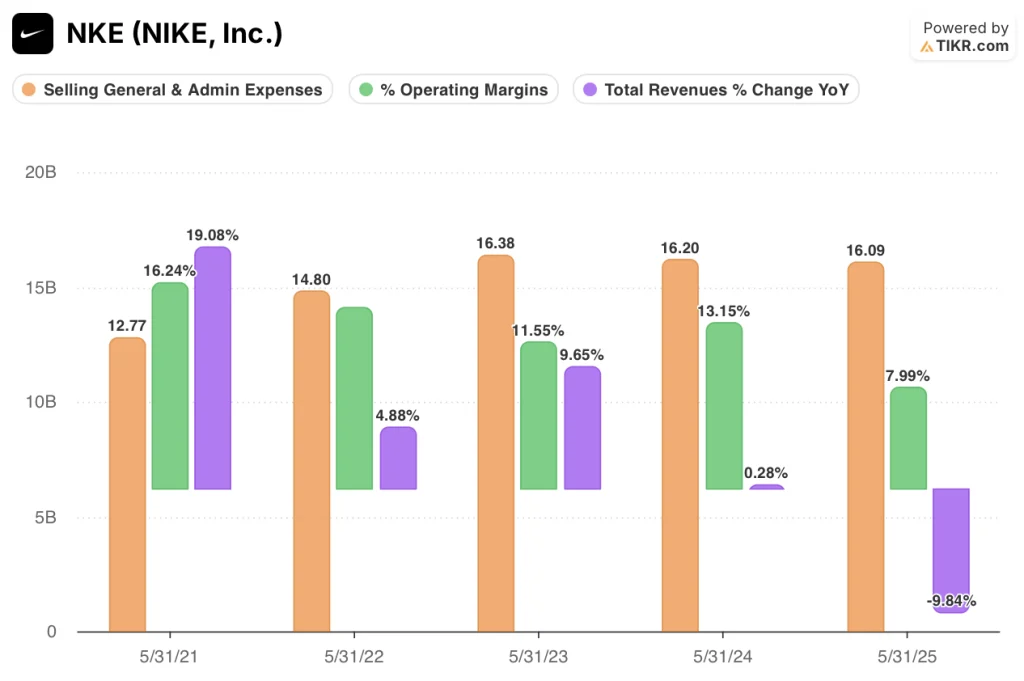
The operating leverage comparison is where the recovery argument for Nike stock becomes tangible. SG&A held relatively flat at $16.09B in FY25 versus $16.20B in FY24, meaning the operating margin collapse from 13.1% to 8.0% was driven by gross margin compression and a 9.8% revenue decline, not a permanent cost structure problem.
As revenue stabilizes and channel mix normalizes, the path back toward double-digit operating margins is structural, not speculative. Lululemon does not have a structural problem; it has a growth rate problem.
What Does the Valuation Model Say?
TIKR’s model prices Nike stock at a mid-case target of $90.24, a 103.2% total return from $44.40, built on a 4.5% revenue CAGR and a 6.9% net income margin assumption. That net income margin assumption is well below Nike’s 10-year historical average of 10.7%.
The model is not pricing in a full recovery. It is pricing in a partial one, and the stock still doubles.
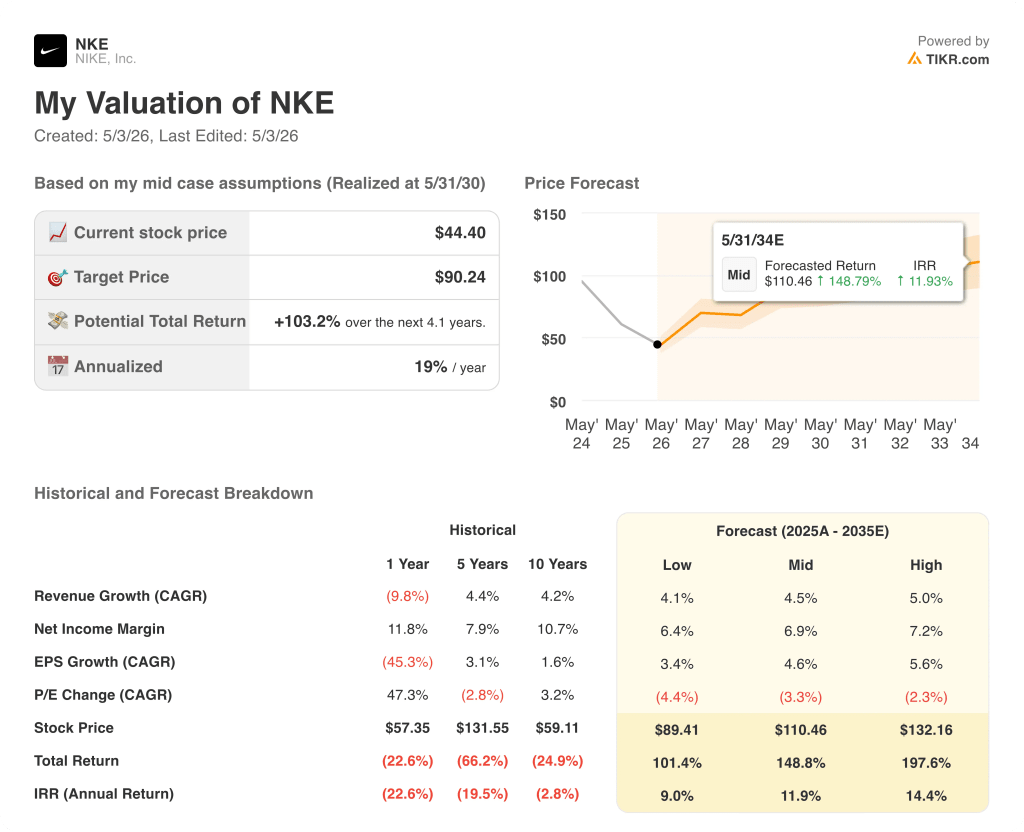
Nike stock appears undervalued at current levels, with the 19% IRR representing the most compelling return profile in the TIKR model relative to the risk embedded in the assumptions. The mid-case requires Nike to do less than it has historically done. That is a high-confidence setup for investors with a 4-year horizon.
TIKR’s model prices Lululemon stock at a mid-case target of $176.11, a 31.8% total return from $133.58, built on a 3.7% revenue CAGR and a 12.3% net income margin assumption. That margin assumption is credible. Lululemon has demonstrated it can sustain margins above 14% on a normalized basis.
The problem is the growth rate. A 3.7% revenue CAGR for a brand that compounded at 20.3% over five years reflects a business that has transitioned from growth equity to value equity.

Lululemon stock appears fairly valued, with the 6% IRR offering inadequate compensation for the execution risk embedded in the international expansion thesis. The mid-case total return of 31.8% over 4.7 years is a bond-like outcome from a consumer brand, not a recovery trade.
The IRR gap between Nike’s 19% and Lululemon’s 6% is the clearest signal in this comparison: the market has already partially repriced Lululemon for its new reality, while Nike is still being priced as if the recovery is not coming.
The central tension: Does Nike’s deeper discount compensate for a harder and longer recovery, or does Lululemon’s superior margin structure justify owning the slower compounder at a compressed multiple?
Should You Invest in Nike, Inc. or Lululemon Athletica Inc.?
Both Nike stock and Lululemon stock are down sharply from their highs, but the data behind each selloff tells a very different story. One is a turnaround with a credible plan and a 19% IRR. The other is a structural repricing that the Street has largely accepted.
The only way to know which side you’re on is to look at the numbers yourself. TIKR gives you free access to the same institutional-quality financial data professional analysts use to make exactly that call.
Pull up Nike, Inc. stock and Lululemon Athletica Inc. stock and you’ll see the full margin rebuild timeline, what consensus expects for revenue and EPS recovery in the quarters ahead, how the NTM P/E for both has moved against its 5-year mean, and whether analyst price targets are trending up or down.
You can build a free watchlist to track NKE and LULU alongside every other stock on your radar. No credit card required. Just the data you need to decide for yourself.
Access Professional Tools to Analyze X stock on TIKR for Free →