Key Takeaways
- PepsiCo stock carries a higher IRR at around 7% versus Coca-Cola stock’s ~6%, reflecting faster consensus revenue growth of about 5% in 2026 compared to KO’s 2%, giving PEP the edge in total return potential.
- TIKR’s valuation model targets $218for PepsiCo stock at a 37% total return versus $104 for Coca-Cola stock at a 32% total return, a gap anchored in PEP’s faster earnings recovery and snack portfolio reset.
- Coca-Cola stock’s operating margin of approximately 31% is nearly double PepsiCo stock’s 16%, a structural gap that makes KO the higher-quality compounder even at a premium multiple.
Coca-Cola Stock (KO) : Key Stats
- Price (Apr 30, 2026): $79
- 52-Week Range: $65 – $82
- Market Cap: $338.9B
- Enterprise Value: $371.1B
- Analyst Mean Target: $86
- Analyst Consensus: 12 Buys | 7 Outperforms | 4 Holds | 0 Sells
PepsiCo Stock (PEP) : Key Stats
- Price (Apr 30, 2026): $158
- 52-Week Range: $128 – $171
- Market Cap: $216.6B
- Enterprise Value: $258.7B
- Analyst Mean Target: $172
- Analyst Consensus: 4 Buys | 4 Outperforms | 14 Holds | 1 Sell
The Beverage Giant vs. the Snack Empire
Coca-Cola (KO) earns the overwhelming majority of its revenue from concentrates and syrups sold to bottling partners.
That capital-light model keeps its cost structure thin and its margins wide. The company does not manufacture the physical product the consumer buys, which insulates it from aluminum, PET, and labor costs that pressure its bottlers directly.
In Q1 2026, incoming CEO Henrique Braun reported 3% unit case volume growth across all operating segments, 10% organic revenue growth, and comparable EPS up 18% year-over-year.
The company raised full-year EPS guidance to 8% to 9% growth. It has extended its streak of value share gains for 20 consecutive quarters.
Its 64 consecutive years of dividend increases are backed by a balance sheet sitting at 1.76x net debt/EBITDA, below its own target range of 2x to 2.5x.
PepsiCo (PEP) is a structurally different business, and the difference is Frito-Lay.
The snack division operates through a direct-store-delivery network that stocks Lays, Doritos, and Tostitos across U.S. grocery and convenience shelves with a density no competitor replicates. That asset creates enormous operating leverage when the category grows, and a meaningful drag when it does not.
In 2024 and early 2025, post-pandemic pricing fatigue pushed snack volumes negative and cost PepsiCo shelf space at major retailers.
The brand restage launched last year is now showing results. North America Foods posted 2% volume growth and 4% growth in consumption units in Q1 2026, the first sustained sequential improvement since the reset began. CEO Ramon Laguarta cited 300 million incremental consumption occasions versus Q1 2025.
PepsiCo has now raised its full-year guidance and confirmed it is gaining value share in IRI data for the first time in multiple quarters.
The investment question is whether PepsiCo’s P/E discount reflects a permanent structural penalty for lower margins, or a cyclical reset the data suggests is already reversing.
Wall Street’s Take: KO vs. PEP
Coca-Cola’s pure-play model gives analysts a narrow, consistent revenue base to forecast.

Consensus has Coca-Cola stock at 2% revenue growth in 2026, reaching $49.1B, with EBITDA expanding to $17.3B at 35.2% margins. EPS normalized is expected at $3.26, up around 9% year-over-year. FCF is projected at $11.9B, a 124% jump from $5.3B in 2025, as working capital normalizes.

With consensus DPS of $2.16 in 2026 against EPS of $3.26, the payout ratio sits at approximately 66%.

Meanwhile, PepsiCo stock carries consensus revenue growth of 5% in 2026, reaching $98.9B, with EBITDA at $19.5B. FCF is projected at $11.1B, up ~45% from $7.7B in 2025, as productivity savings from plant closures and headcount reductions flow through.

With consensus DPS of $5.87 in 2026 against EPS of $8.66, PepsiCo’s payout ratio also sits at approximately 68%.
Both companies return roughly two-thirds of earnings to shareholders. The difference is in what you pay for that income stream.
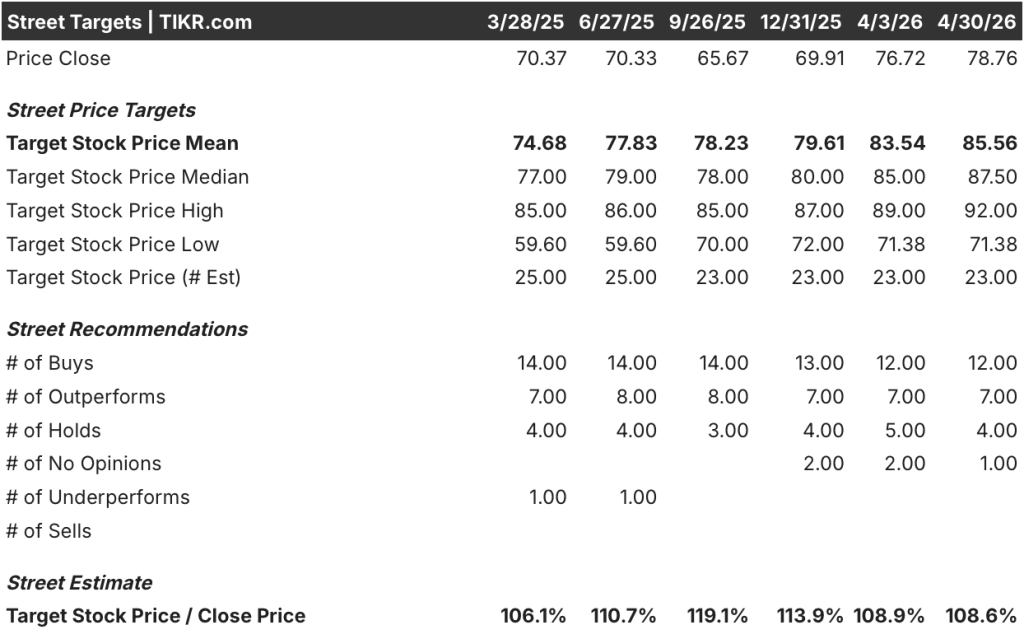
KO carries 12 buys and 7 outperforms against 4 holds and no sells, with a mean target of $86 implying 8.6% upside.

PEP shows 4 buys and 4 outperforms against 14 holds and 1 sell, with a mean target of $172 implying 8.3% upside.
The implied upsides are nearly identical. The conviction shapes differ: KO’s is concentrated in buys, PEP’s in holds, consistent with a market waiting on the North America Foods recovery before upgrading.

Coca-Cola stock appears fairly valued at current levels, trading at 23.84x NTM earnings, just above its 5-year mean of 23.29x, with a 2.7% forward yield. The market is pricing KO at its historical norm, not at a discount.

PepsiCo stock appears undervalued at current levels, trading at 17.98x NTM earnings, well below its 5-year mean of 21.71x and near a 5-year low of 16x. The 3.7% forward yield at this multiple is not a value trap: it reflects a compressed entry point on a business whose earnings recovery is already underway.
The 130-basis-point IRR gap between PepsiCo stock at 6.8% and Coca-Cola stock at 5.5% compounds materially over a 4.7-year hold, and that gap sits on top of a yield advantage of 100 basis points that pays investors to wait.
The key risk in Coca-Cola stock is sustained price/mix compression. Q1 2026 price/mix came in at just 2%, weighed down by Easter timing, geographic mix in Latin America, and lower-income consumer pressure in North America. If that persists, the Street’s 35.2% EBITDA margin assumption gets tested.
The key risk in PepsiCo stock is a stall in the North America Foods recovery. Fifty percent of shelf resets are still in process and most new innovation sits at 40% to 50% ACV. If repeat rates disappoint heading into peak summer season, volume share gains reverse before showing up in organic revenue.
The catalyst to watch in Coca-Cola stock is Q2 2026 price/mix. A recovery above 2.5% confirms the Q1 softness was timing, not trend.
The catalyst to watch in PepsiCo stock is North America Foods organic revenue in Q2 2026, when Siete becomes organic and shelf resets are complete. A move toward 3% would shift analyst sentiment from hold to outperform.
Financials: The Profitability Race
The margin gap between these two businesses is not a management story. It is a business model story.
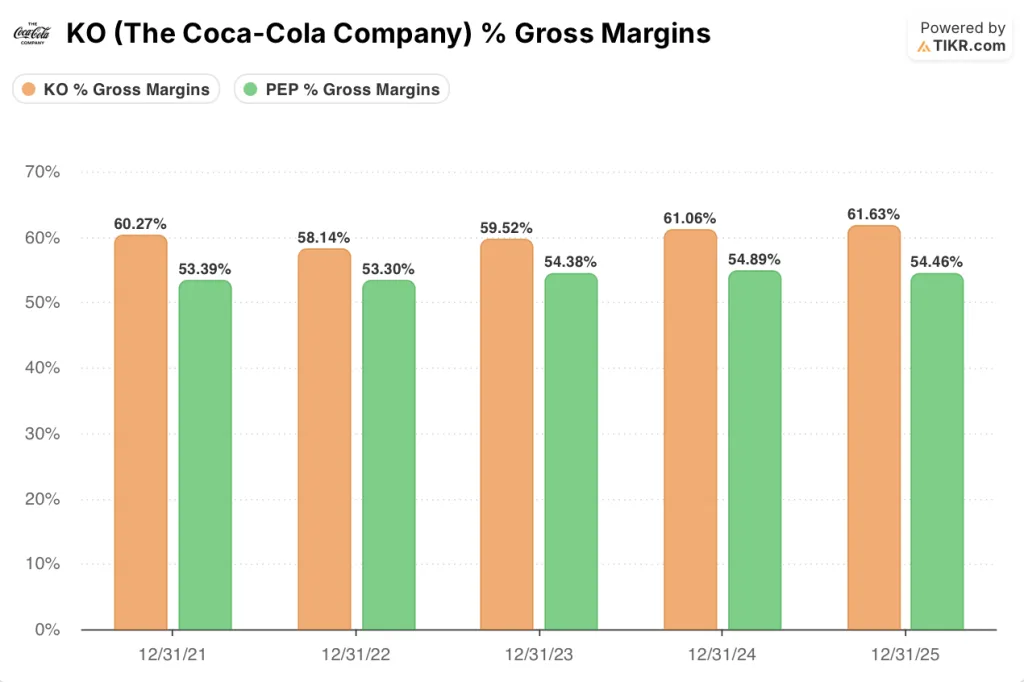
Coca-Cola’s 61.6% gross margin in 2025 reflects a franchise structure where cost of goods means concentrates and syrups, not cans, bags, or bottling lines. PepsiCo’s 54.5% gross margin reflects a company that manufactures physical product at scale across both beverages and snacks.
That 710-basis-point gap is structural and permanent.

The operating margin divergence is even larger. Coca-Cola expanded from 29.0% in 2023 to 31.3% in 2025, a 230-basis-point improvement over two years without a restructuring program. PepsiCo ran 15.3% in 2023, 16.2% in 2024, and compressed back to 16% in 2025 as the snack reset weighed on North America Foods.
The 15.3-percentage-point operating margin gap is the single number that explains why KO trades at 23.84x NTM earnings and PEP trades at 17.98x.
What PepsiCo’s income statement does offer is optionality.

Operating income grew just 0.7% in 2025 on 2.3% revenue growth. The margin is still suppressed. A business operating below its structural ceiling has more room to grow earnings faster than revenue on recovery. Coca-Cola does not have that setup.

Revenue growth tells the same story in reverse. Coca-Cola decelerated from 11.3% in 2022 to 1.9% in 2025, consistent with a mature franchise holding its ground. PepsiCo decelerated from 8.7% in 2022 to 0.4% in 2024 before recovering to 2.3% in 2025.
PEP stock’s 5.3% consensus for 2026 versus KO stock’s 2% reflects the snack recovery embedded in analyst models, a recovery Q1 data has begun to confirm.

FCF conversion reinforces the picture. PepsiCo’s FCF margin was 8.2% in 2025, expected to expand to 11.2% in 2026 as productivity savings hit.
Coca-Cola’s FCF margin was 11% in 2025, expected to reach 24% in 2026 as working capital normalizes and the company releases cash held in reserve pending resolution of an ongoing IRS tax dispute, which management flagged as a key reason leverage sits below its own target range.
Where the income picture gets interesting is dividends. Both companies are Dividend Kings paying out roughly two-thirds of earnings — KO at approximately 66% (consensus DPS $2.16 against EPS $3.26) and PEP at approximately 68% (consensus DPS $5.87 against EPS $8.66). The payout discipline is identical.
The yield is not. Coca-Cola stock yields 2.7% on a forward basis. PepsiCo stock yields 3.7%. That 100-basis-point gap is entirely a function of PEP’s lower valuation, not a difference in income commitment.

Forward P/E makes the same point from a different angle. KO trades at 23.84x NTM earnings. PEP trades at 17.98x. For investors buying a dividend stream, PepsiCo stock offers the same payout ratio and a higher yield at a 24% discount to Coca-Cola’s multiple. That gap is the core of the investment case for PEP.
Valuation Model Take + Head-to-Head Scenario Breakdown
TIKR’s mid-case model targets $104 for Coca-Cola stock, a 32.1% total return including dividends over around 5 years at a 5.5% IRR.

Coca-Cola stock appears fairly valued at current levels, with the market already pricing in franchise quality at 23.84x NTM earnings and a 2.7% yield.
Meanwhile, TIKR’s mid-case model targets $218 for PepsiCo stock, a around 37% total return including dividends over the same period at around 7%% IRR.

PepsiCo stock appears undervalued at current levels, trading at 17.98x NTM earnings with a 3.7% yield while the margin recovery is still playing out.
PepsiCo stock’s 37.4% total return outpaces Coca-Cola stock’s 32.1%, and more of that return arrives as income given PEP’s 100-basis-point yield advantage.
The central tension in this comparison: whether PepsiCo’s operating leverage opportunity during a snack recovery is worth accepting structurally lower margins than Coca-Cola’s franchise model will ever produce.
The Case for Coca-Cola Stock
- Gross margin of 61.6% in 2025 reflects the structural advantage of a concentrate-and-franchise model that insulates KO from physical supply chain costs.
- Operating margin expanded 230 basis points from 2023 to 2025, reaching 31.3%, without a major portfolio restructuring or cost-cutting program.
- LTM net debt/EBITDA of 1.76x sits below the company’s own target range of 2x to 2.5x, leaving room for incremental capital return while maintaining investment-grade ratings.
- 64 consecutive years of dividend increases, with consensus DPS expected at $2.16 in 2026 and $2.27 in 2027, providing income compounding that partially offsets KO’s slower price appreciation potential.
- Q1 2026 comparable EPS growth of 18% year-over-year, powered by operating expense efficiencies and equity income from bottling partners, exceeded Street estimates by nearly 6%.
The Case for PepsiCo Stock
- TIKR model IRR of 6.8% annualized gives PEP a 130-basis-point return advantage over KO on the mid-case, compounding to 37.4% total return by the end of the model period.
- North America Foods posted 300 million incremental consumption occasions in Q1 2026 versus Q1 2025, with value share gains confirmed in IRI data for the first time in multiple quarters.
- FCF consensus jumps 44.8% in 2026 to $11.1B, with FCF margins expanding from 8.2% in 2025 to 11.2%, as productivity savings from plant closures and headcount reductions flow through the income statement.
- PEP’s 52-week low of $127.60 represents a 19.5% decline from the 52-week high, a drawdown not seen in KO over the same period, creating a lower-cost entry point for investors willing to hold through the turnaround completion.
- Revenue growth consensus of 5.3% in 2026 is more than 2.5x Coca-Cola’s 2.0%, driven by international acceleration, PBNA’s 9% top-line growth combining organic gains and acquired platforms including poppi, and North America Foods returning to positive volume.
Should You Invest in The Coca-Cola Company or PepsiCo, Inc.?
The only way to really know is to look at the numbers yourself. TIKR gives you free access to the same institutional-quality financial data that professional analysts use to answer exactly that question.
Pull up X stock and you’ll see years of historical financials, what Wall Street analysts expect for revenue and earnings in the quarters ahead, how valuation multiples have moved over time, and whether price targets are trending up or down.
You can build a free watchlist to track X alongside every other stock on your radar. No credit card required. Just the data you need to decide for yourself.
Access Professional Tools to Analyze X stock on TIKR for Free →