Key Takeaways
- Lockheed Martin (LMT) reported Q1 2026 revenue of $18.0 billion, flat year over year, with EPS of $6.44 missing consensus by $0.30 and free cash flow turning negative at $(291) million; full-year FCF guidance of $6.5–$6.8 billion was reaffirmed.
- RTX Corporation (RTX) delivered Q1 2026 adjusted revenue of $22.1 billion, up 10% organically, with adjusted EPS of $1.78, beating consensus by $0.26 and free cash flow of $1.3 billion, rising 65% year over year; RTX raised full-year adjusted EPS guidance to $6.70–$6.90.
- LMT trades at an NTM P/E of 16.75x and an NTM EV/EBITDA of 11.85x, with a mean analyst target of $641.35, implying around 26% upside from $509.81; RTX trades at an NTM P/E of 25.07x with a mean analyst target of $216.16, implying around 25% upside from $172.79.
- TIKR’s mid-case model projects LMT reaching around $770 by year-end 2030 (around 51% total return, around 9% annualized IRR) versus RTX reaching around $210 (around 22% total return, around 4% annualized IRR).
Now Live: Discover how much upside your favorite stocks could have using TIKR’s new Valuation Model (It’s free) >>>
Two Defense Giants, Two Very Different Q1 Stories
Defense stocks have climbed sharply after President Trump proposed raising the U.S. defense budget from $1 trillion to $1.5 trillion for 2027. Both Lockheed Martin and RTX sit at the center of the programs that budget prioritizes: missile defense, air superiority, and precision strike.
Their Q1 2026 earnings reports, however, told strikingly different stories. RTX delivered double-digit organic sales growth and raised its full-year outlook, closing the quarter with a record $271 billion backlog, according to RTX’s Q1 2026 earnings release. Lockheed missed both EPS and revenue estimates, with the stock dropping over 3% on the day and extending a multi-week losing streak.
The two companies compete directly in missile systems and integrated air defense. Beyond that overlap, they are structurally different. Lockheed is a pure-play defense contractor: every dollar flows from government contracts. RTX combines Raytheon’s defense franchise with Pratt & Whitney’s commercial engine business and Collins Aerospace’s avionics, giving it exposure to two markets that don’t contract at the same time. That structural difference is the foundation of this comparison. The central question: at current prices, which stock offers better risk-adjusted upside?
Lockheed Martin: The World’s Largest Defense Contractor, Under Near-Term Pressure
Lockheed Martin (LMT) operates across four segments: Aeronautics (led by the F-35 fighter), Missiles and Fire Control (MFC), Rotary and Mission Systems (RMS), and Space. The business is built for durability, multi-decade government relationships, programs with trillion-dollar lifecycle values, and a backlog that supports years of revenue visibility.
The MFC segment is the growth engine right now. Lockheed signed a 7-year framework agreement with the Department of War to ramp Patriot production from 650 to 2,000 missiles annually, structured with cash-flow-neutral advance payments and inflation escalators. CEO Jim Taiclet captured the backdrop on the Q1 2026 earnings call: “The administration’s prioritization of defense industrial base investment and modernization spending provides a constructive backdrop as we execute against our significant backlog.”
The financials show both the durability and the near-term friction. LMT generated $75.0 billion in 2025 revenue. In Q1 2026, MFC grew 8% year over year, and Space grew 7%, but Aeronautics declined 1% due to F-16 design rework and C-130 supply chain issues carried over from 2025. Full-year FCF guidance is $6.5–$6.8 billion, with CapEx rising to $2.5–$2.8 billion in 2026 to fund production ramps. Classified programs in Aeronautics and MFC are expected to consume an estimated $500–$700 million in cash per year through 2027, per Lockheed Martin’s Q1 2026 earnings call.
Key Stats (as of April 29, 2026):
- Mean analyst target: $641.35 (~26% upside)
- Stock price: $509.81 | Market cap: $117.5 billion
- NTM P/E: 16.75x | NTM EV/EBITDA: 11.85x | NTM MC/FCF: 14.12x
- LTM Gross Margin: 9.9% | LTM EBIT Margin: 8.9%
- NTM FCF Yield: 7.1% | Dividend yield: 2.8%
See what analysts think about LMT stock right now (Free with TIKR) >>>
RTX: The Dual-Engine Compounder That Beat and Raised
RTX Corporation (RTX) operates through three segments: Collins Aerospace (avionics and aftermarket services), Pratt & Whitney (the GTF commercial engine powering around 45% of Airbus A320 deliveries and the F135 military engine), and Raytheon (Patriot, Tomahawk, AMRAAM, and the Standard Missile family). No other major defense contractor combines these three at this scale.
The commercial business provides structural insulation. When defense budgets tighten, Pratt’s aftermarket, built on over 85,000 engines in service globally, continues generating cash from maintenance contracts that airlines cannot defer. The two cycles run on different clocks, and RTX sits at both intersections simultaneously.
That dynamic showed in Q1 2026. The commercial aftermarket grew 14% year over year. Defense grew 9%. Segment operating profit of $2.9 billion rose 14% year over year, with RTX expanding consolidated segment margins 70 basis points despite absorbing approximately $170 million in tariff headwinds. Raytheon specifically expanded margins 150 basis points to 12.2%, with a rolling 12-month book-to-bill of 1.48, according to the RTX Q1 2026 earnings call. RTX raised full-year adjusted EPS guidance to $6.70–$6.90 and adjusted sales to $92.5–$93.5 billion. CEO Chris Calio stated in RTX’s Q1 2026 earnings release: “Given our first quarter performance and the strength we’re seeing in our defense business, we are increasing adjusted sales and EPS in our full year outlook.”
Key Stats (as of April 29, 2026):
- Mean analyst target: $216.16 (~25% upside)
- Stock price: $172.79 | Market cap: $232.7 billion
- NTM P/E: 25.07x | NTM EV/EBITDA: 16.70x | NTM MC/FCF: 26.10x
- LTM Gross Margin: 20.2% | LTM EBIT Margin: 12.0% | LTM ROIC: 10.2%
- NTM FCF Yield: 3.8% | Dividend yield: 1.7% (56 consecutive years of payments)
Analyze RTX stock on TIKR Free →
Revenue Growth, Margins, and Cash Flow: Where the Numbers Diverge
RTX is the larger company, $88.6 billion in 2025 revenue versus LMT’s $75.0 billion. Both are growing at a mid-single-digit CAGR, but the execution quality has been meaningfully different recently. RTX beat consensus revenue expectations in all five of its last reported quarters. LMT missed in two of its last five, including Q1 2026, by approximately 1.3%.
On profit margins, RTX runs an LTM gross margin of 20.2% and LTM EBIT margin of 12.0%, versus LMT’s 9.9% gross margin and 8.9% EBIT margin. The gap reflects business mix: RTX’s high-margin commercial aftermarket and MRO work blend with defense contracts in a way that lifts the blended margin profile above a pure-play defense model.
Free cash flow is where the near-term case for LMT gets complicated. LMT’s current LTM levered FCF is approximately $4.0 billion. RTX’s is approximately $7.2 billion, and grew 65% year over year in Q1 2026 alone. LMT posted a negative FCF of $(291) million in Q1 2026, driven by an ERP billing system transition and higher CapEx. Management expects this to resolve by Q2, with full-year guidance intact. But with an estimated $500–$700 million per year in classified program cash drag layered on top of a $1 billion year-over-year CapEx increase, patience is required.


Get the most up-to-date financial data on 100K+ stocks with TIKR (It’s free) >>>
Valuation: Cheap for a Reason, or Genuinely Mispriced?
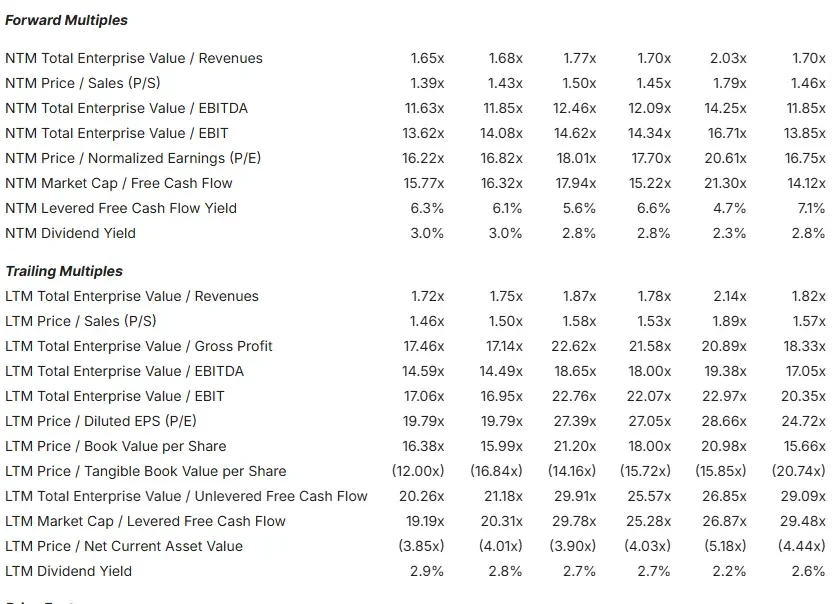
LMT is cheaper on every forward multiple. At an NTM P/E of 16.75x, it trades well below RTX’s 25.07x. On NTM EV/EBITDA, LMT is at 11.85x versus RTX’s 16.70x. Across the aerospace and defense peer group, LMT sits near the bottom of the valuation multiples range, below General Dynamics, Northrop Grumman, and RTX itself.
The discount reflects three specific concerns: execution risk from two recent estimate misses and limited classified program visibility; revenue concentration with 100% of LMT’s revenue tied to government contracts; and a near-term CapEx cycle that compresses free cash flow before the munitions ramp revenue materializes.
RTX’s premium reflects consistent execution, the commercial buffer, and backlog scale: $271 billion versus LMT’s approximately $186 billion, per each company’s Q1 2026 earnings release. The tension is visible in the numbers: LMT’s classified program headwinds are compressing near-term cash flow at exactly the moment its missile demand outlook has never looked stronger.

See analysts’ full growth forecasts for LMT and RTX (Free with TIKR) >>>
What Wall Street Is Saying
On LMT, the current analyst breakdown is 5 Buys, 2 Outperforms, 14 Holds, 2 Underperforms, and 1 Sell, with a mean price target of $641.35, implying around 26% upside from $509.81. Multiple analysts cut targets after Q1, citing classified program and cash flow concerns. The bull case is well understood — the FY2027 F-35 budget request of 85 aircraft (up from 47 the prior year, per the LMT Q1 2026 earnings call) and the $4.8 billion fully funded PAC-3 contract signed in April 2026 are visible catalysts. The debate is whether they arrive on schedule.

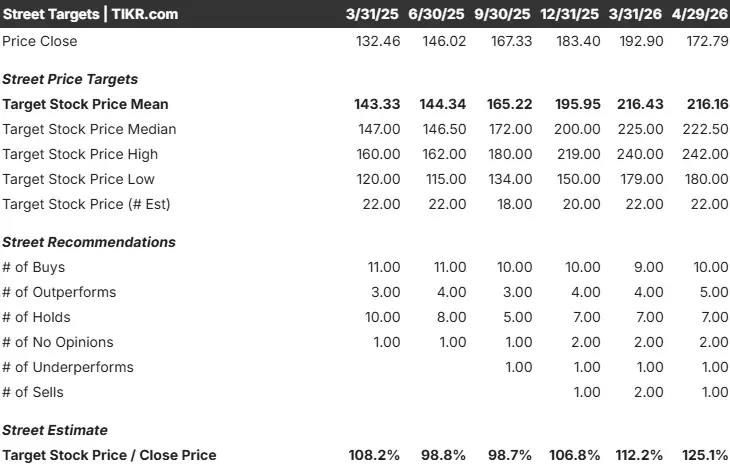
On RTX, the breakdown is 10 Buys, 5 Outperforms, 7 Holds, 2 No Opinions, 1 Underperform, and 1 Sell, with a mean price target of $216.16, implying around 25% upside from $172.79. The higher Buy concentration reflects RTX’s more recent beat-and-raise record and cleaner earnings visibility.
Estimate a stock’s fair value in under a minute (Free with TIKR) >>>
What the TIKR Model Says About Long-Term Upside
TIKR’s mid-case valuation model, with assumptions realized at year-end 2030, projects the following for each company:
LMT mid-case: Around $770 target price from $509.81, around 51% total return, around 9% annualized IRR. The model assumes a revenue CAGR of around 4% and a net income margin of around 10%. Key drivers are MFC growth from the munitions ramp and stable F-35 production and sustainment. Primary risk: further classified program charges compress earnings below the mid-case.

RTX mid-case: Around $210 target price from $172.79, around 22% total return, around 4% annualized IRR. The model assumes a revenue CAGR of around 4% and a net income margin of around 11%. Key drivers are Raytheon framework agreement deliveries and sustained GTF MRO demand. Primary risk: commercial aviation demand softening faster than expected, pressuring both new engine deliveries and aftermarket volumes simultaneously.

The gap, around 9% annualized for LMT versus around 4% for RTX, comes from the valuation starting point. LMT enters the model at a much lower price, creating arithmetic upside even in a conservative scenario. In the high case, LMT reaches around $1,151 (around 126% total return). RTX’s high case reaches around $286 (around 66% total return). RTX needs its margin expansion story to execute cleanly to justify current levels. LMT needs its second half to deliver on the guidance it just reaffirmed.
The Higher-Return Bet vs. The Steadier Compounder
LMT is the higher-upside case for investors who believe the near-term headwinds are temporary and the current 16.75x NTM P/E undervalues a business whose earnings are about to inflect. The missile ramp, the F-35 demand signal, and Taiclet’s confidence in full-year guidance all point toward a materially stronger second half. For investors willing to hold through the noise, LMT offers cheap valuation multiples, a 7.1% NTM FCF yield, a 2.8%dividend yield, and a missile backlog that compounds for a decade. The risk is that classified program charges resurface and the market loses patience before the inflection arrives.
RTX is the better fit for investors who prioritize consistent execution and lower volatility. The beat-and-raise Q1, the record $271 billion backlog, the 56-year dividend history, and the structural insulation of Pratt’s commercial aftermarket all support a compounding thesis. The risk is that RTX’s 25x NTM P/E leaves little room for disappointment. Any combination of commercial aviation softening, Pratt cost pressure, or Raytheon production bottlenecks could compress the multiple faster than earnings growth absorbs it.
The TIKR model gives LMT roughly twice the annualized return at current prices. That spread exists because LMT is the cheaper stock, not because its business is fundamentally superior to RTX’s. Whether that cheapness is a mispricing in a generational defense spending cycle is the question each investor has to answer for themselves.
Looking for New Opportunities?
- See what stocks billionaire investors are buying so you can follow the smart money.
- Analyze stocks in as little as 5 minutes with TIKR’s all-in-one, easy-to-use platform.
- The more rocks you overturn… the more opportunities you’ll uncover. Search 100K+ global stocks, global top investor holdings, and more with TIKR.
Disclaimer:
Please note that the articles on TIKR are not intended to serve as investment or financial advice from TIKR or our content team, nor are they recommendations to buy or sell any stocks. We create our content based on TIKR Terminal’s investment data and analysts’ estimates. Our analysis might not include recent company news or important updates. TIKR has no position in any stocks mentioned. Thank you for reading, and happy investing!