

Earnings per share is the number the market tends to anchor on most heavily when pricing a stock. It’s the denominator in the P/E ratio, the figure analysts revise up and down in response to new information, and the metric that tends to drive the most immediate price reaction when a company reports quarterly results. Understanding how EPS is likely to grow over the next several years isn’t just an academic exercise. It’s the foundation of almost every valuation approach that actually works.
The challenge is that forecasting Earnings Per Share requires you to make assumptions about revenue growth, margin expansion or compression, share count changes, and tax rates, all of which interact in ways that aren’t always obvious. Get one of those inputs meaningfully wrong, and your EPS estimate can be off by a wide margin even if the overall business performs roughly as expected. That’s why starting with analyst consensus data and then stress-testing it against the company’s own historical trends produces better results than either approach on its own.
This article walks through how to build a practical EPS forecast, where analyst estimates are most useful, where they tend to be wrong, and how to layer in your own assumptions to arrive at a number you actually have conviction in.
Analyst EPS estimates are a useful starting point, but the investors who use them best are those who understand exactly which assumptions are baked in and where those assumptions are most likely to break.
Find out what a stock’s really worth in under 60 seconds with TIKR’s new Valuation Model (It’s free)>>>
What Drives EPS Growth
EPS growth comes from three sources, and understanding the relative contribution of each tells you a lot about the quality of the earnings trajectory. The first is revenue growth, which expands the top line and flows through to earnings depending on the margin structure.
The second is margin expansion, where a company earns a larger percentage of each revenue dollar as profit, either through operating leverage, cost discipline, or a shift in business mix. The third is share count reduction, where buybacks reduce the denominator of the EPS calculation, mechanically increasing per-share earnings even without any change in total net income.
The most durable EPS growth comes from the first two sources. A company growing revenue at 15% annually with expanding margins is compounding its earnings base in a way that can sustain for years. EPS growth driven primarily by buybacks is real but more fragile, because it depends on the company continuing to allocate capital to repurchases rather than reinvesting in growth or managing through a difficult period.
When you’re evaluating an analyst’s EPS forecast, it’s worth decomposing which of these three drivers is doing the heavy lifting. A forecast that assumes aggressive margin expansion without a clear operational reason for it deserves more scrutiny than one grounded in a well-established revenue growth trend.
See an Earnings Per Share example instantly with TIKR >>>
How to Read Analyst Consensus Estimates
Wall Street analyst estimates represent the aggregated views of sell-side researchers who closely cover a company, model its financials in detail, and regularly update their forecasts in response to earnings releases, management guidance, and industry data. The consensus, typically expressed as the average or median estimate across all covering analysts, is the market’s best collective guess at what a company will earn.

Consensus estimates are most reliable in stable, mature businesses with predictable revenue streams and well-understood cost structures. They become less reliable for high-growth companies where small changes in revenue assumptions produce large swings in EPS, for businesses going through structural transitions, and for any company where management guidance is limited or historically unreliable.
Estimate revisions matter as much as the estimates themselves. A stock where analysts have been consistently raising their EPS forecasts over the past several quarters is very different from one where estimates have been drifting lower.
Revision momentum tends to be persistent in both directions, and tracking which way the consensus is moving is often more informative than the absolute level of the estimate.
Find the best high-flying growth stocks to buy now with TIKR >>>
Building Your Own EPS Forecast
The most practical approach starts with analyst consensus as a baseline, then adjusts specific inputs based on your own read of the business. You don’t need to rebuild the entire model from scratch. You need to identify the two or three assumptions that matter most and form a view on whether the consensus is too optimistic or too conservative on each one.
Revenue growth is usually the most important input. Pull the company’s historical revenue growth rate over three to five years, look at how it has trended, and compare that to what analysts are projecting forward. If the consensus assumes a meaningful reacceleration from current growth rates, understand what drives that assumption. If it assumes a gradual deceleration, assess whether the business has the competitive position to maintain its growth rate above market expectations.
Gross margin and operating margin trends are the next layer. A company with steadily expanding gross margins over several years has a structural tailwind that flows directly to EPS. A company with compressing margins needs to grow revenue faster just to hold earnings flat.
Project out a reasonable margin scenario based on the historical trend, apply it to the revenue forecast, and you have a simplified but functional earnings model that you can compare directly to the analyst consensus.
Where Analyst Estimates Fall Short
Analysts are systematically better at forecasting near-term results than long-term ones, which is intuitive given that near-term guidance from management is more specific and recent data points are more relevant. For one-and-a-quarter forward estimates, the consensus is usually in the right ballpark.
For two and three-year forward estimates, the range of outcomes is wide enough that the consensus number is better understood as a directional indicator than a precise prediction.
Analysts also tend to underestimate the durability of strong businesses and the severity of problems in deteriorating ones. Mean reversion is a powerful force in financial forecasting, and models built around historical averages will systematically miss companies that are genuinely improving or losing their competitive position.
Those are exactly the situations where doing your own work on the business, rather than simply accepting the consensus, produces the most differentiated insight.

One practical check is to look at a company’s history of beats and misses. If actual results have consistently come in above what analysts projected, you’re dealing with a business that tends to outperform expectations.
If results have persistently fallen short, that pattern is worth weighing in your own forecast. TIKR’s Beats & Misses subtab inside the Estimates tab surfaces this history directly, showing how reported results have tracked against consensus over time across revenue, EBITDA, and EPS.
How to Use TIKR to Build EPS Forecasts
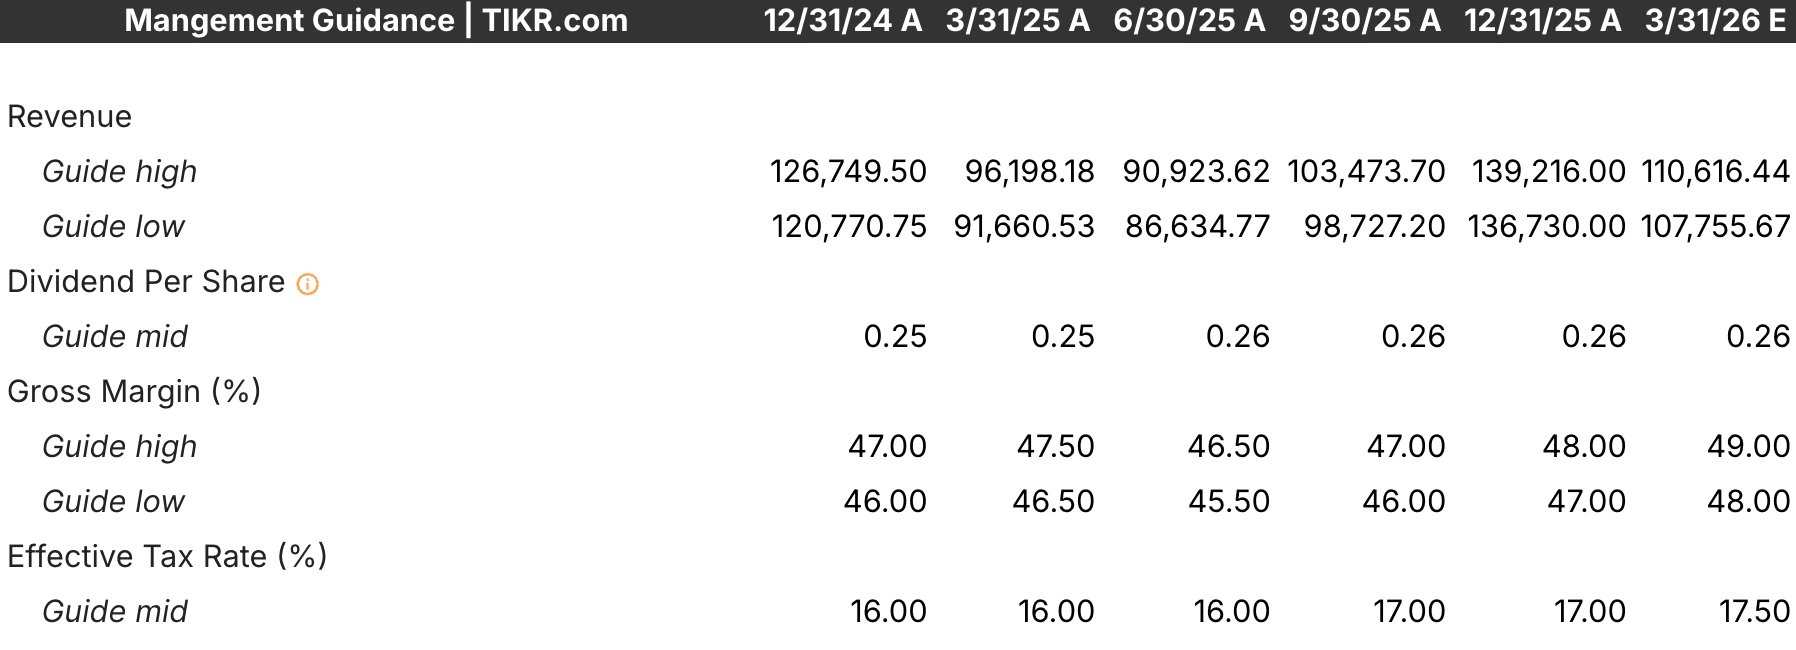
TIKR’s Estimates tab is the most direct tool for this kind of work. The Actuals and Forward Estimates section shows historical reported EPS alongside analyst consensus forecasts for the next several years, with the number of analysts contributing to each estimate visible alongside the average and median. The Management Guidance subtab shows what the company itself has guided for revenue, margins, and earnings, which is the most direct input into any near-term forecast.

The Valuation Model Hub takes this a step further. You can build a guided model by answering three inputs: revenue growth, operating margins, and an exit multiple. TIKR automatically generates a baseline using Wall Street consensus and historical data, and you can adjust any input to reflect your own assumptions.
The model updates in real time, showing you the implied target price and return under your specific scenario. For more granular work, the advanced model lets you edit individual line items, including share count, dividends, and EBIT margins, producing a full multi-year earnings forecast that you can compare directly against the consensus.
Discover how much upside your favorite stocks could have using TIKR’s new Valuation Model (It’s free) >>>
TIKR Takeaway
Forecasting EPS isn’t about predicting the future with precision. It’s about building a structured view of the most important assumptions driving a company’s earnings trajectory and stress-testing those assumptions against what the market is currently pricing in. Analyst consensus data gives you a credible baseline. Your own analysis of revenue trends, margin structure, and business quality indicates where the baseline is most likely to be wrong.
TIKR gives you both inputs in a single platform. The Estimates tab surfaces the consensus view with full historical context, and the Valuation Model Hub lets you build your own scenario directly on top of that data. Whether you’re validating an existing thesis or building a new one from scratch, the combination of analyst estimates and a flexible modeling tool makes the forecasting process significantly more efficient than assembling the same inputs from multiple sources.
Value Any Stock in Under 60 Seconds with TIKR
With TIKR’s new Valuation Model tool, you can estimate a stock’s potential share price in under a minute.
All it takes is three simple inputs:
- Revenue Growth
- Operating Margins
- Exit P/E Multiple
If you’re not sure what to enter, TIKR automatically fills in each input using analysts’ consensus estimates, giving you a quick, reliable starting point.
From there, TIKR calculates the potential share price and total returns under Bull, Base, and Bear scenarios so you can quickly see whether a stock looks undervalued or overvalued.
See a stock’s true value in under 60 seconds (Free with TIKR) >>>
Looking for New Opportunities?
- Discover which stocks billionaire investors are purchasing, so you can follow the smart money.
- Analyze stocks in as little as 5 minutes with TIKR’s all-in-one, easy-to-use platform.
- The more rocks you overturn… the more opportunities you’ll uncover. Search 100K+ global stocks, global top investor holdings, and more with TIKR.
Disclaimer:
Please note that the articles on TIKR are not intended to serve as investment or financial advice from TIKR or our content team, nor are they recommendations to buy or sell any stocks. We create our content based on TIKR Terminal’s investment data and analysts’ estimates. Our analysis might not include recent company news or important updates. TIKR has no position in any stocks mentioned. Thank you for reading, and happy investing!


