

Every stock price is, at its core, a statement about the future. The market is constantly making predictions about how much a business will earn, how fast it will grow, and how durable that growth will be. When you buy a stock, you’re either agreeing with that prediction or making a different one. Valuation is the process of figuring out which side of that bet you’re actually on.
There are two broad ways investors approach valuation. The first is intrinsic value, where you build a model that projects future cash flows and discounts them to their present value. The second is relative valuation, where you compare a company’s multiples to its own history, its peers, or the broader market to assess whether the price looks reasonable. Both approaches have real merit, and the most useful analyses tend to combine them rather than relying on either one exclusively.
This article focuses on relative valuation using multiples, which is where most practical stock analysis begins. It’s faster, more intuitive, and easier to stress-test than a full discounted cash flow model. Done well, it gives you a clear framework for understanding what a stock is priced to do, where the market might be wrong, and what assumptions you’d need to make to justify the current price.
Valuation isn’t about finding the exact right number. It’s about understanding what the market is pricing in and deciding whether you agree with it.
Find out what a stock’s really worth in under 60 seconds with TIKR’s new Valuation Model (It’s free)>>>
What Valuation Multiples Actually Measure
A valuation multiple expresses the relationship between a company’s price and a measure of its financial performance, such as earnings, revenue, cash flow, or book value. The most familiar is the P/E ratio, which divides the stock price by earnings per share. Others include EV/EBITDA, Price/Sales, and Price/Free Cash Flow.

What each multiple is really capturing is how much investors are willing to pay for each unit of financial output. A company trading at 30x earnings is priced at $30 for every $1 of annual profit. Whether that’s expensive or cheap depends entirely on what those earnings are expected to do over time, which is why growth assumptions are inseparable from multiple analyses.
A high multiple isn’t automatically expensive, and a low multiple isn’t automatically cheap. A business growing earnings at 30% annually deserves a higher multiple than one growing at 5%, because the future earnings stream is larger and arrives sooner. The discipline is in connecting the multiple to a credible growth assumption and deciding whether the implied expectations are realistic.
Access valution multiples of over 100,000 global stocks with TIKR >>>
Trailing vs. Forward Multiples
Trailing multiples are calculated using the last twelve months of actual reported results. Forward multiples use analyst estimates for the next twelve months. Both are useful, and knowing which one you’re looking at matters.

Trailing multiples are grounded in reported numbers, making them reliable but backward-looking. For a fast-growing business, trailing earnings can significantly understate the current earnings run rate, making the trailing P/E look stretched even when the forward multiple is reasonable.
Forward multiples require you to trust the accuracy of analyst estimates, which introduces uncertainty. But for growth companies where the earnings trajectory is the whole story, the forward multiple is almost always the more relevant number. When investors say a stock looks cheap or expensive, they’re usually referring to forward multiples, so that’s the number worth anchoring your analysis around.
Review forward and trailing multiples on any stock in less than 60 seconds with TIKR (It’s free) >>>
How to Compare a Stock to Its Peers
One of the most practical applications of multiple-based valuation is comparing a company to its closest peers. If every company in a sector trades between 15x and 25x forward earnings and your target company trades at 12x with similar or better growth, that gap is worth investigating. It could mean the stock is genuinely undervalued, or the market sees a risk not reflected in the headline numbers.
Peer comparisons work best when the companies being compared are genuinely similar in terms of growth rate, margin profile, and business model. Comparing a high-growth SaaS company to a mature software business on a P/E basis produces a misleading result, because the market is rightly paying more for the faster grower. The most useful peer groups are tight and deliberate, not just whatever the index classifies as the same sector.
The other dimension worth tracking is a company’s own historical multiple range. If a stock has traded between 20x and 30x forward earnings over the past five years and is currently at 18x with improving fundamentals, that compression might represent an opportunity. If it’s at 35x with decelerating growth, the historical range is sending a warning.
Connecting Multiples to Growth Assumptions
The most useful valuation exercise isn’t just looking at the current multiple. It’s working backward to determine what growth rate the current price implies and deciding whether that’s actually achievable.
A simple way to do this is the PEG ratio, which divides P/E by the expected earnings growth rate. A company at 30x earnings growing at 30% annually has a PEG of 1.0, which many investors use as a rough benchmark for fair value. A company growing at 10% with a 30x multiple has a PEG of 3.0, implying the market is pricing in either a reacceleration of growth or a belief that the current earnings base is understated.
A more rigorous approach builds out a basic earnings model: take today’s earnings, apply a growth assumption for three to five years, apply a terminal multiple, and discount that future value back to its present value in today’s dollars. This doesn’t need to be a complex spreadsheet. Even a rough version forces you to make your assumptions explicit and stress-test what happens if growth comes in below expectations.
How to Use TIKR for Multiple-Based Valuation
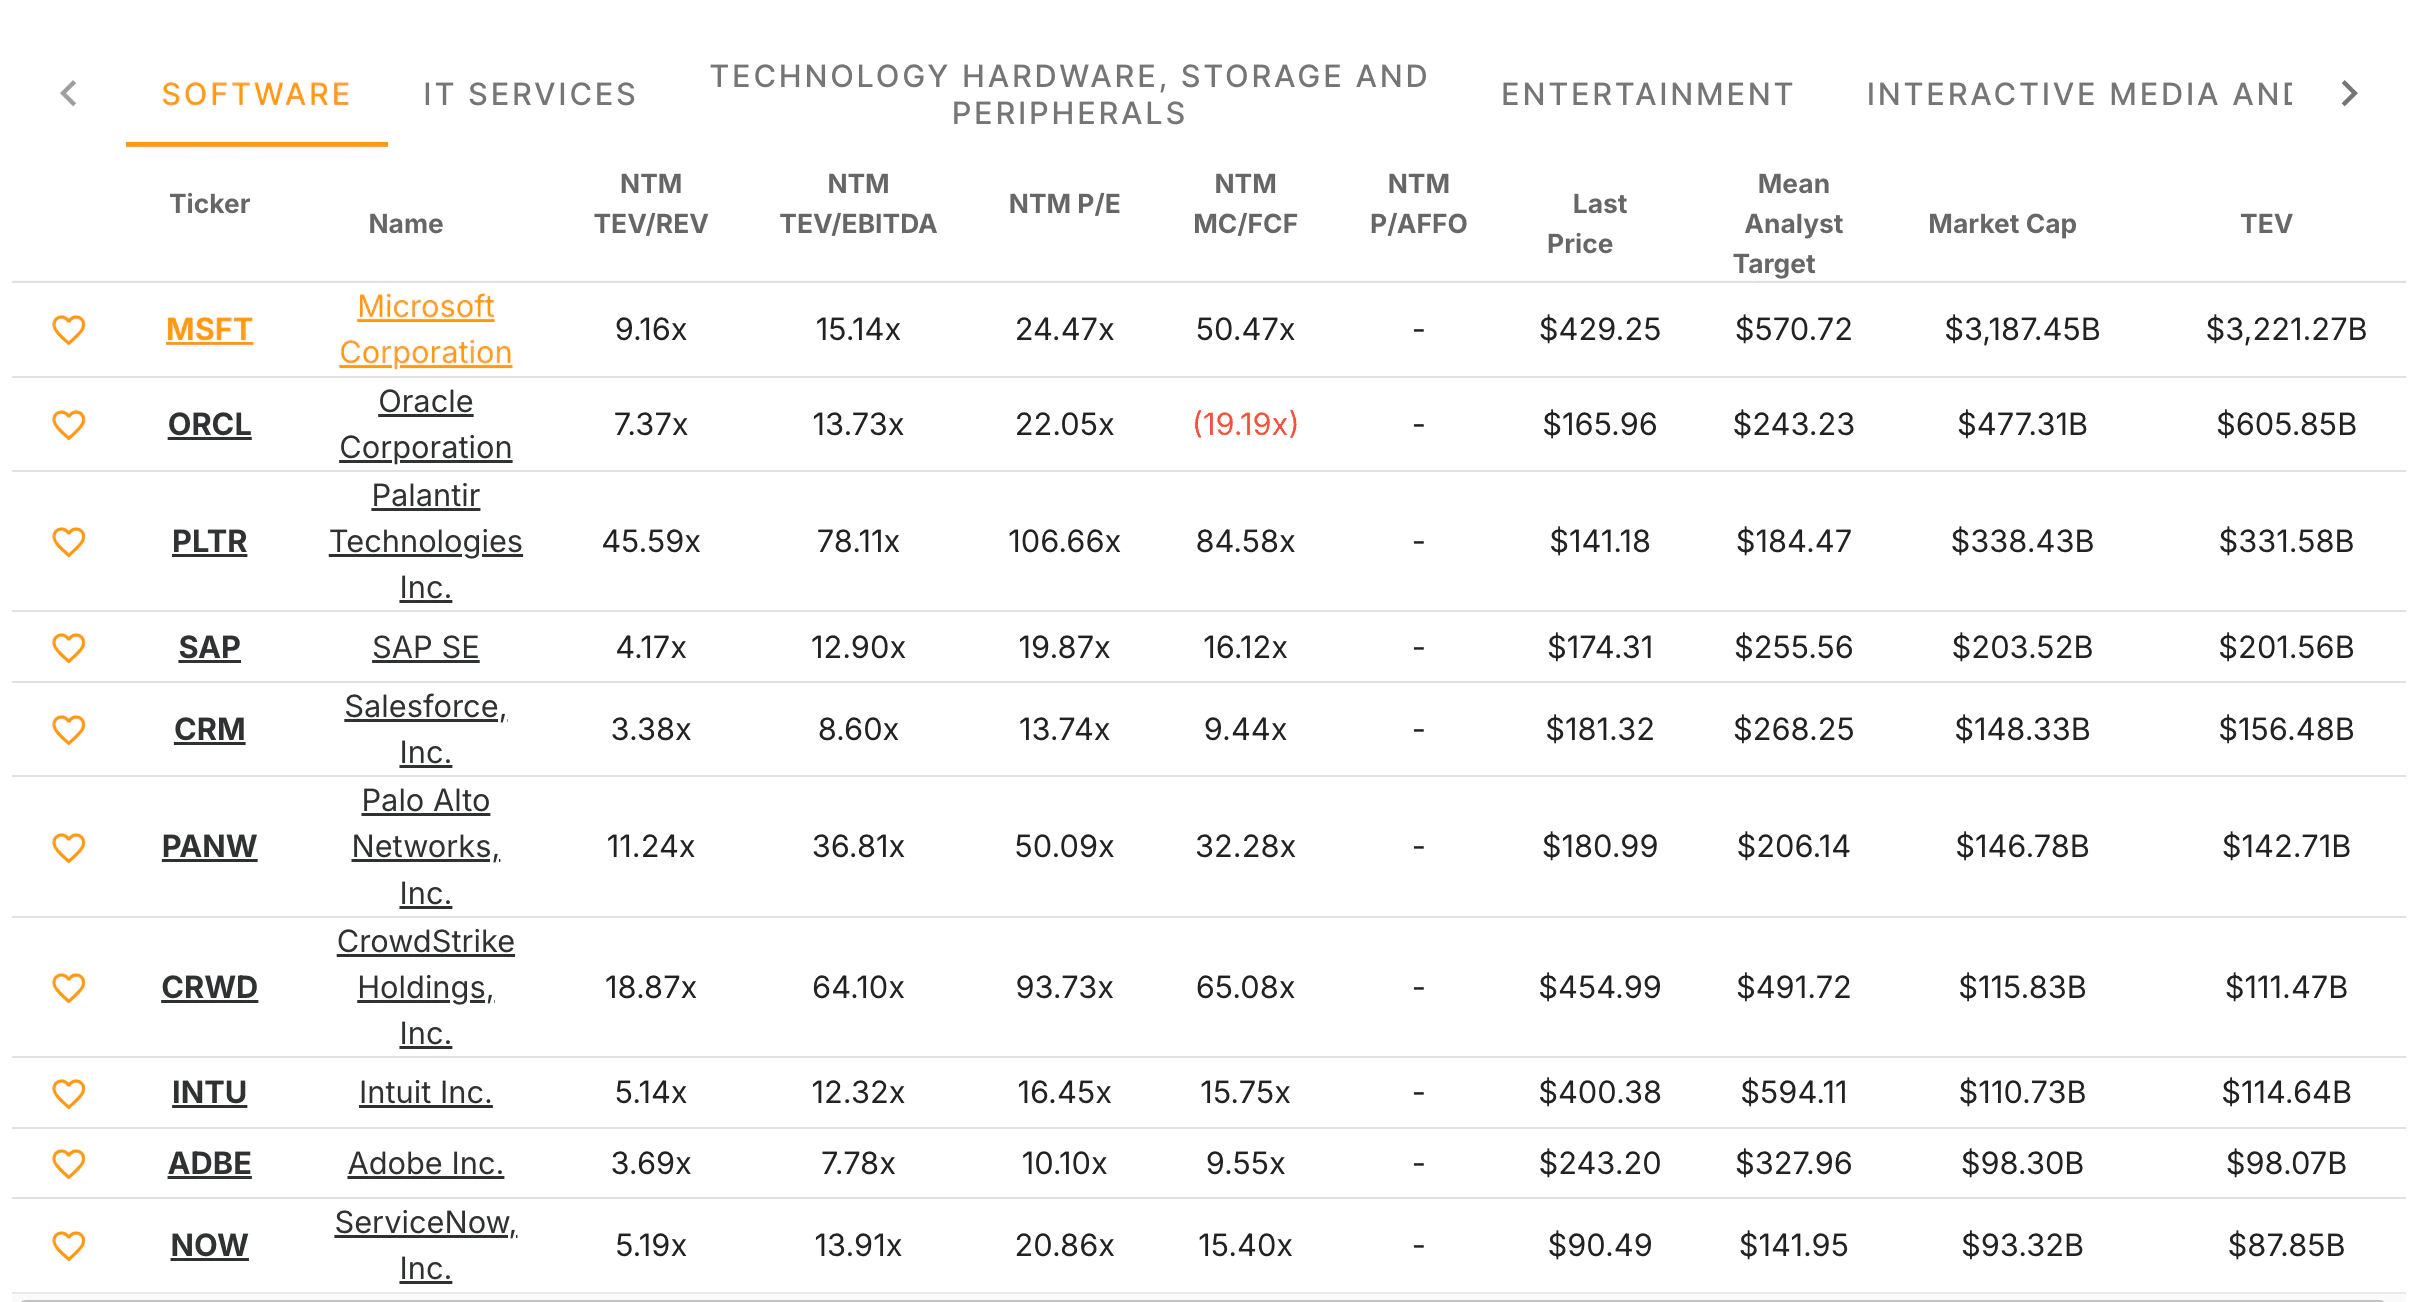
TIKR’s Valuation tab is built around exactly this kind of analysis. The Multiples section shows trailing and forward multiples over several years, so you can see where the current valuation sits relative to the company’s history at a glance. Click into any multiple to generate a chart showing how it has moved over time, which immediately reveals whether today’s price represents a compression or expansion relative to historical norms.
The Competitors section within the Valuation tab puts comparable company analysis directly alongside the company you’re researching. Peer multiples, growth rates, and margin profiles are laid out in a single table, making it straightforward to assess whether a premium or discount to the group is justified. Combine that with the Estimates tab to pull forward revenue and earnings projections, and you have everything needed to connect the current multiple to a credible growth assumption without switching between platforms.
Find the best high-margin, high-quality stocks to buy today with TIKR >>>
TIKR Takeaway
Valuing a stock with multiples isn’t about precision. It’s about building a clear framework for what the market expects and whether those expectations are reasonable given the underlying business. Trailing and forward multiples, peer comparisons, and growth-adjusted ratios like PEG all give you different angles on the same question, and using them together produces a more complete picture than any single metric can on its own.

TIKR’s Valuation tab puts all of that analysis in one place. Historical multiples, forward estimates, peer comparisons, and analyst price targets are organized to help you move fluidly from a high-level valuation check to a detailed fundamental review without losing continuity. For investors who want to evaluate whether a stock’s price makes sense relative to its growth and margin trajectory, it’s one of the more efficient workflows the platform offers.
Value Any Stock in Under 60 Seconds with TIKR
With TIKR’s new Valuation Model tool, you can estimate a stock’s potential share price in under a minute.
All it takes is three simple inputs:
- Revenue Growth
- Operating Margins
- Exit P/E Multiple
If you’re not sure what to enter, TIKR automatically fills in each input using analysts’ consensus estimates, giving you a quick, reliable starting point.
From there, TIKR calculates the potential share price and total returns under Bull, Base, and Bear scenarios so you can quickly see whether a stock looks undervalued or overvalued.
See a stock’s true value in under 60 seconds (Free with TIKR) >>>
Looking for New Opportunities?
- Discover which stocks billionaire investors are purchasing, so you can follow the smart money.
- Analyze stocks in as little as 5 minutes with TIKR’s all-in-one, easy-to-use platform.
- The more rocks you overturn… the more opportunities you’ll uncover. Search 100K+ global stocks, global top investor holdings, and more with TIKR.
Disclaimer:
Please note that the articles on TIKR are not intended to serve as investment or financial advice from TIKR or our content team, nor are they recommendations to buy or sell any stocks. We create our content based on TIKR Terminal’s investment data and analysts’ estimates. Our analysis might not include recent company news or important updates. TIKR has no position in any stocks mentioned. Thank you for reading, and happy investing!


