
A valuation multiple like a P/E ratio or EV/EBITDA is essentially a shortcut, but without the right context, that shortcut can lead you straight into a value trap. A stock trading at 15x earnings might look like a bargain until you realize its entire peer group is trading at 8x. To truly understand what a company is worth, you have to stop looking at it in isolation and start mapping it against the “neighborhood” it lives in.
Historically, building a proper peer comparison was a manual nightmare. It required hunting down individual filings, standardizing disparate accounting methods, and building massive spreadsheets just to determine whether a company was overvalued relative to its growth. Fortunately, professional-grade tools now allow you to automate this “relative valuation” process, letting you build custom peer groups and visualize how multiples shift alongside growth rates in real-time.
The following tools transform valuation from a guessing game into a disciplined benchmarking exercise. By using these platforms to track a company’s position relative to its industry and historical percentile ranks, you can identify mispricings in the market. These are the best free resources for mastering the art of the peer comparison.
1. TIKR
TIKR is widely considered the gold standard for peer analysis because it bridges the gap between simple historical data and professional-grade forecasting. While most tools limit you to domestic stocks and trailing data, TIKR covers over 100,000 global companies and provides 15+ years of standardized financial history. This depth allows you to see how a company’s valuation multiple has behaved across multiple market cycles and how it stacks up against international competitors.
What makes TIKR the premium choice is its ability to map valuation multiples against growth rates. Its platform allows you to build custom peer groups and instantly compare forward-looking estimates for P/E, EV/EBITDA, and Free Cash Flow yield. This ensures you aren’t just looking at where a company has been, but where the professional analyst community expects it to go, allowing you to see if a “high” multiple is actually justified by superior future growth.
Best Features:
- Superior Peer Comparison: Build custom lists of competitors and see side-by-side valuation benchmarks across the global market.
- Forward-Looking Multiples: Access multi-year analyst projections to see how the market is pricing a company’s future earnings rather than just its past.
- 15+ Years of History: Audit a stock’s valuation range over a decade or more to determine if its current multiple is historically high or low.
- Global Reach: Analyze valuation trends for over 100,000 stocks, including international markets often ignored by standard screeners.
Discover how much upside your favorite stocks could have using TIKR’s new Valuation Model (It’s free) >>>
| TIKR | Koyfin | Finviz | Seeking Alpha | GuruFocus | |
| Best For | Best For Visual Dashboards | Best For Rapid Industry Filtering | Best For Sector Average Context | Key Valuation Feature: 5-Year Historical Valuation Tables | Best ForValue-First Investing |
| Key Valuation Feature | Best For Global Peer Benchmarking | Key Valuation Feature: Forward Multiples & Growth Projections | Key Valuation Feature: Historical Percentile Ranks | Key Valuation Feature: Industry Heatmaps & Tables | Key Valuation FeatureHistorical Percentile Ranks |
2. Koyfin
Koyfin is designed for the investor who thinks in pictures. Its “dashboard” approach allows you to plot fundamental metrics such as P/E ratios and revenue growth for multiple companies on a single interactive chart. This makes it incredibly easy to see when a company’s valuation starts to decouple from its peers, providing a visual warning or opportunity long before it shows up in a static table.
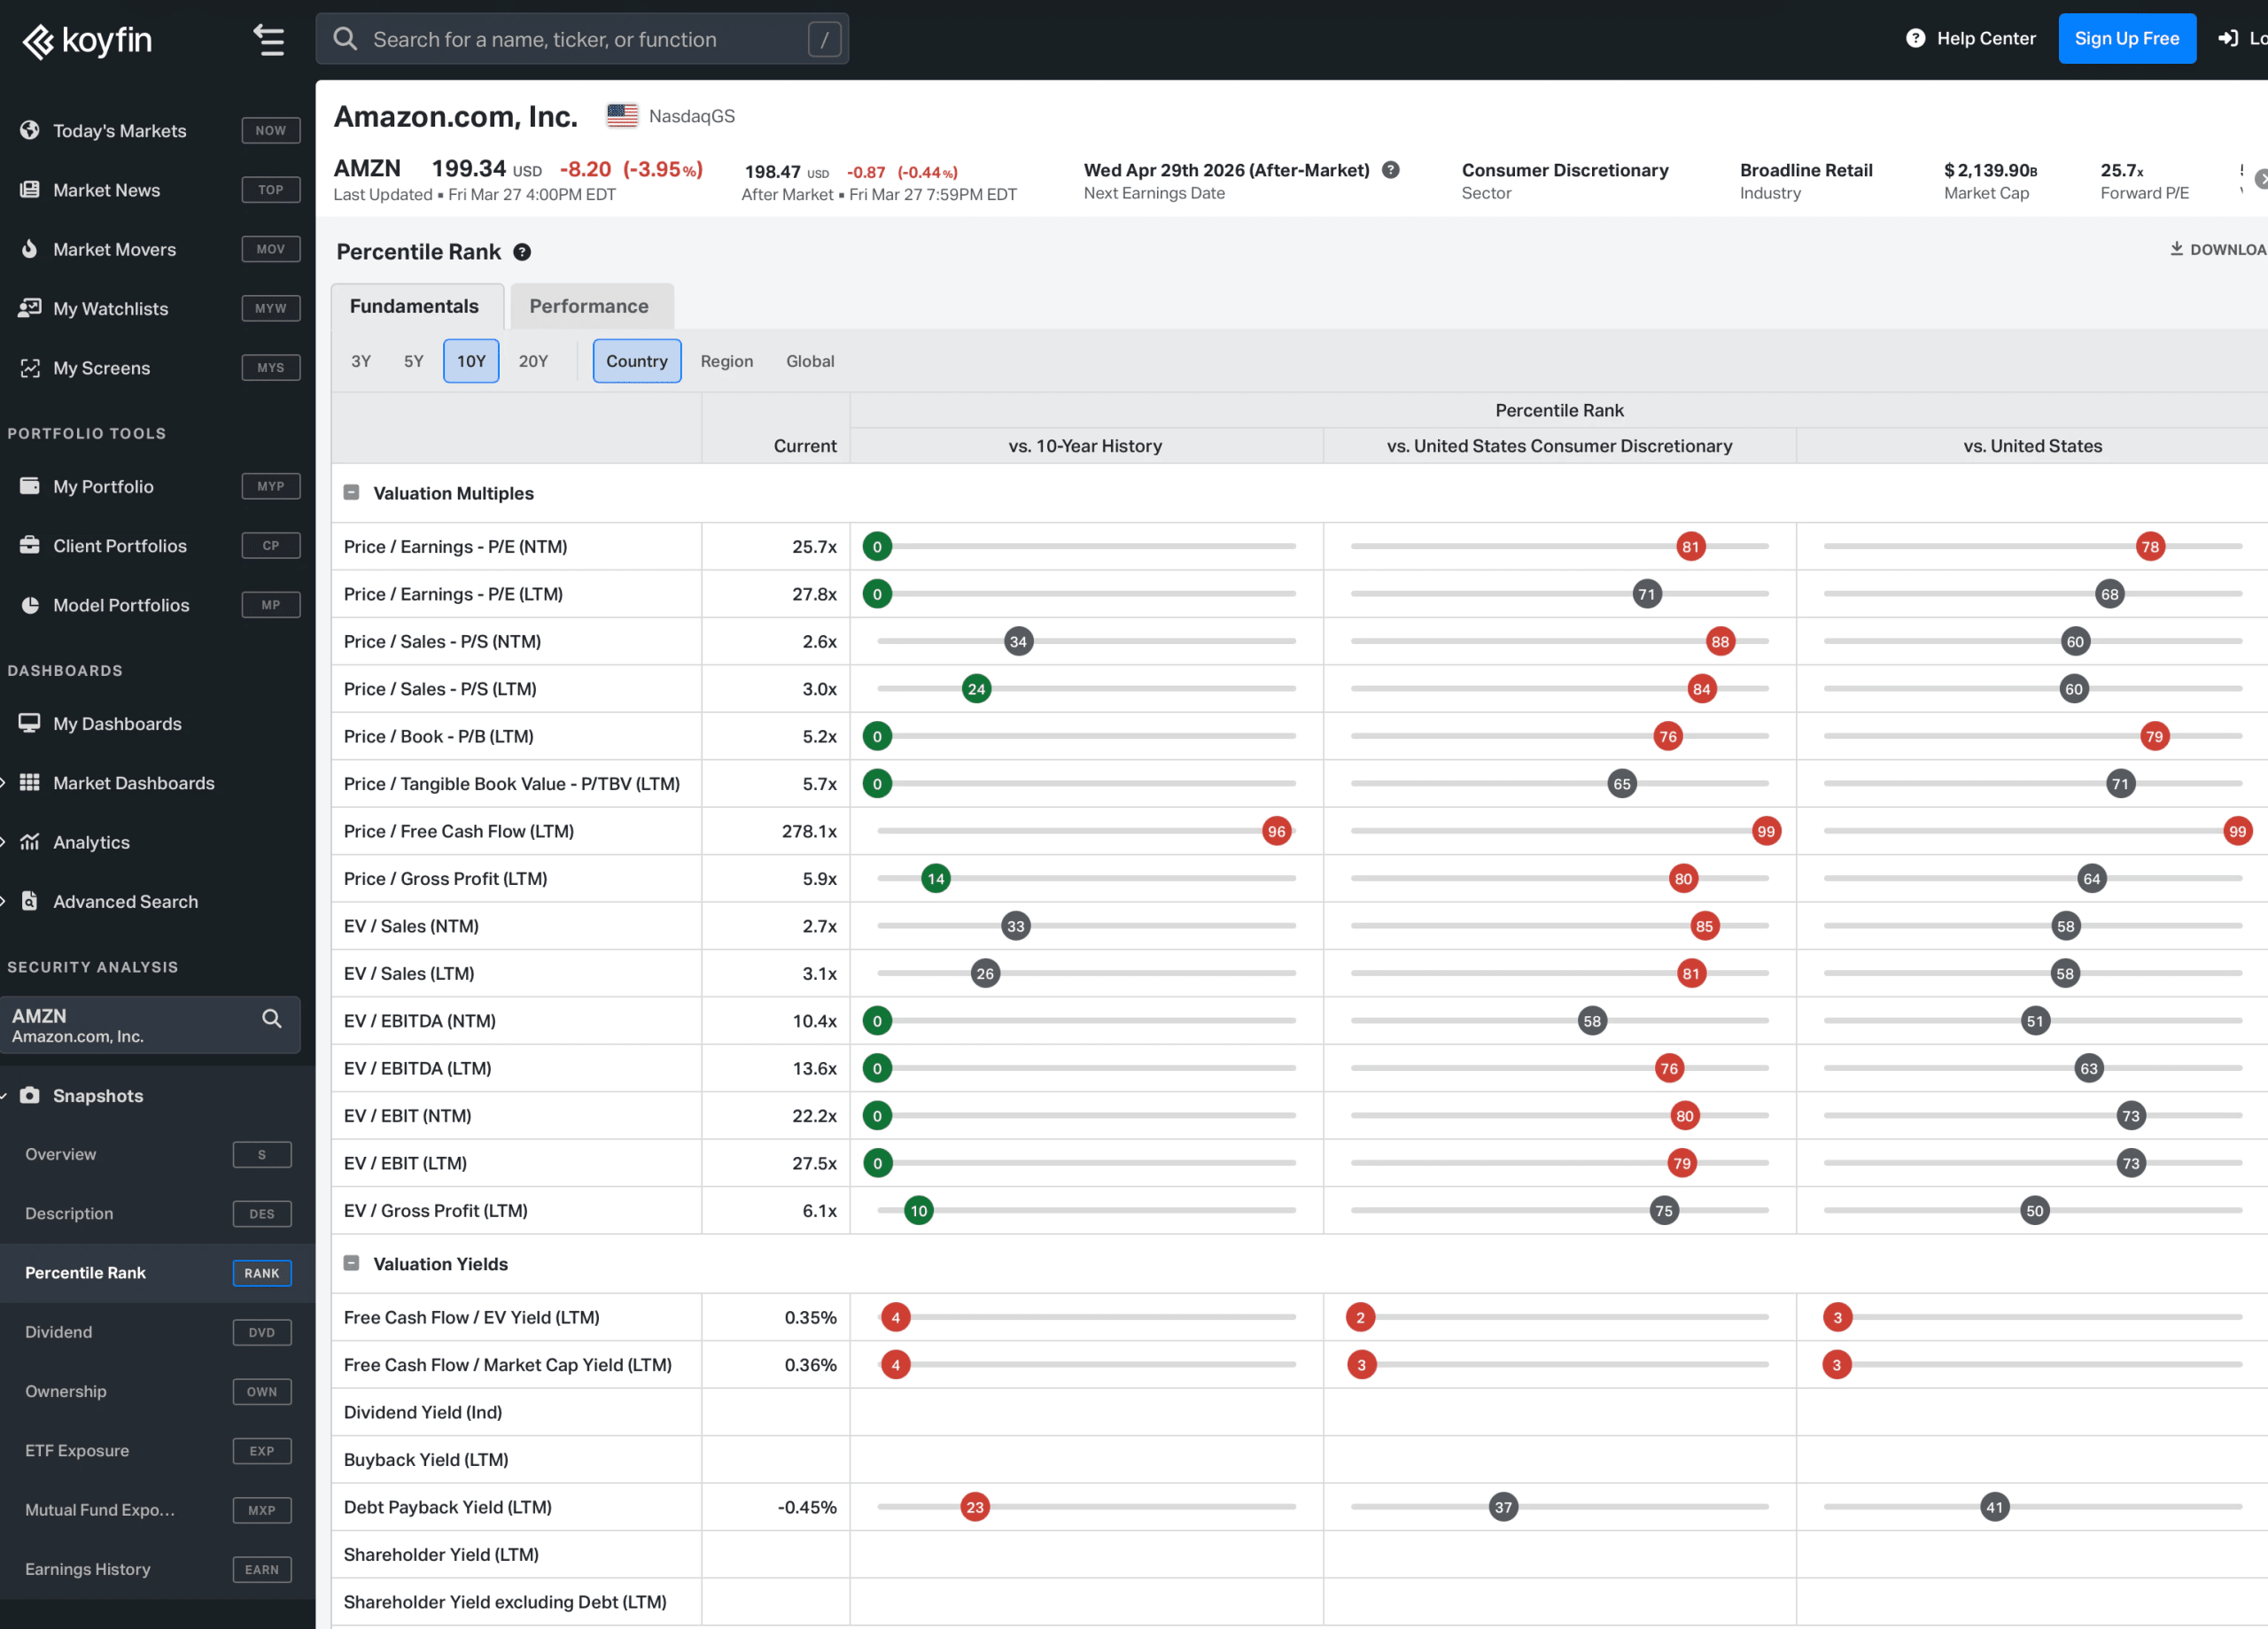
The tool also includes valuable Percentile Ranks, which show you exactly where a company’s valuation stands relative to its own 5-year or 10-year history. If a stock is trading at its 90th percentile valuation while its peers are at their 20th, Koyfin makes that red flag impossible to miss.
Best Features:
- Koyfin does this best by providing Interactive Visual Data that allows you to graph valuation trends for multiple competitors on a single, color-synced timeline.
Estimate a company’s fair value instantly (Free with TIKR) >>>
3. Finviz
Finviz is the right choice for rapid, high-level discovery. If you need to know how every stock in the semiconductor industry is trading relative to their earnings in under ten seconds, Finviz is the tool. Its screener allows you to filter the entire market by specific valuation multiples, such as Price-to-Book or Forward P/E.

The platform’s Heatmaps are a standout feature for peer analysis, allowing you to visually group companies by sector and industry to see which pockets of the market are “overheated” and which are being ignored. It is the perfect tool for identifying broad valuation trends before diving into a deep-dive audit.
Best Features:
- Finviz does this best by offering Industry Heatmaps that provide a bird’s-eye view of how valuation multiples are distributed across entire sectors.
4. Seeking Alpha
Seeking Alpha is an essential resource for getting sector-level context. Its valuation tab provides a detailed breakdown of a stock’s multiples and compares them directly to its sector average. It even assigns “grades” (A through F) to these metrics, giving you an immediate sense of whether a stock is expensive or cheap relative to its immediate neighborhood.
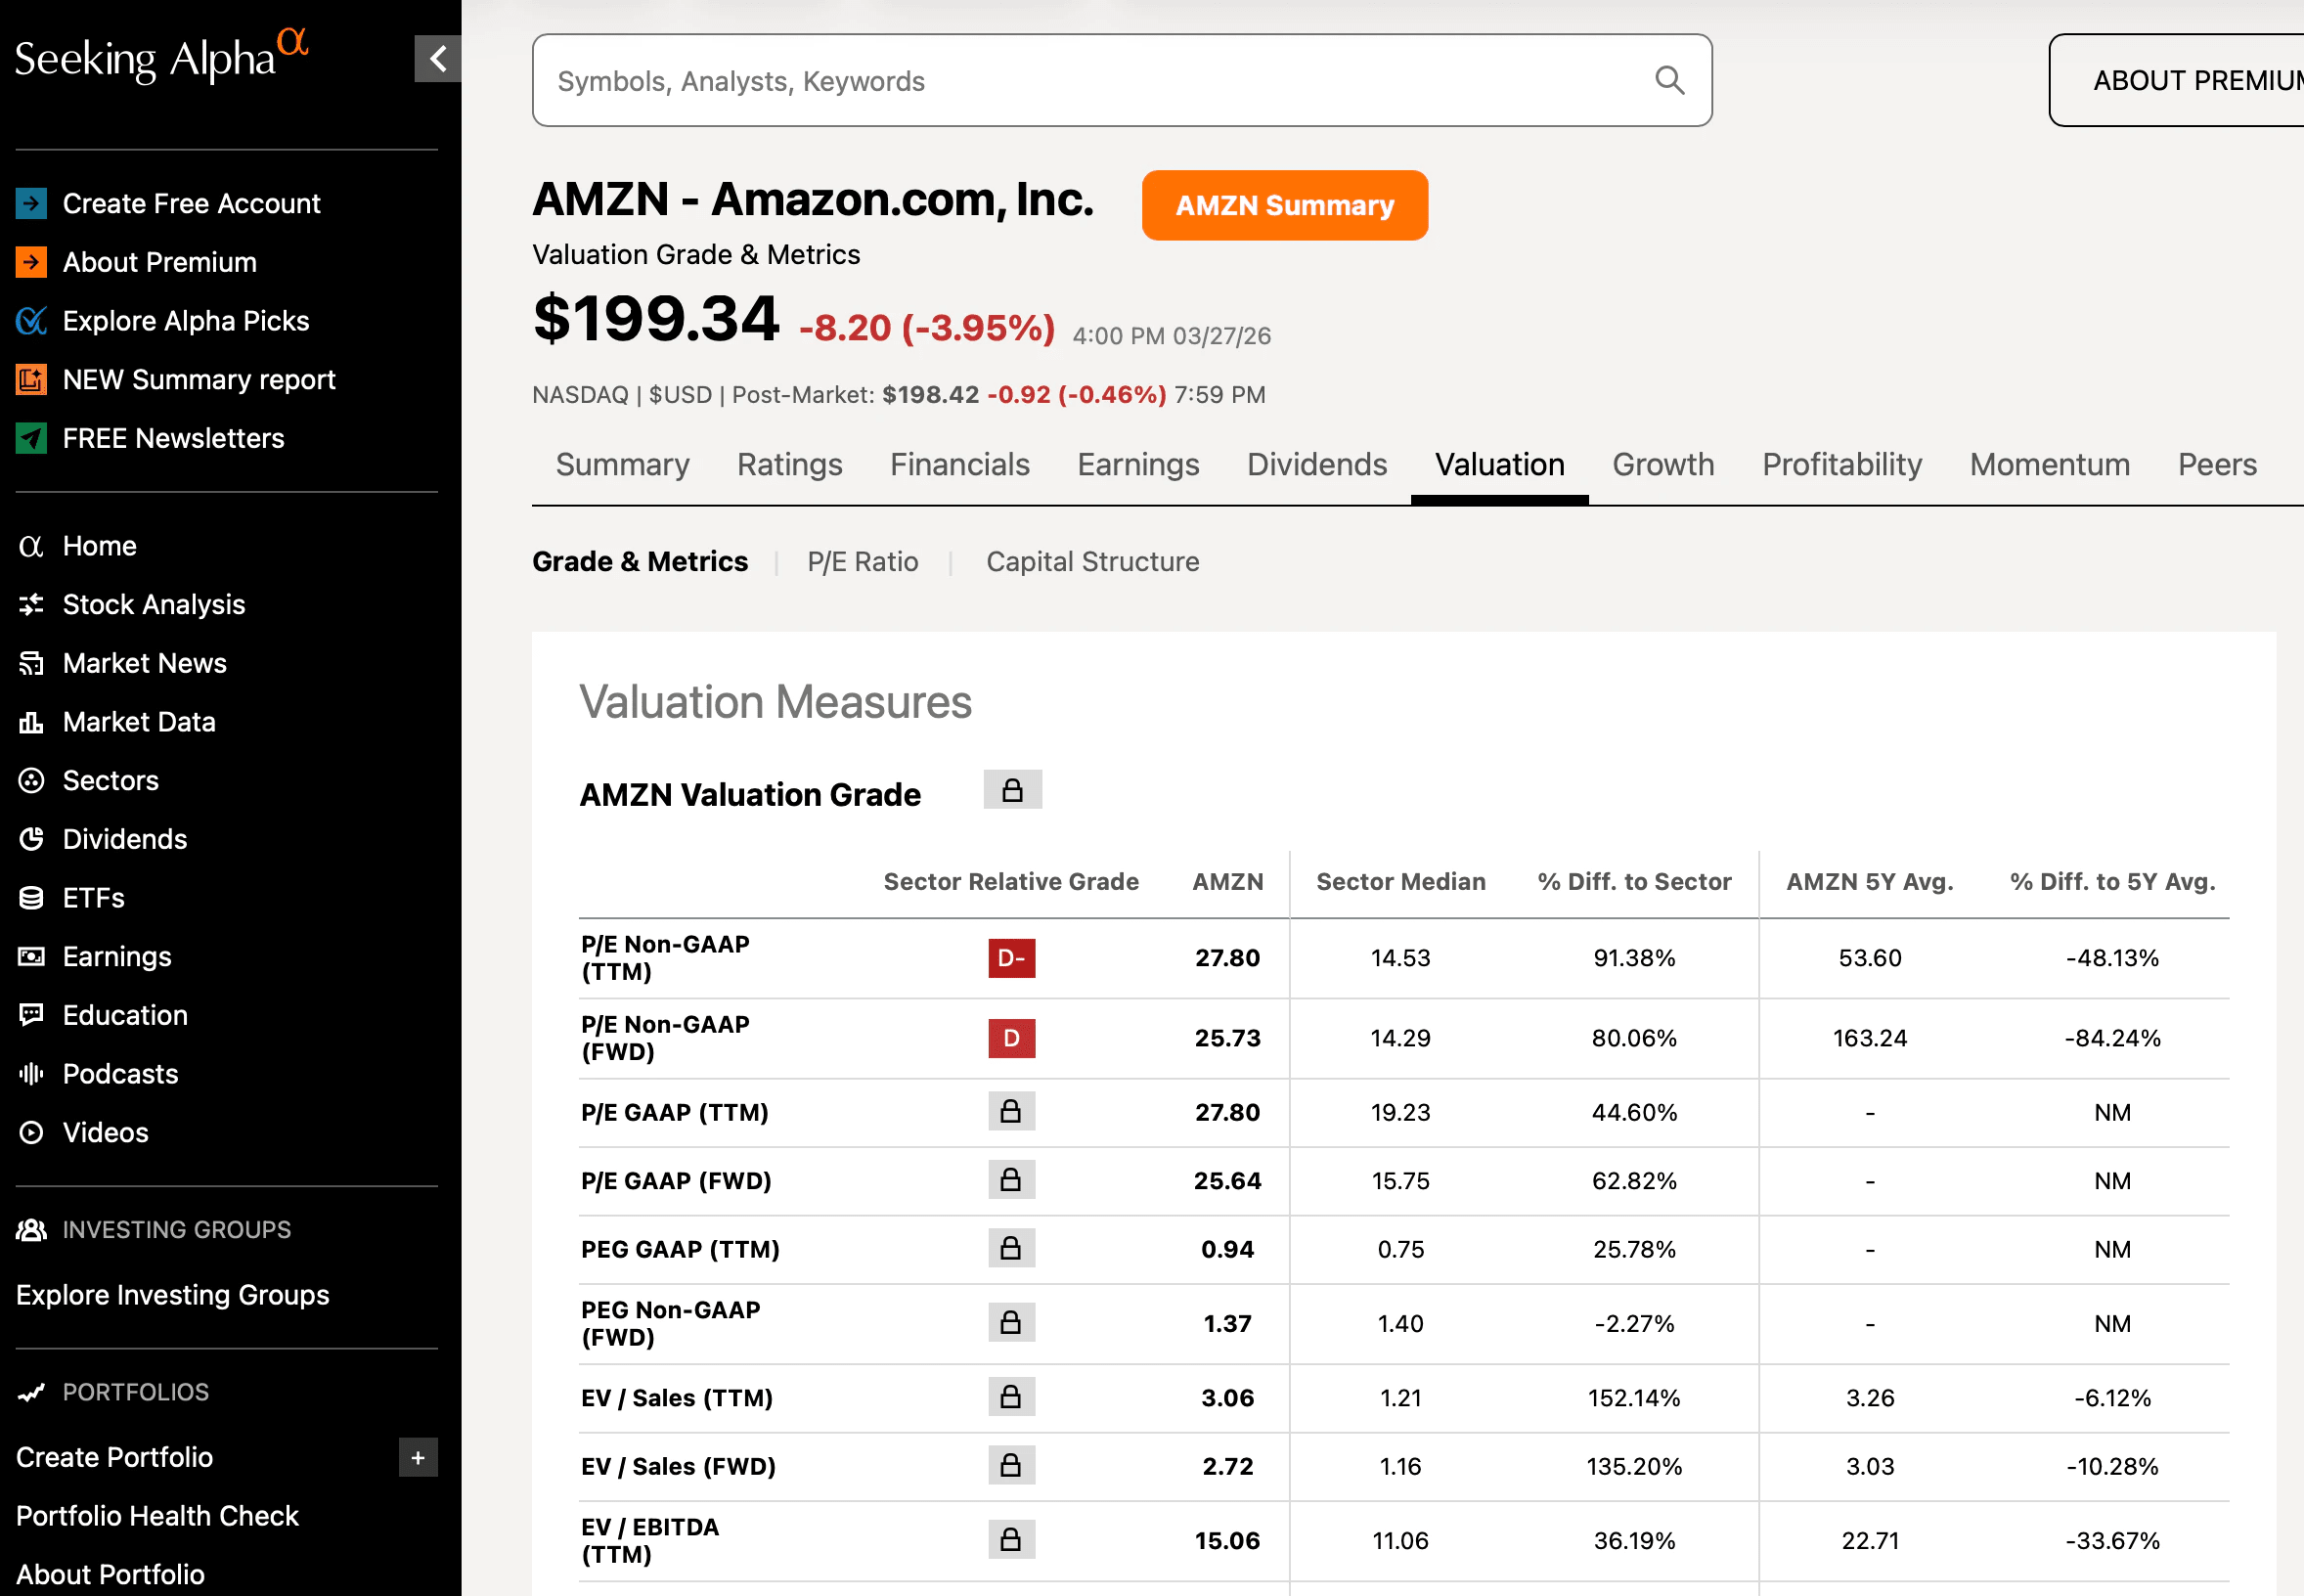
The tool provides up to five years of historical data for free, allowing you to see if a stock’s current discount to the sector is a permanent feature or a new development. It is particularly helpful for those who want a quick, “shorthand” interpretation of a stock’s relative value.
Best Features:
- Seeking Alpha does this best by providing Sector Average Comparisons that grade a stock’s valuation metrics against its direct industry peers.
5. GuruFocus
GuruFocus is built for value-first investors who want to audit a company’s financial health alongside its valuation. It provides a specialized view of a company’s valuation metrics relative to its historical ranges and sector peers, using a variety of internal scores to assess whether the business is actually “safe” for a value investment.
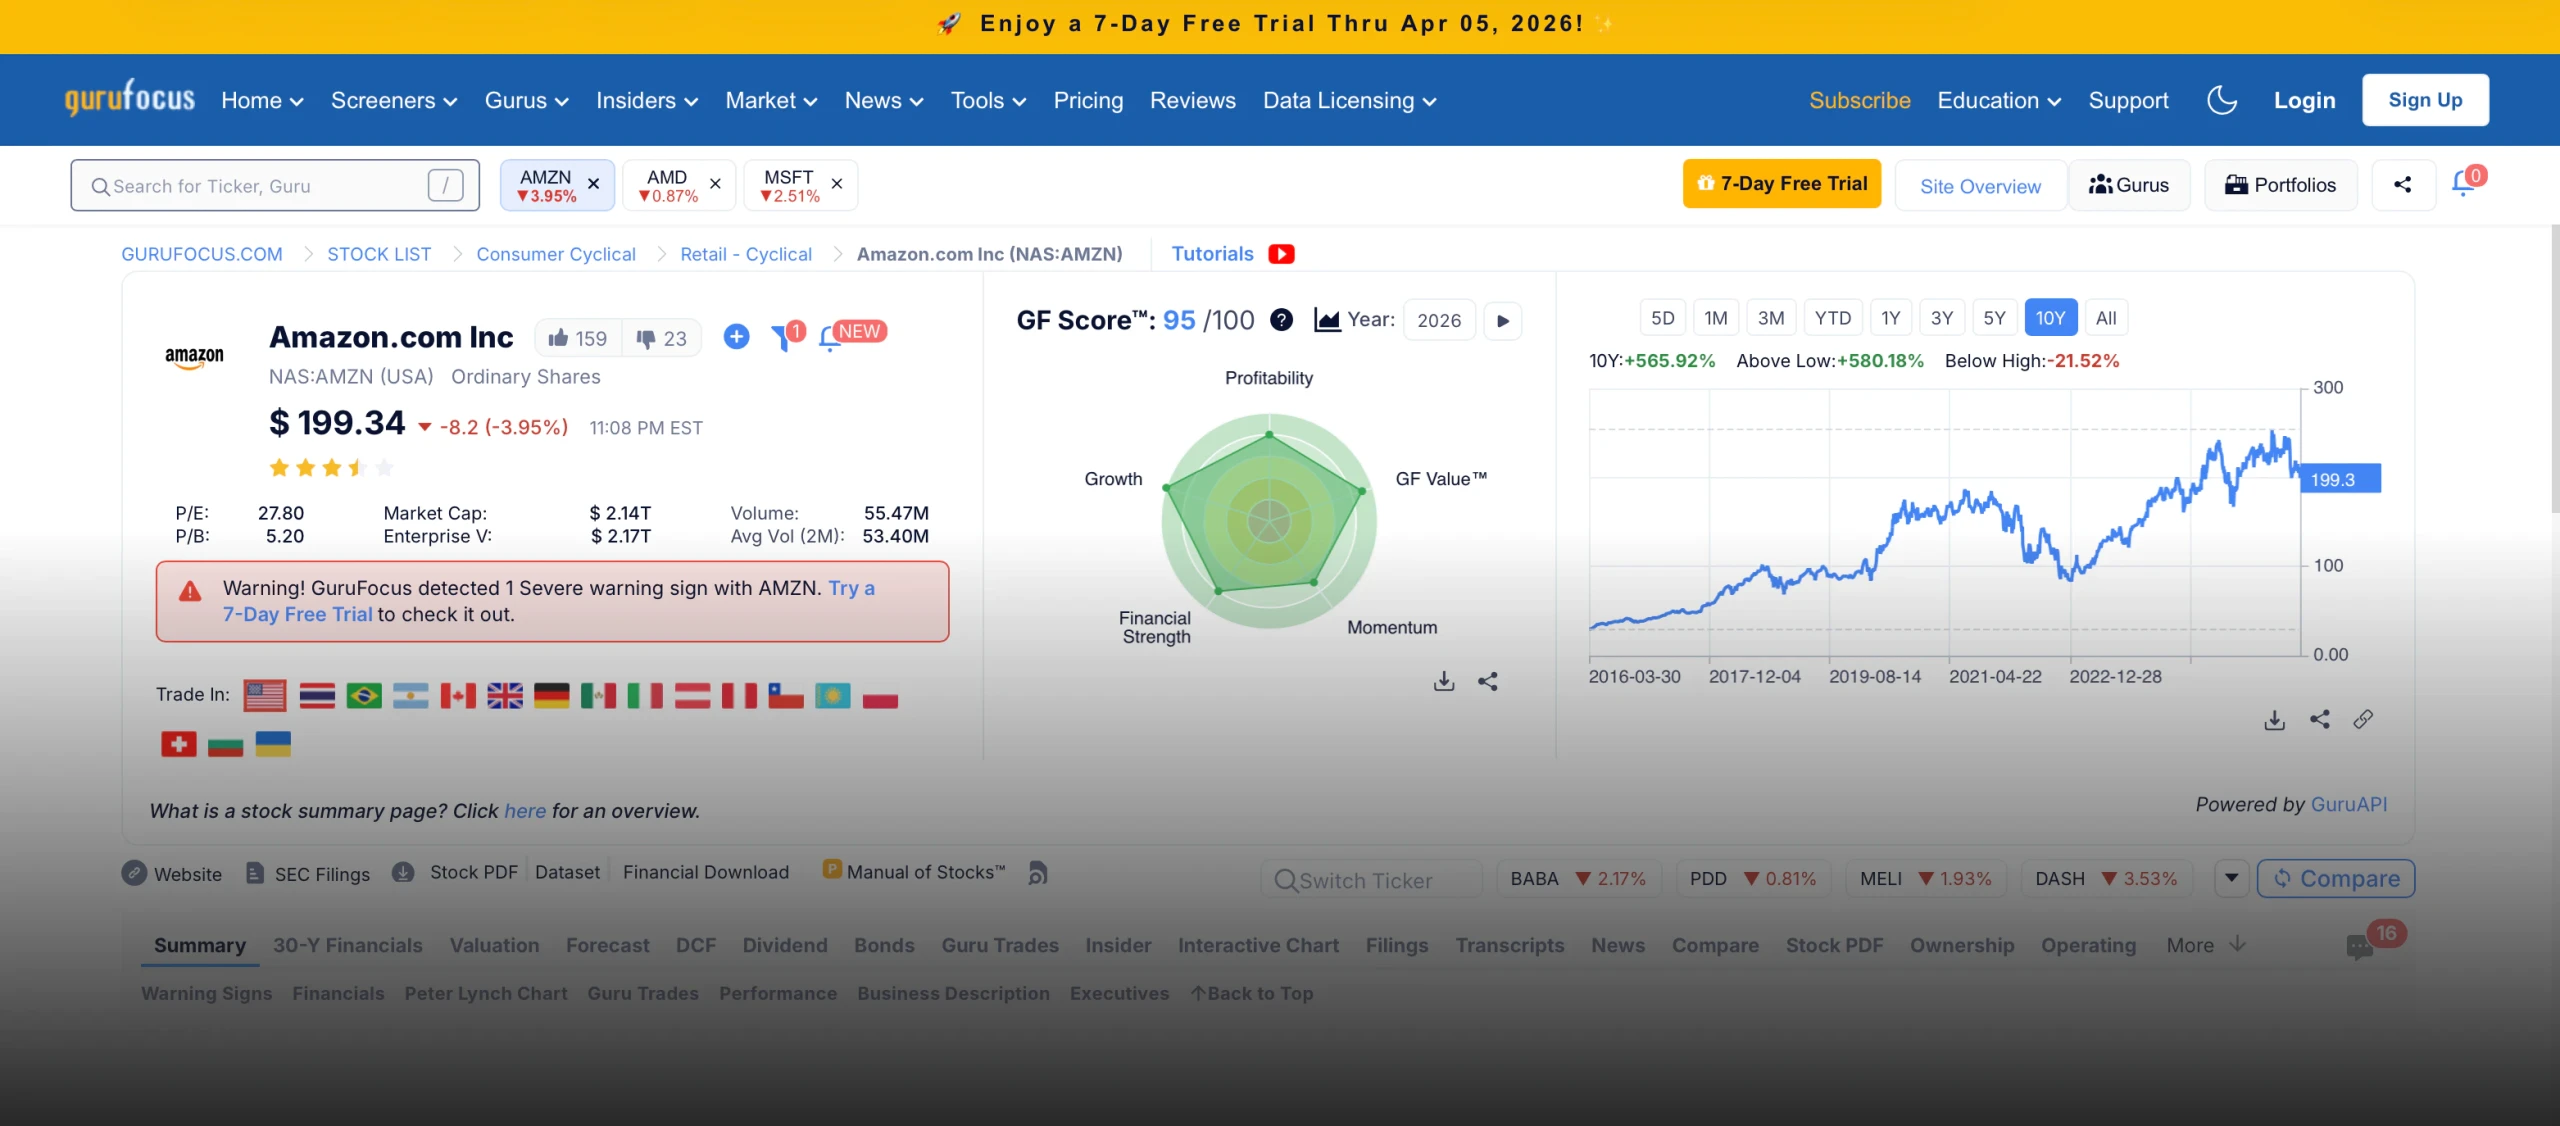
The platform is excellent at surfacing long-term valuation cycles. By showing you the median P/E or EV/EBITDA over a 10-year period, GuruFocus helps you avoid overpaying for a “great” company that is currently trading at the peak of its historical valuation range.
Best Features:
- GuruFocus does this best by providing Median Historical Valuations to help you determine if a stock is trading at a fair price relative to its long-term average.
Review dividend data for thousands of stocks in less than 60 seconds with TIKR (It’s free) >>>
TIKR Takeaway
Valuation is a relative game, and TIKR is the best tool to give you the global depth and forward-looking data to play it at a professional level. It moves you past static “trailing” multiples and into dynamic, evidence-based peer analysis.
By allowing you to build custom peer groups and overlay analyst estimates, TIKR helps you determine whether a stock’s valuation reflects a structural advantage or a looming risk. It turns the search for value from a speculative hunt into a rigorous, data-backed benchmarking process.
Value Any Stock in Under 60 Seconds with TIKR
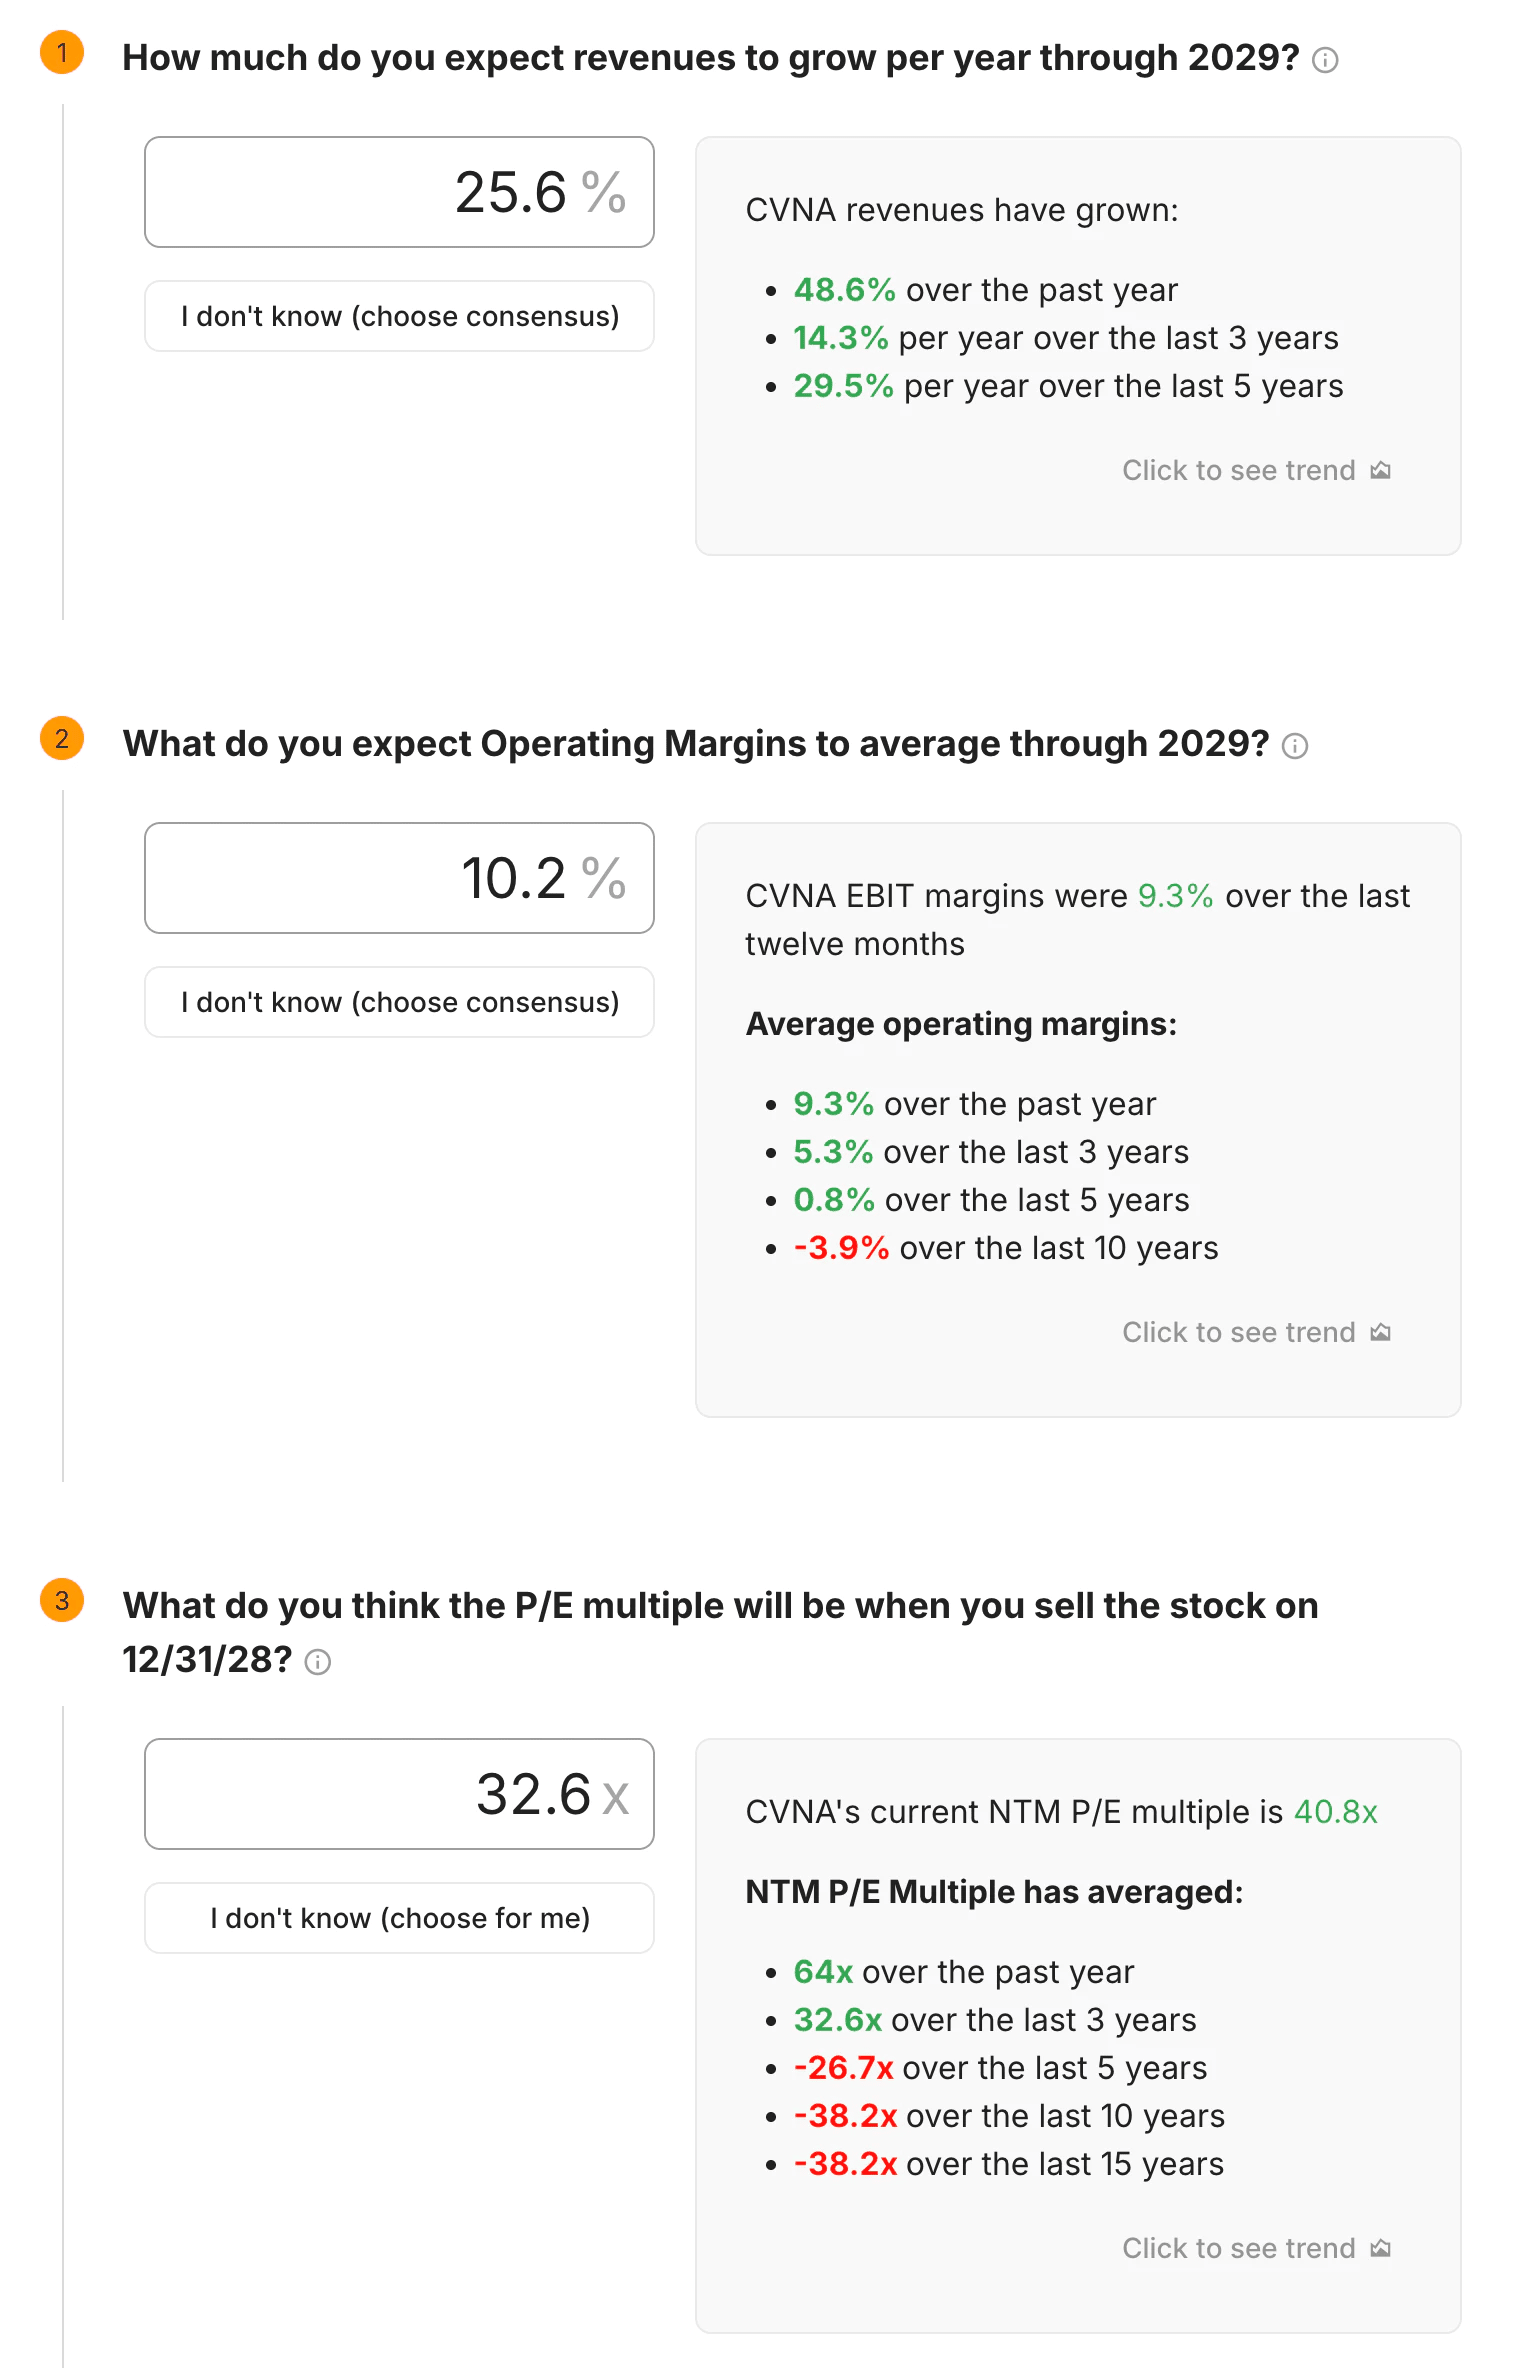
With TIKR’s new Valuation Model tool, you can estimate a stock’s potential share price in under a minute.
All it takes is three simple inputs:
- Revenue Growth
- Operating Margins
- Exit P/E Multiple
If you’re not sure what to enter, TIKR automatically fills in each input using analysts’ consensus estimates, giving you a quick, reliable starting point.
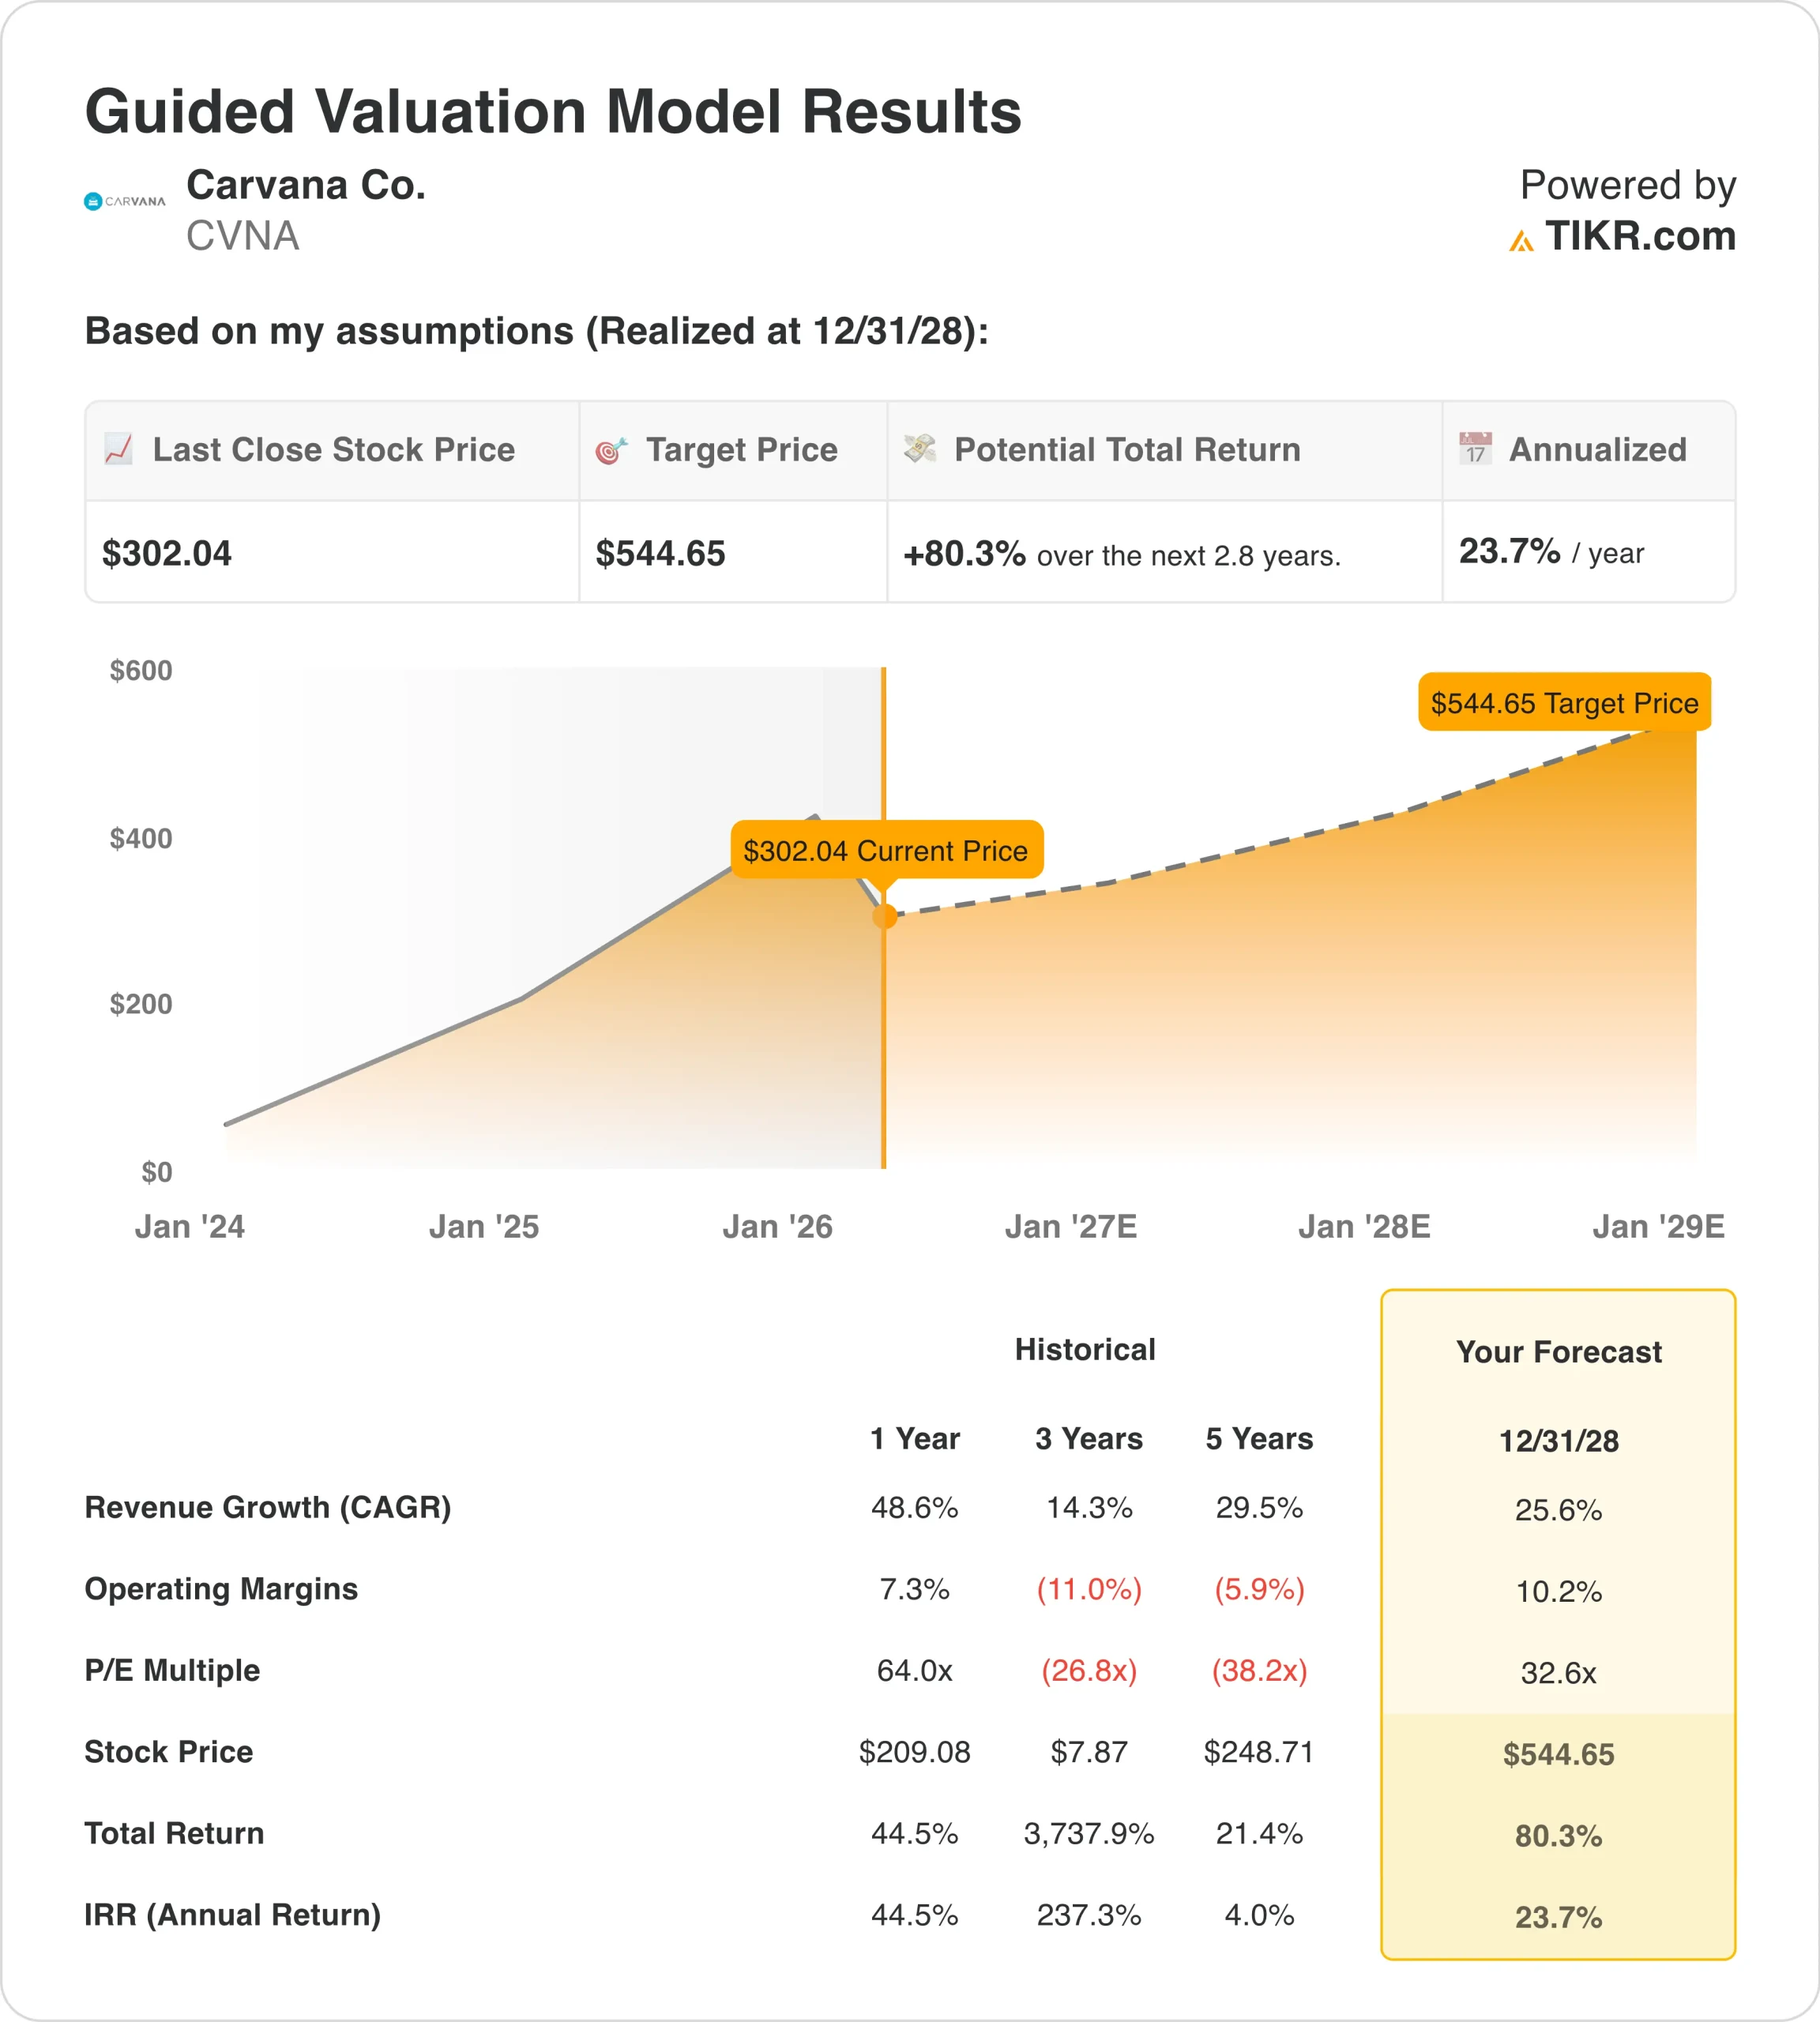
From there, TIKR calculates the potential share price and total returns under Bull, Base, and Bear scenarios so you can quickly see whether a stock looks undervalued or overvalued.
See a stock’s true value in under 60 seconds (Free with TIKR) >>>
Looking for New Opportunities?
- Discover which stocks billionaire investors are purchasing, so you can follow the smart money.
- Analyze stocks in as little as 5 minutes with TIKR’s all-in-one, easy-to-use platform.
- The more rocks you overturn… the more opportunities you’ll uncover. Search 100K+ global stocks, global top investor holdings, and more with TIKR.
Disclaimer:
Please note that the articles on TIKR are not intended to serve as investment or financial advice from TIKR or our content team, nor are they recommendations to buy or sell any stocks. We create our content based on TIKR Terminal’s investment data and analysts’ estimates. Our analysis might not include recent company news or important updates. TIKR has no position in any stocks mentioned. Thank you for reading, and happy investing!