
Unsurprisingly, revenue growth gets all the attention as it shows up in headlines, earnings previews, and analyst upgrades, and it is easy to understand why. But revenue growth without margin improvement is often just a company working harder to stay in the same place.
The businesses that actually compound over time are the ones converting a growing portion of their revenue into profit, and understanding whether a company is doing that well requires looking at costs just as carefully as sales.
The good news is that margin analysis sounds far more intimidating than it actually is. Is the company keeping more of each dollar it earns than it did last year? Are operating costs growing faster or slower than revenue? When input costs rise, can management pass them along, or do they absorb the hit?
The answers to those questions tell you more about a business’s durability than almost any other set of numbers, and they tend to show up quietly in the financials long before the market starts paying attention. The tools below make that analysis genuinely accessible without requiring a Bloomberg terminal or an accounting background.
1. TIKR
Use TIKR’s global screener to review thousands of stocks with TIKR (It’s free) >>>
TIKR is where margin analysis starts to feel like real research rather than data hunting. The Estimates tab shows you both historical actuals and forward-looking analyst forecasts for gross margin and EBITDA margin side by side, so you can see not just where margins stand today but where analysts expect them to go over the next several years. That forward view is what separates a one-time improvement from a structural trend.
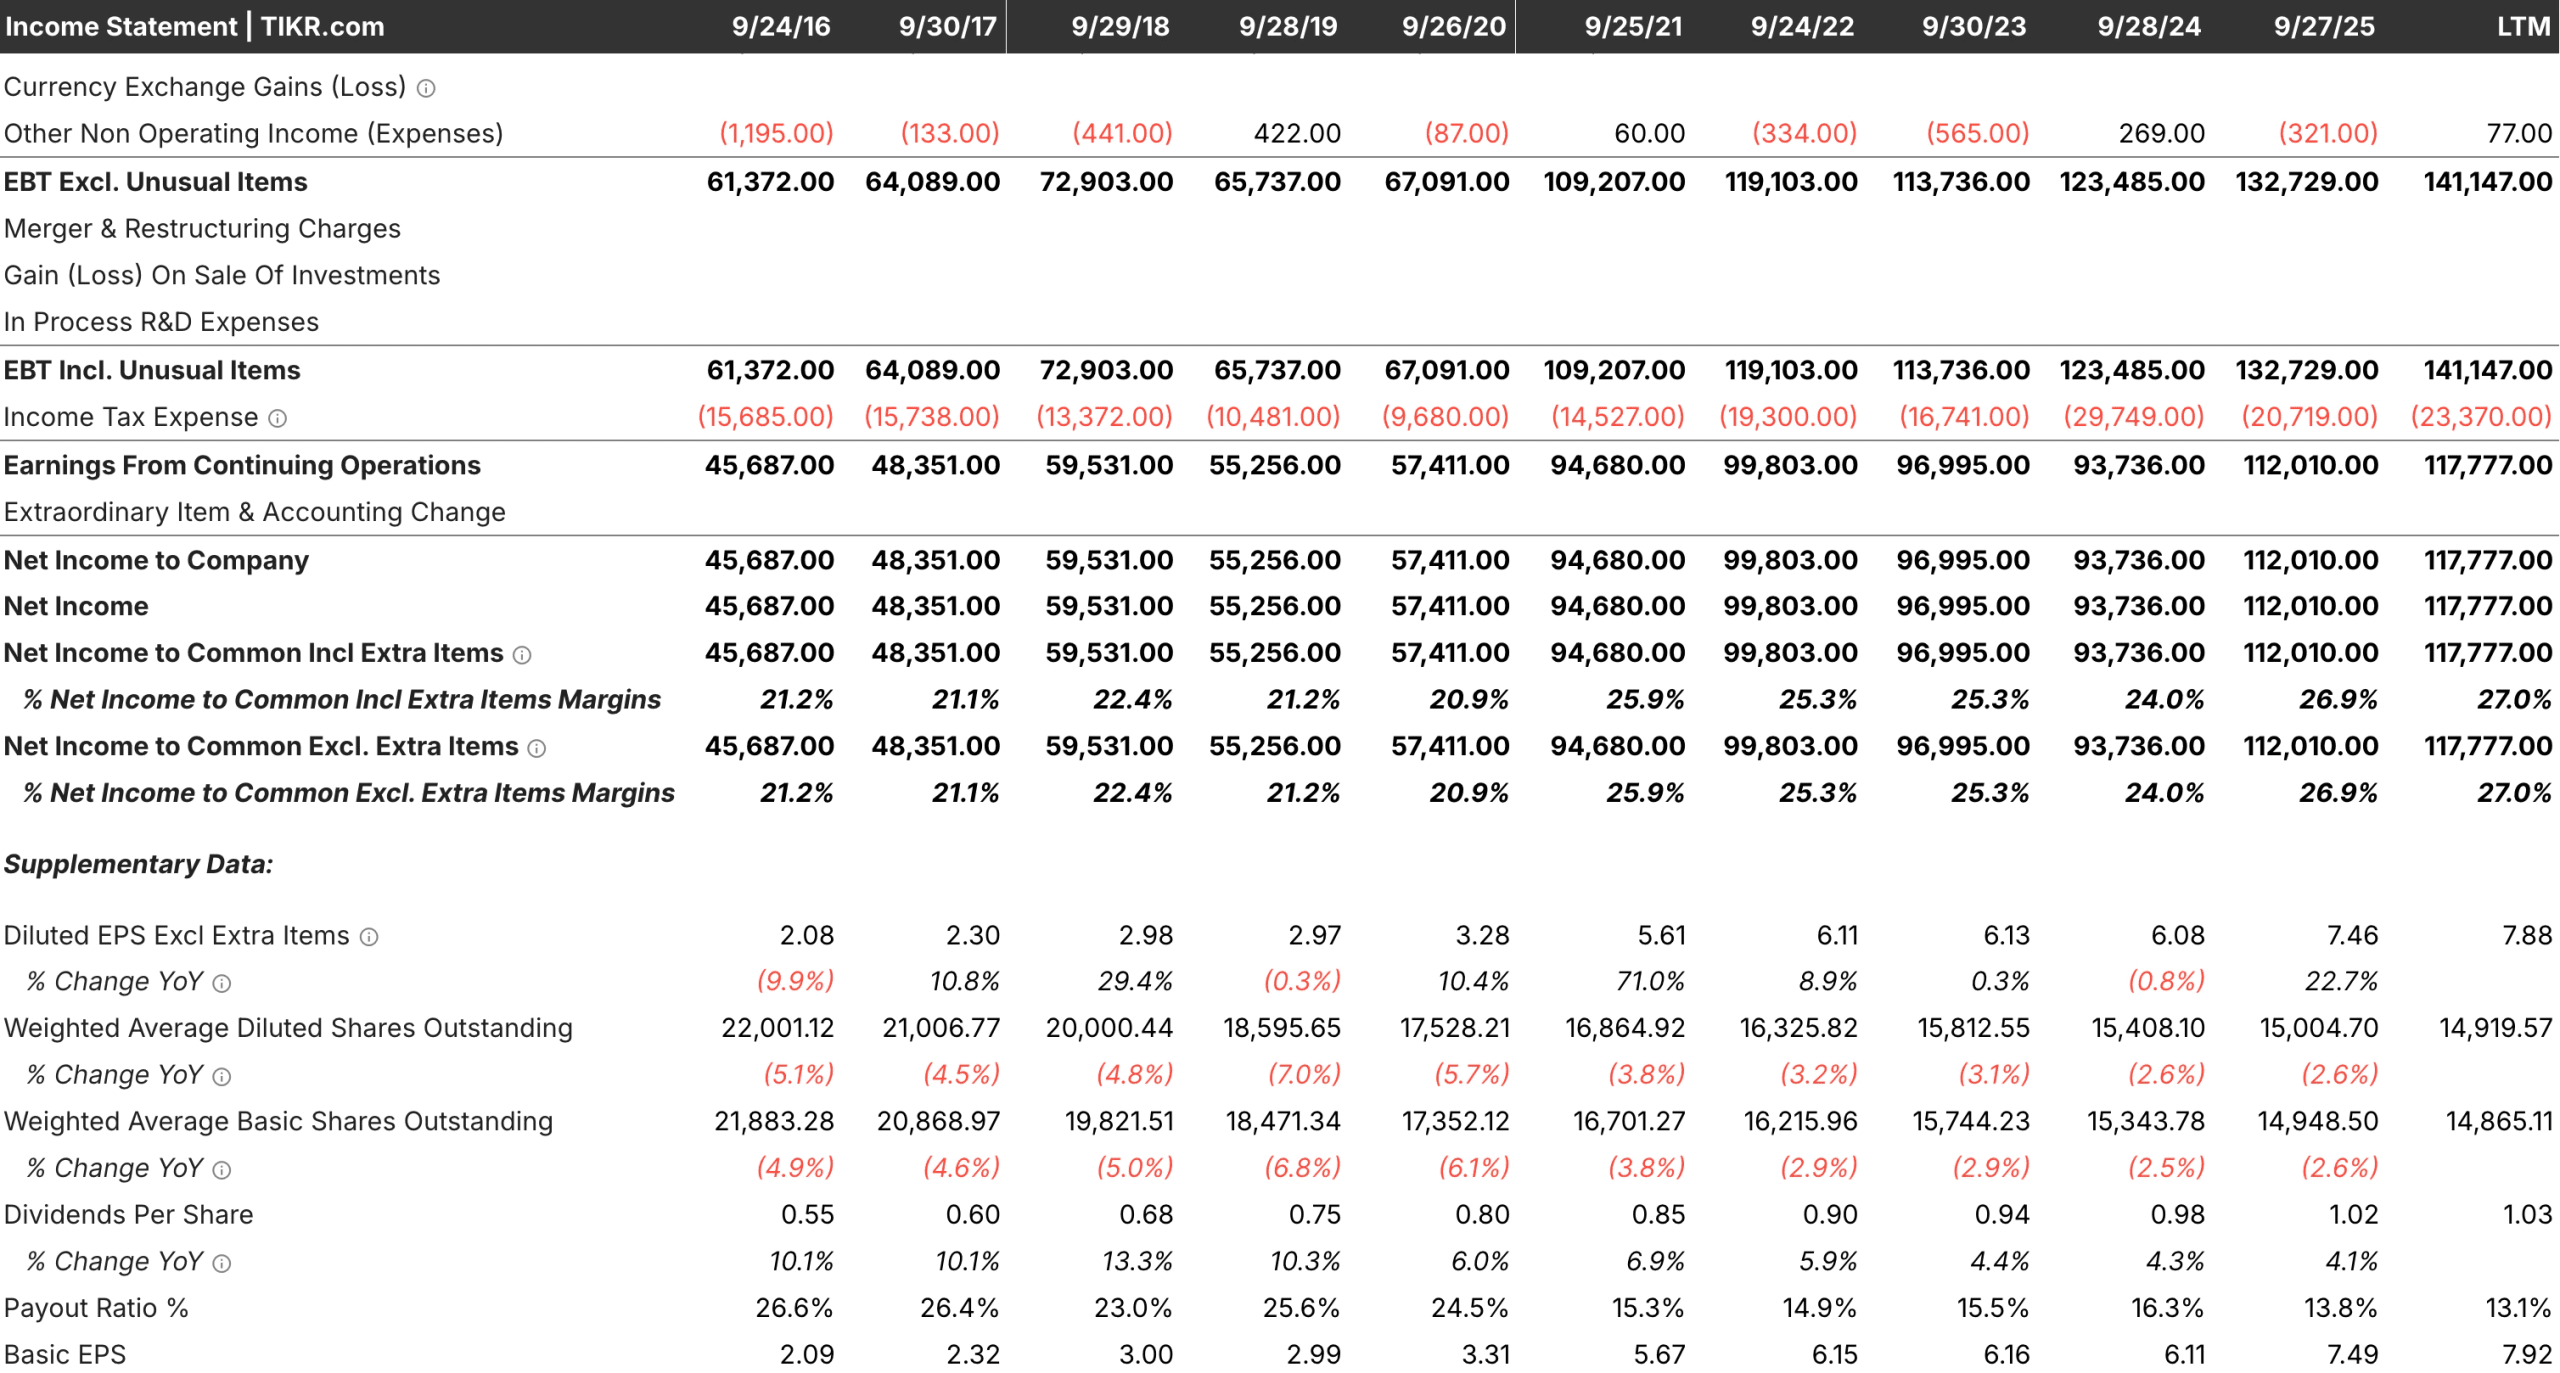
The Income Statement under Detailed Financials gives you the full cost picture. You can pull up quarterly, semiannual, or annual data, drag the timeline to any period, and click any row to instantly generate a chart. You can also add a second ticker to the same chart, which makes peer comparisons straightforward rather than something you have to piece together across multiple tabs.
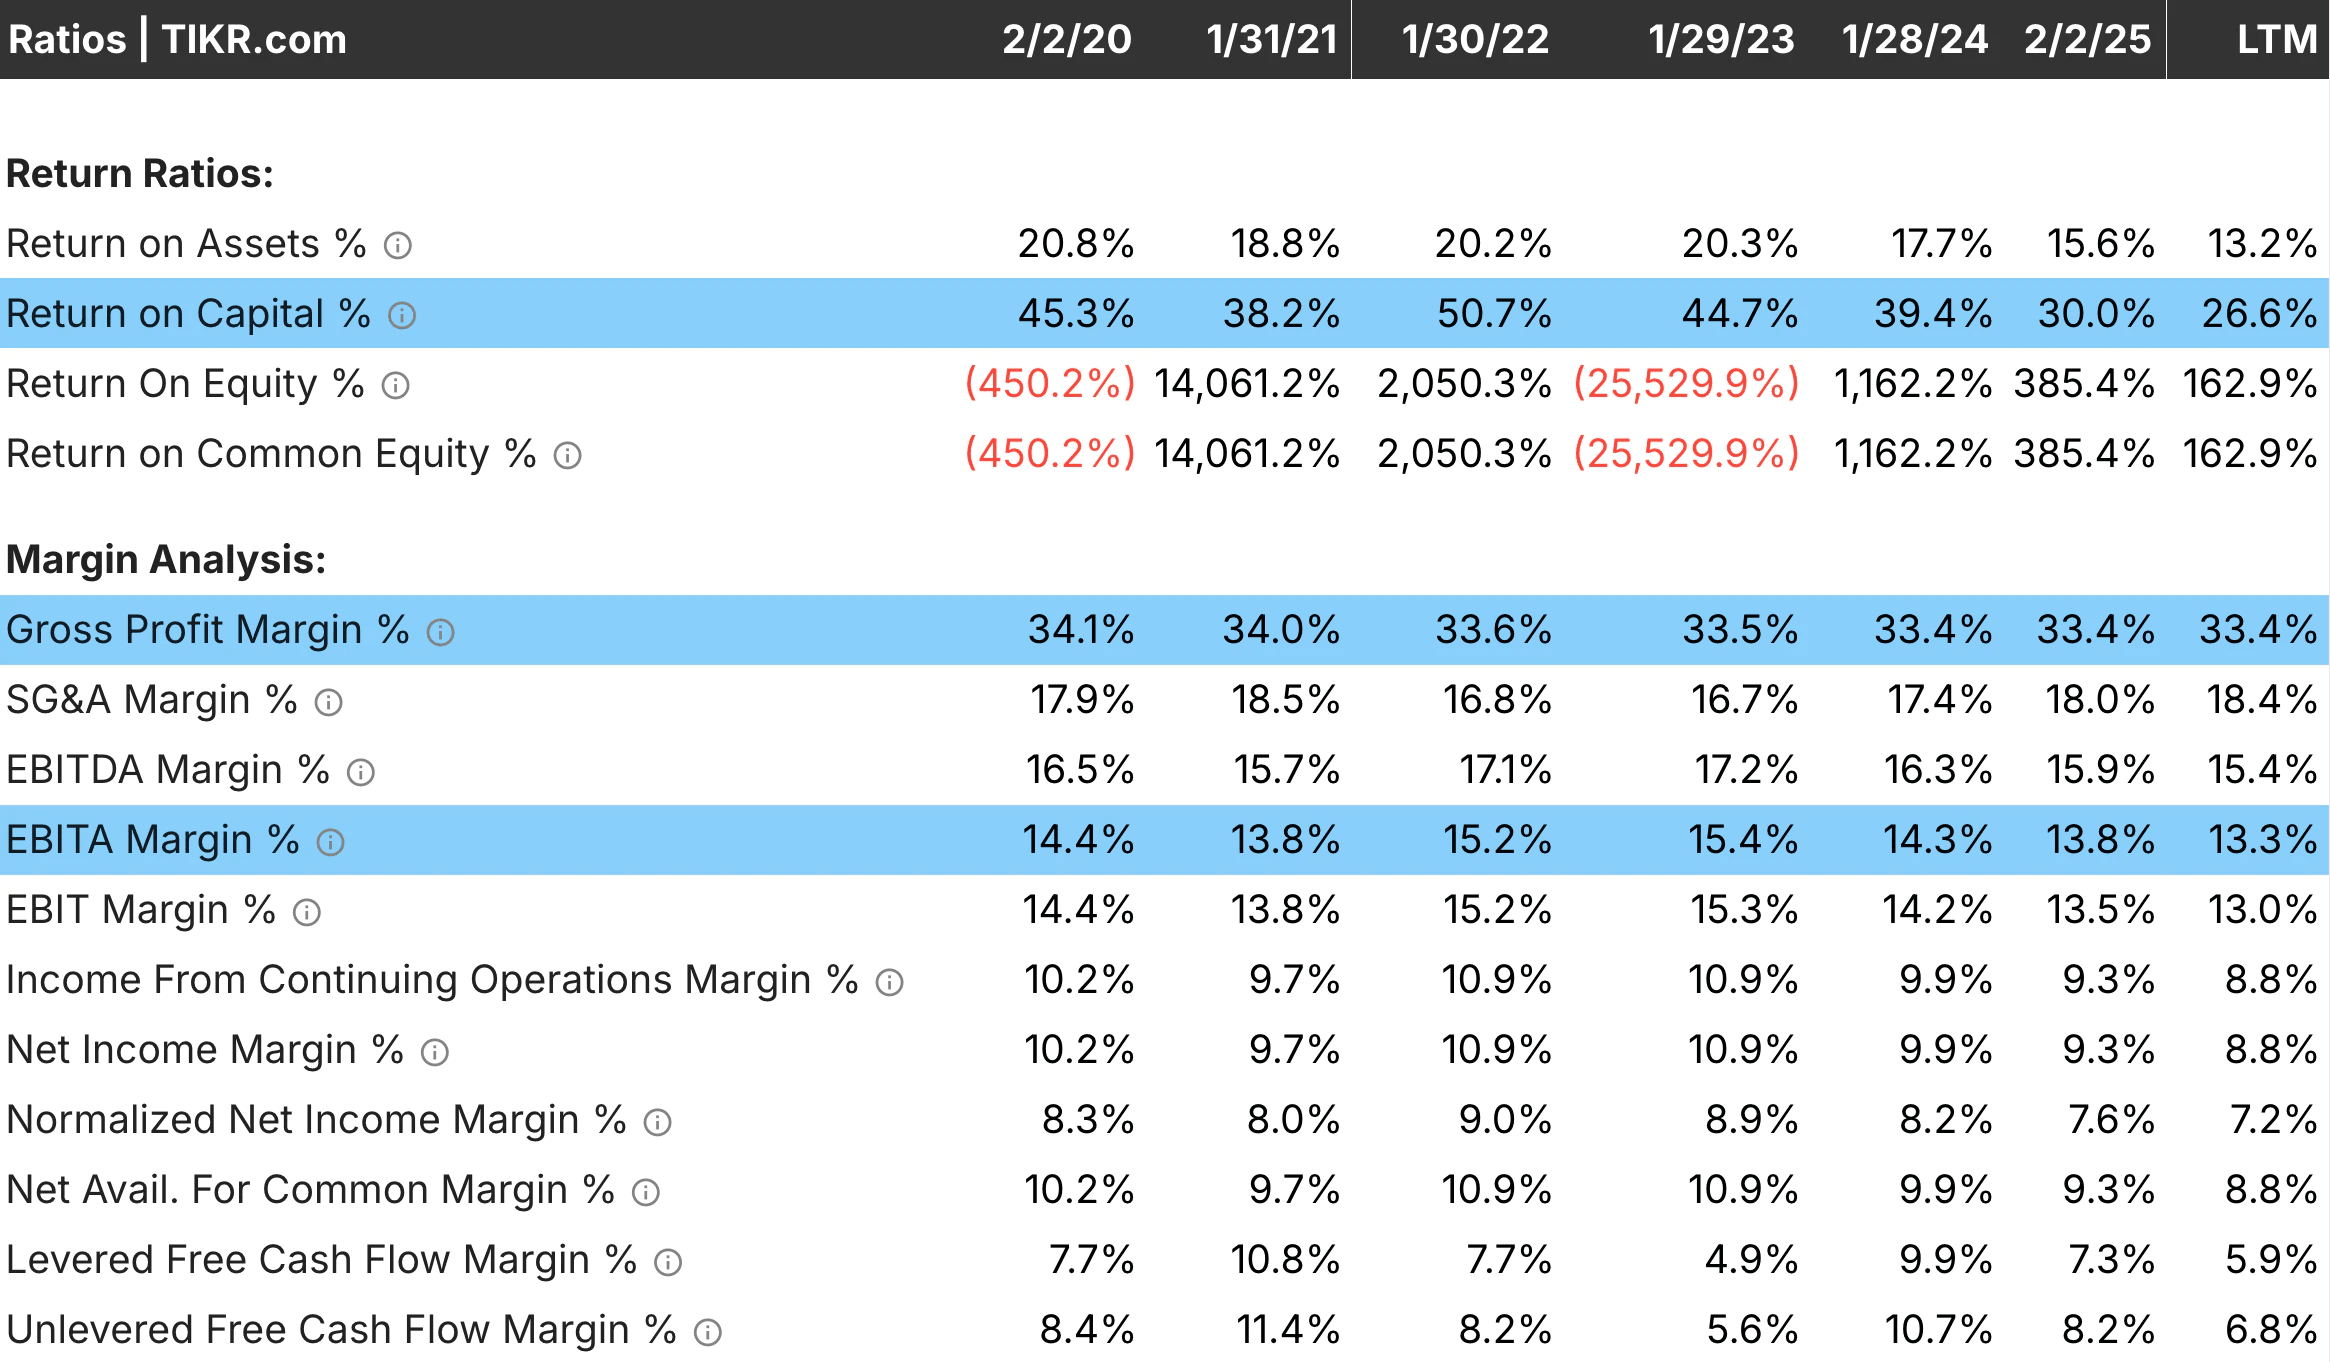
The Ratios tab rounds things out by surfacing metrics such as ROIC alongside margin data. A company can have healthy margins and still destroy value if it is reinvesting poorly, so having both in one place means you can check one against the other without losing your place in the research.
Best Features:
- Historical and Forward Margin Estimates: View gross margin and EBITDA margin actuals alongside multi-year analyst forecasts in the Estimates tab, giving you context that raw financials alone cannot provide.
- Full Income Statement with Charting: Access detailed historical cost data across any time period and visualize any line item instantly, including side-by-side comparisons with peers.
- Ratios Tab: Track ROIC and other profitability metrics that connect margin performance to how effectively the business is deploying its capital.
- Global Screener with Margin Filters: Screen across 100,000+ stocks using gross margin, EBITDA margin, and other profitability criteria to find companies meeting specific cost efficiency thresholds.
Discover where revenue is coming from for your favorite stocks (It’s free) >>>
2. Finviz
Finviz is the right tool when you want a quick read on margins without committing to a deep dive. The stock overview page surfaces operating and net margins alongside valuation and growth data, so you can quickly get a sense of whether a business is worth researching further before spending more time on it.

The screener is where Finviz earns its place in a margin workflow. You can filter by operating, net, and gross margin thresholds across the entire US market, which makes it useful for surfacing companies in a specific sector that hold strong margins relative to peers.
Best Features:
- Screener with Margin Filters: Filter stocks by operating margin, net margin, and gross margin to quickly surface companies meeting your profitability criteria.
- At-a-Glance Profitability Metrics: Each stock’s overview page displays key margin figures alongside other fundamentals, making it easy to efficiently triage a long list of candidates.
Look up company earning reports in under 60 seconds with TIKR (It’s free) >>>
3. Stock Analysis
Stock Analysis does a surprisingly good job of presenting income statement data in a clean, readable format. The financials page breaks out revenue, gross profit, operating income, and net income across multiple years and automatically calculates the margin percentages, so you don’t have to do that math by hand. For a free tool, it is noticeably more polished than what you typically expect at no cost.
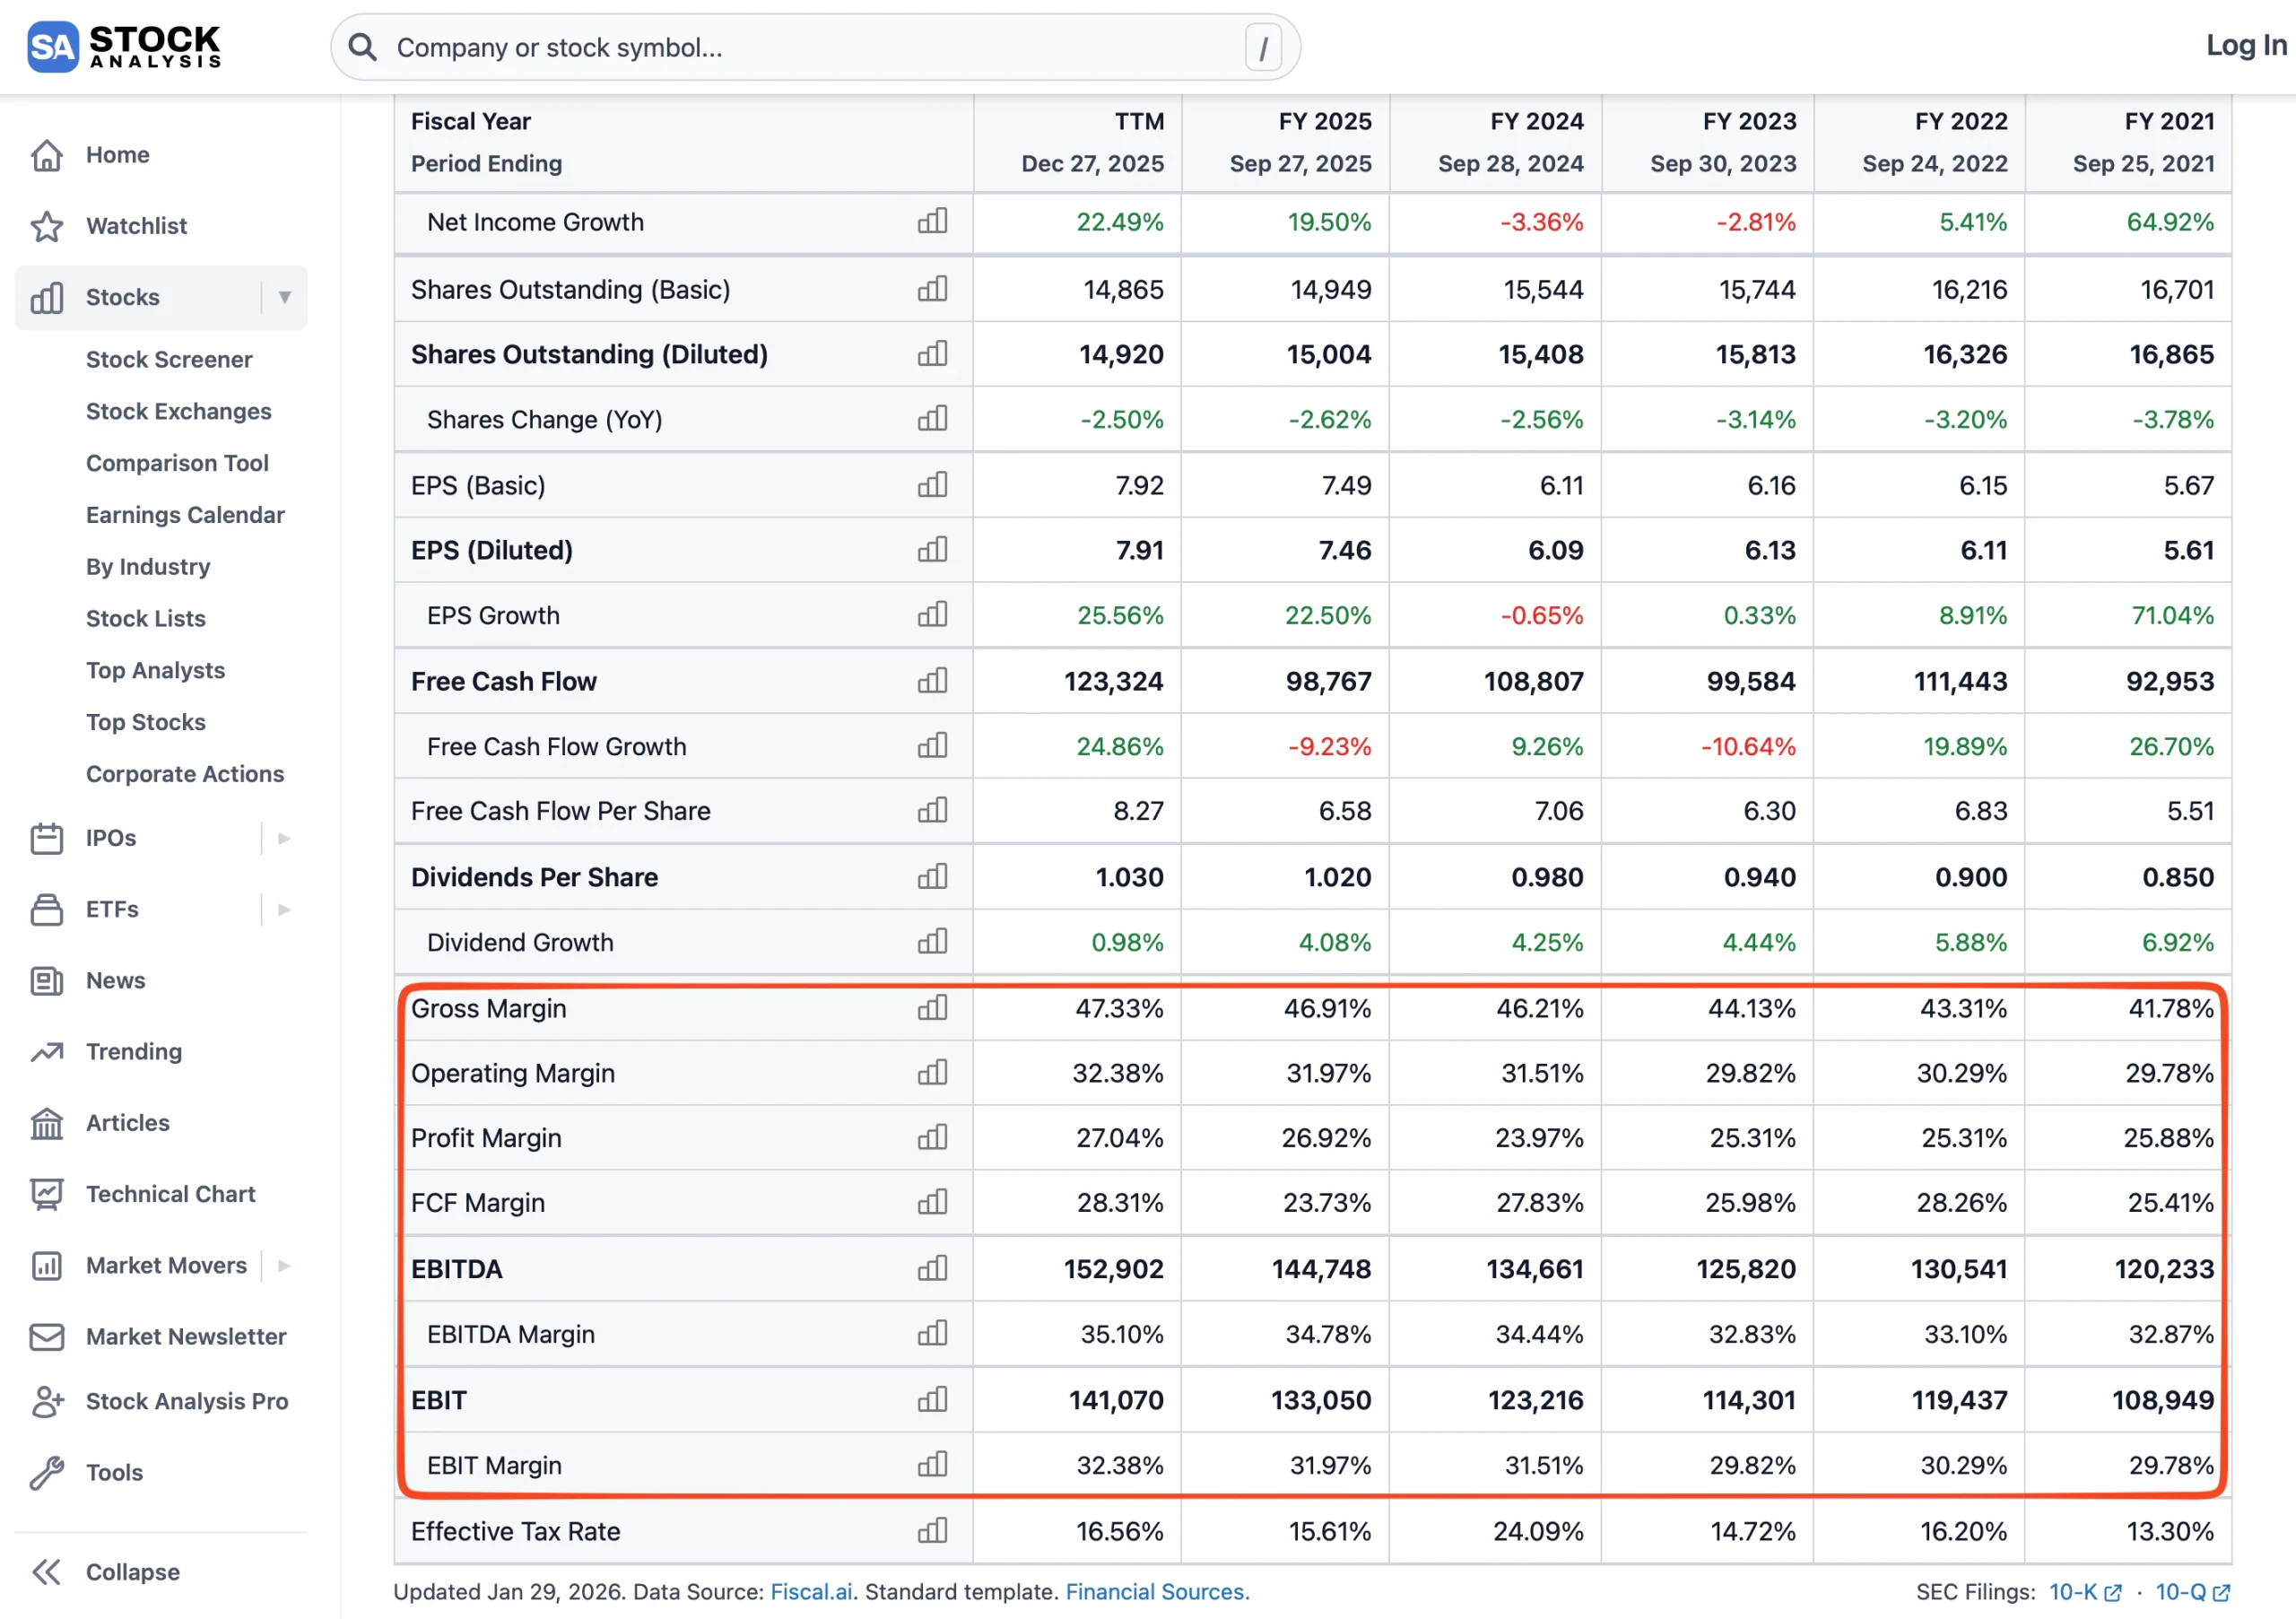
Where it stands out is the consistency of the layout across different companies. Once you know where to find the margin data for one stock, you know where to find it for all of them, and that predictability speeds things up considerably when you are working through several companies in the same session.
Best Features:
- Auto-Calculated Margin Percentages: Gross margin, operating margin, and net margin are displayed directly on the financials page, with no manual calculation required.
- Clean Multi-Year Income Statement: Revenue, cost of goods sold, and operating expenses are laid out consistently across annual and quarterly views, making year-over-year cost trends easy to follow.
4. Yahoo Finance
Yahoo Finance remains useful for margin analysis because of how much ground it covers and how quickly you can move between companies. The financials section includes a full income statement going back several years, and the TTM column provides a trailing 12-month view that is helpful when you want a current snapshot rather than a historical average.
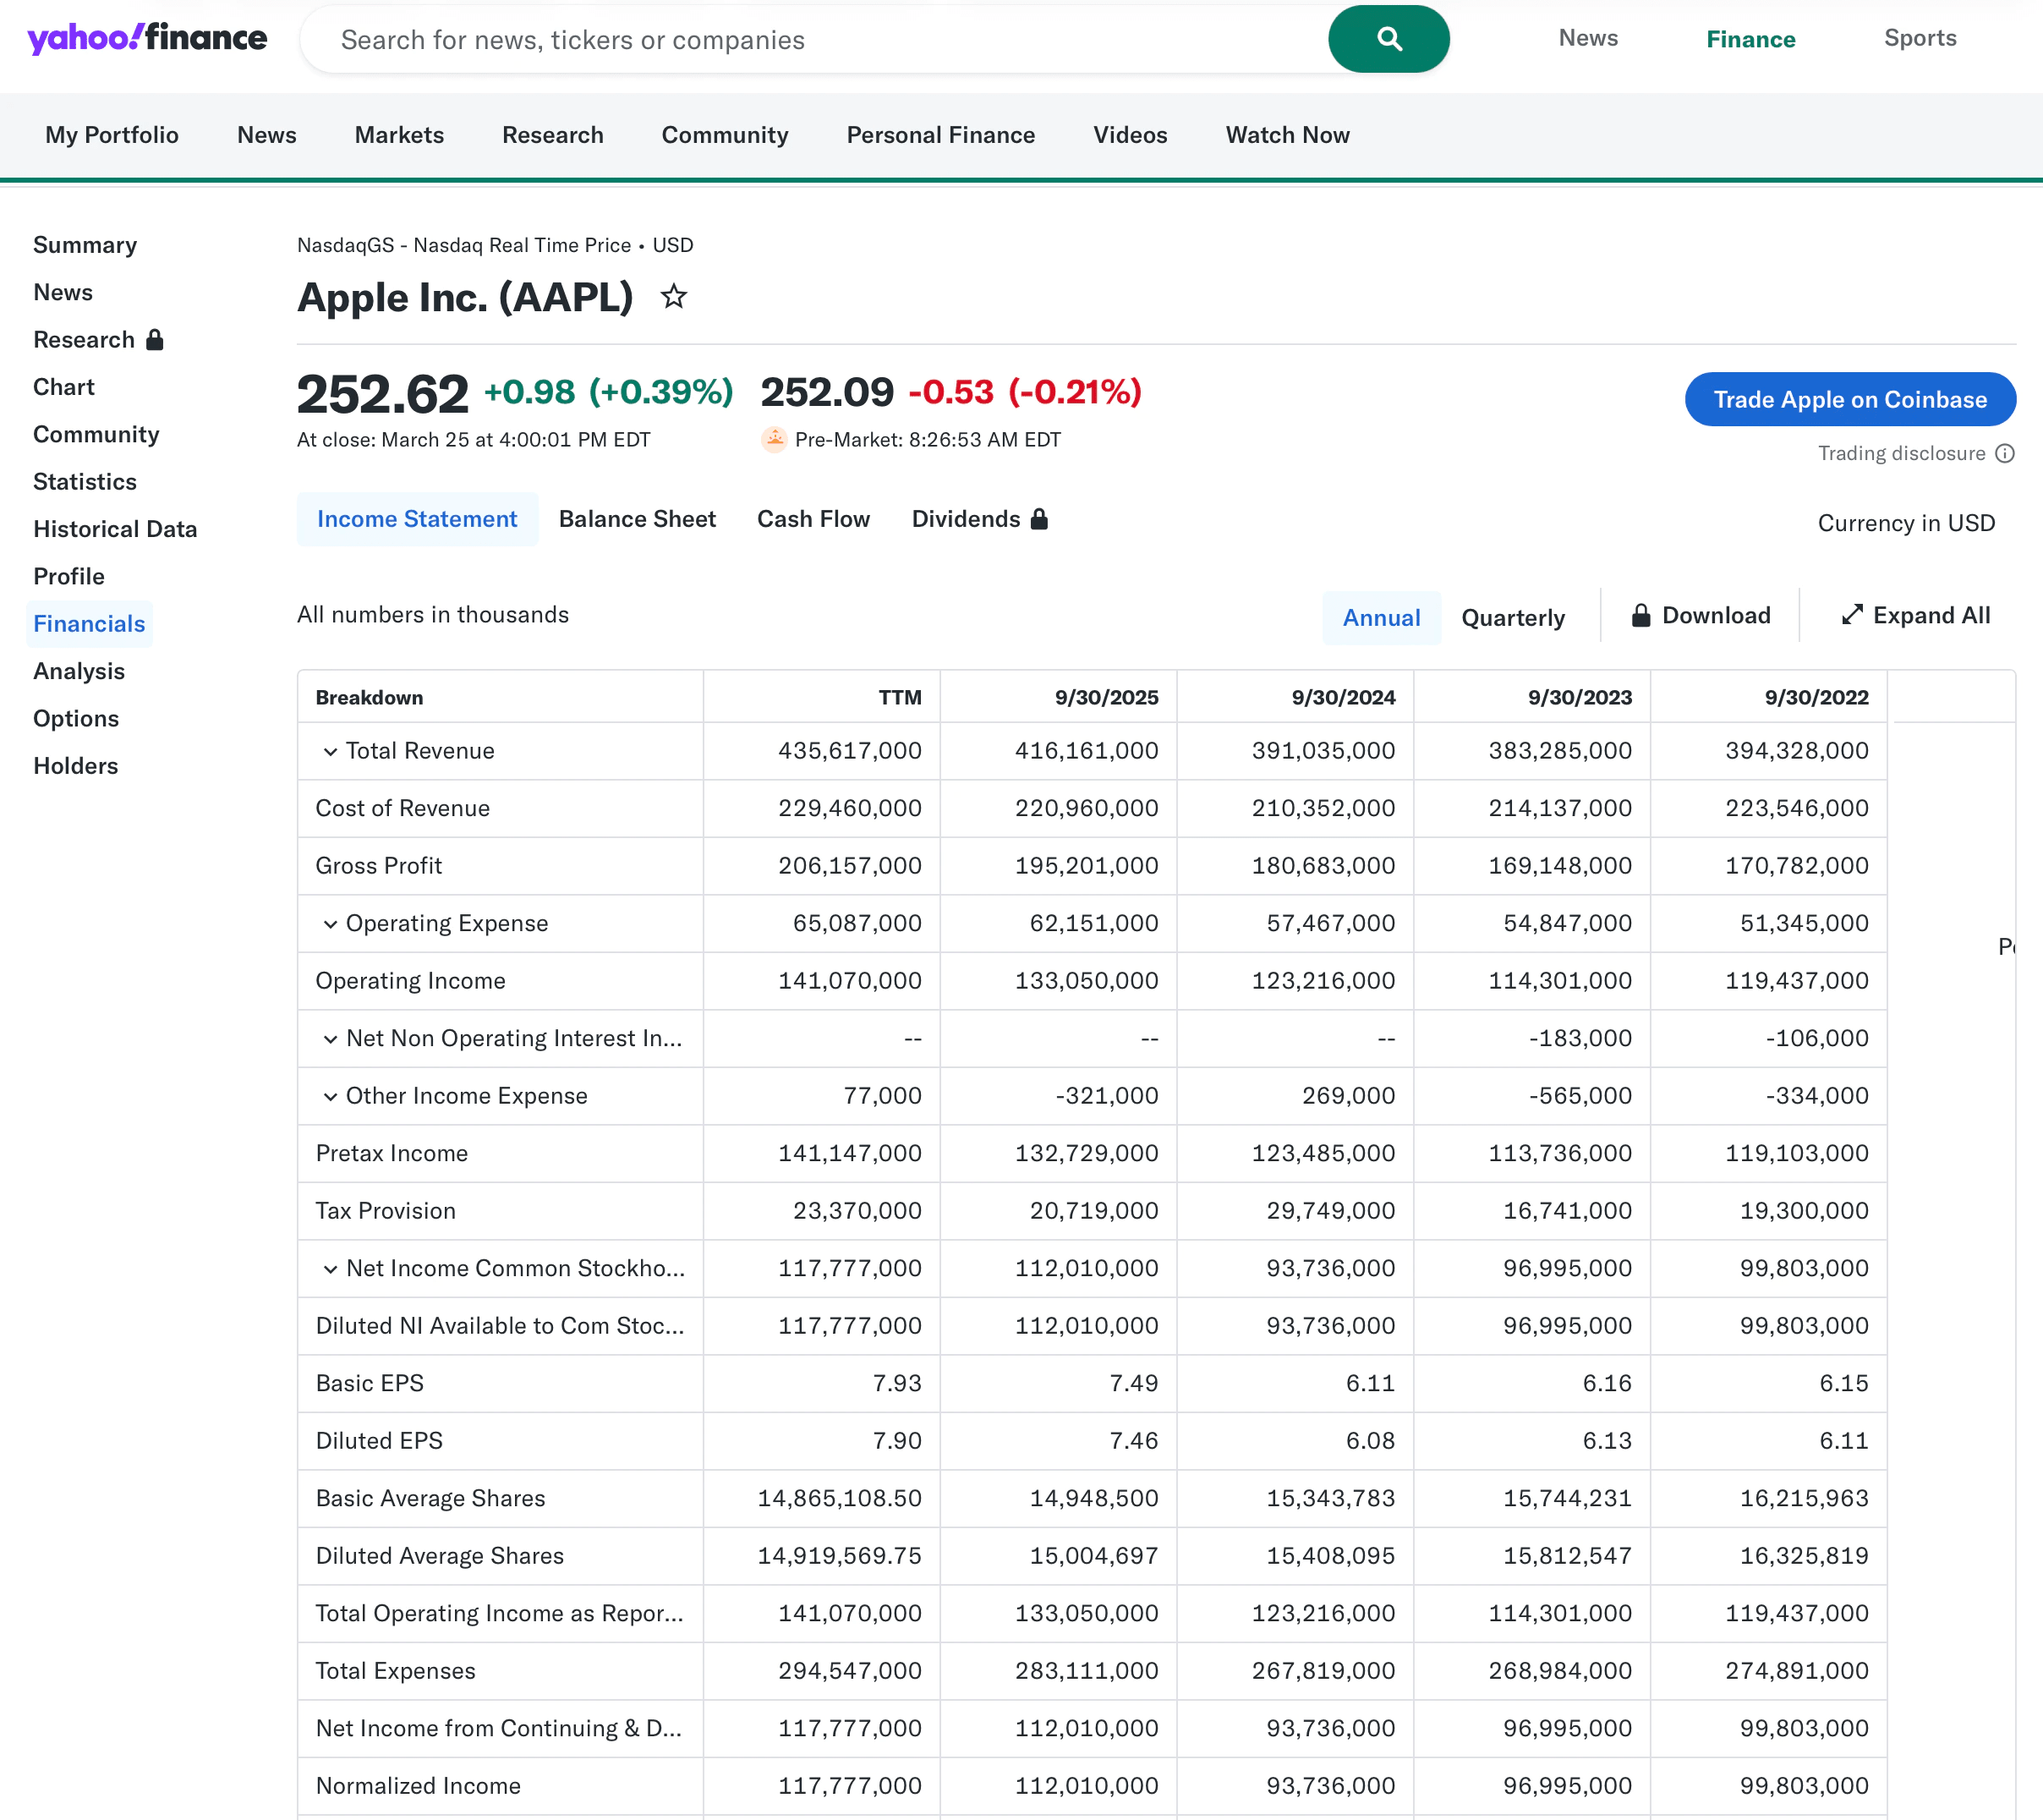
The analyst estimates section also surfaces forward earnings and revenue projections, giving you a rough sense of where margins are headed, even if the granularity is not as detailed as a dedicated research platform.
Best Features:
- Trailing Twelve-Month Income Statement: The TTM view gives you a current look at cost structure without waiting for the next annual filing, which is useful when a lot has changed in the business recently.
- Broad Company Coverage: Covers a wide range of domestic and international equities with consistent formatting, making it a reliable starting point for less familiar companies.
5. Investing.com
Investing.com is a powerful tool for investors who need broad global coverage and a deep catalog of financial ratios. Its income statement view provides 5 years of historical data for thousands of international companies, enabling you to audit the cost structures of stocks outside the U.S. market. It is a more robust alternative for those who need a data terminal experience without a subscription fee.
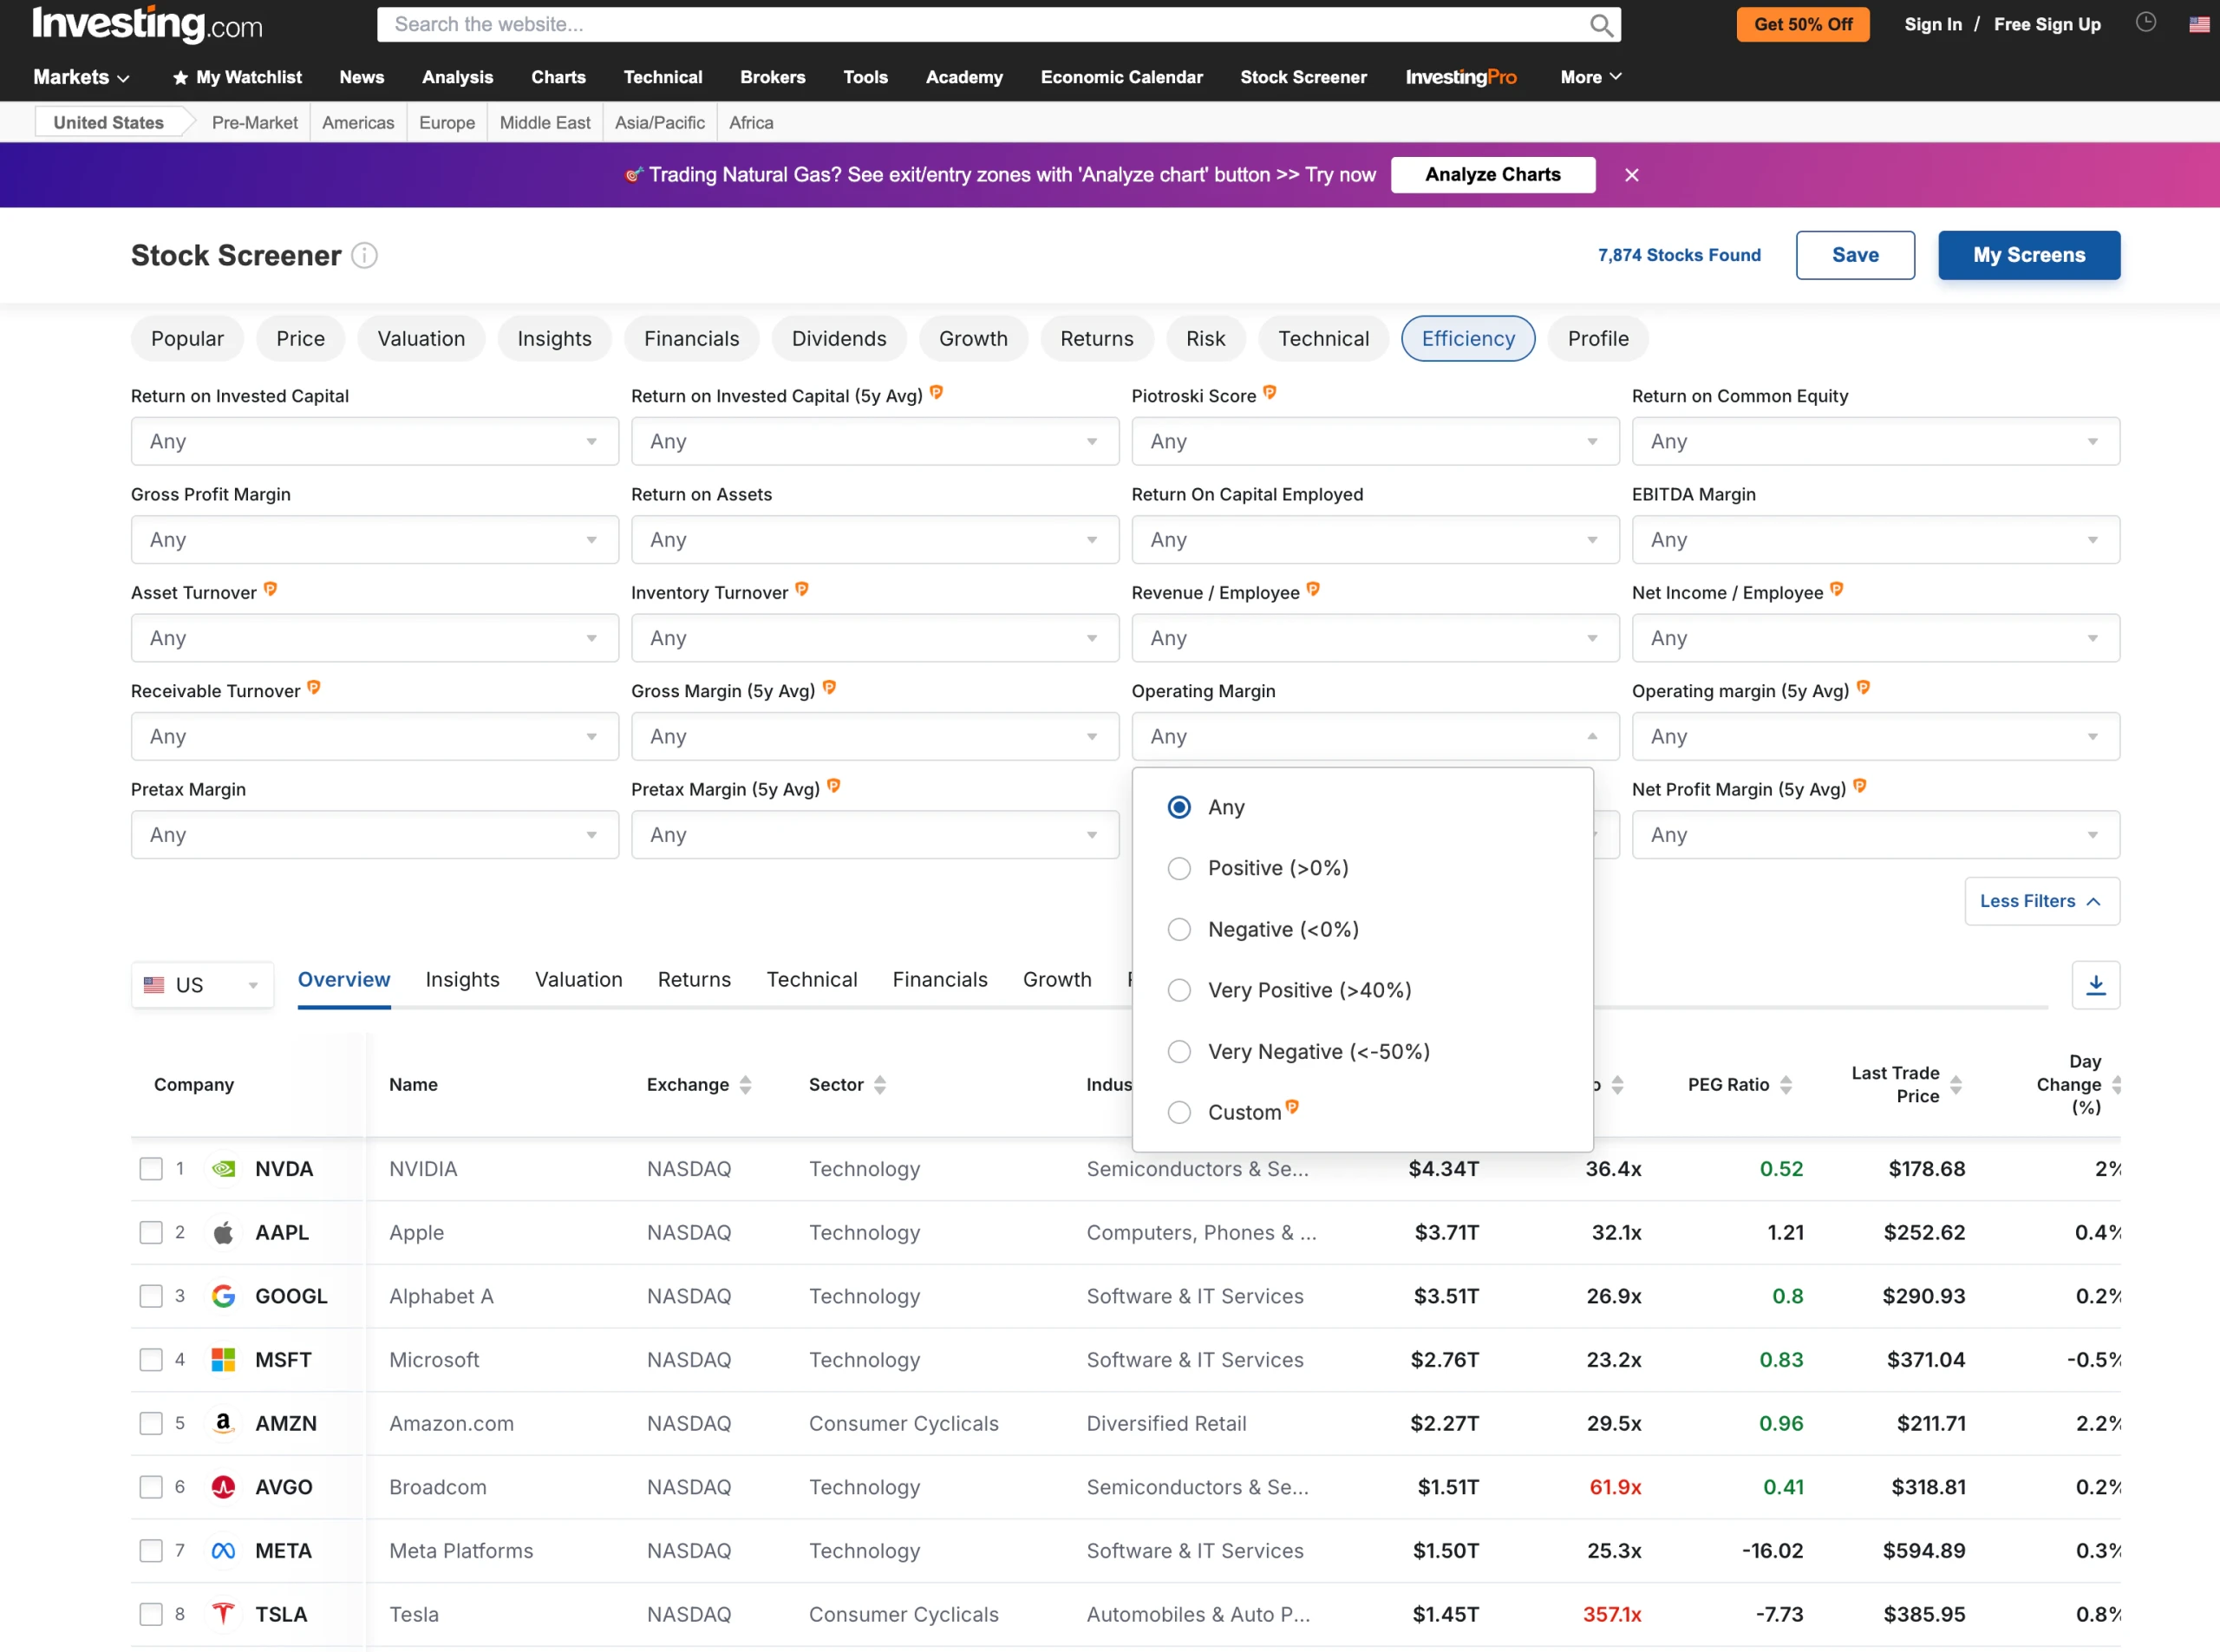
The platform’s Stock Screener is highly customizable, allowing you to filter by specific ratios, such as “Operating Margin (5y Avg),” to find companies with a proven track record of cost control. It excels at providing the raw data and standardized tables needed to compare competitors’ profitability across different exchanges side by side.
Best Features:
- Investing.com does this best by offering Comprehensive Global Data and a specialized screener for identifying long-term margin leaders in international markets.
Find out what your favorite stocks are really worth (Free with TIKR) >>>
TIKR Takeaway
Margins tell you whether a company is actually getting better at what it does or just doing more of the same thing. Revenue can grow for all kinds of reasons, but margins expanding alongside that growth usually signal something more durable underneath, whether that is pricing power, operating leverage, or cost discipline building over time.
Each tool on this list helps you look at that question from a different angle. TIKR is the one that connects historical margin trends to analyst expectations, lets you compare performance across peers, and keeps you on the same platform while you do it. That continuity is what turns a margin check from a one-off data point into a real part of how you evaluate a business.
Value Any Stock in Under 60 Seconds with TIKR
With TIKR’s new Valuation Model tool, you can estimate a stock’s potential share price in under a minute.
All it takes is three simple inputs:
- Revenue Growth
- Operating Margins
- Exit P/E Multiple
If you’re not sure what to enter, TIKR automatically fills in each input using analysts’ consensus estimates, giving you a quick, reliable starting point.
From there, TIKR calculates the potential share price and total returns under Bull, Base, and Bear scenarios so you can quickly see whether a stock looks undervalued or overvalued.
See a stock’s true value in under 60 seconds (Free with TIKR) >>>
Looking for New Opportunities?
- Discover which stocks billionaire investors are purchasing, so you can follow the smart money.
- Analyze stocks in as little as 5 minutes with TIKR’s all-in-one, easy-to-use platform.
- The more rocks you overturn… the more opportunities you’ll uncover. Search 100K+ global stocks, global top investor holdings, and more with TIKR.
Disclaimer:
Please note that the articles on TIKR are not intended to serve as investment or financial advice from TIKR or our content team, nor are they recommendations to buy or sell any stocks. We create our content based on TIKR Terminal’s investment data and analysts’ estimates. Our analysis might not include recent company news or important updates. TIKR has no position in any stocks mentioned. Thank you for reading, and happy investing!