
Key Takeaways:
- Lululemon is dealing with weaker North America demand, tariff pressure, and boardroom uncertainty, even as international growth remains strong.
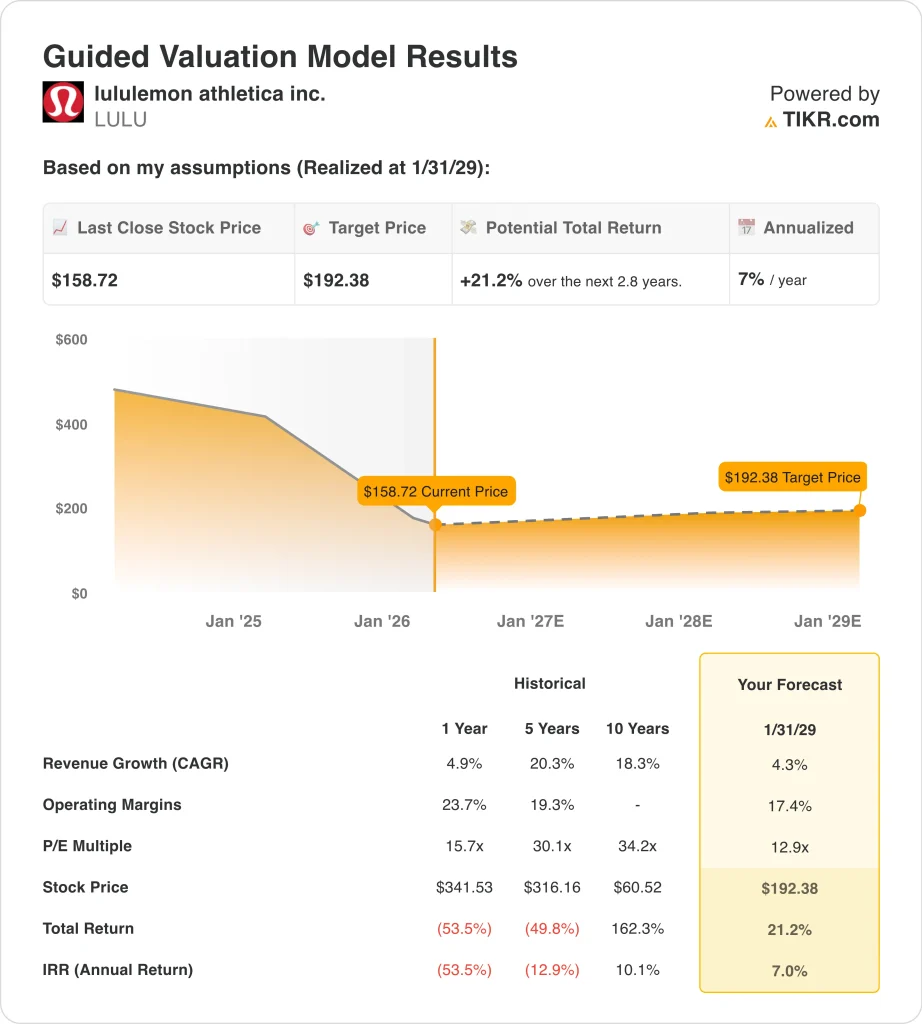
- LULU stock could reasonably reach $192 per share by January 2029, based on our valuation assumptions.
- This implies a total return of 21.2% from today’s price of $159, with an annualized return of 7.0% over the next 2.8 years.
Lululemon stock is moving lower because investors heard a cautious message at exactly the wrong time. The company beat on fourth-quarter revenue, but its 2026 outlook came in below Wall Street estimates and reinforced concerns about slowing demand. Reuters reported that the stock fell after the company forecast softer annual revenue and profit while also flagging tariff pressure.
The guidance shortfall was not the only issue. Lululemon said it expects a gross U.S. import tariff impact of about $380 million in 2026, up from $275 million in 2025. It also said fourth-quarter gross margin fell 550 basis points, including a 520-basis-point impact from U.S. import tariffs.
Demand trends also explain why the stock is pricing in more risk. In the fourth quarter, Americas revenue fell 4%, while international revenue rose 17%, and for the full year, Americas revenue slipped 1% as international revenue grew 22%. That split tells investors the global brand still has growth, but the core North American business is under pressure.
Boardroom uncertainty adds another layer. The company is still awaiting a permanent CEO, and founder Chip Wilson said “glaring governance deficiencies remain” even after lead director David Mussafer decided not to seek re-election.
That combination of softer guidance, tariff costs, and governance pressure is why the stock is trading much closer to its 52-week low than its high.
What the Model Says for LULU Stock
We analyzed the upside potential for Lululemon stock using valuation assumptions based on its slower top-line growth, still-healthy margins, and a much lower earnings multiple than investors were willing to pay in prior years.
Based on estimates of 4.3% annual revenue growth, 17.4% operating margins, and a normalized P/E multiple of 12.9x, the model projects Lululemon stock could rise from $159 to $192 per share by January 2029.
That would be a 21.2% total return, or a 7.0% annualized return over the next 2.8 years.
Our Valuation Assumptions
TIKR’s Valuation Model lets you plug in your own assumptions for a company’s revenue growth, operating margins, and P/E multiple, and calculates the stock’s expected returns.
Here’s what we used for LULU stock:
1. Revenue Growth: 4.3%
Lululemon grew revenue 4.9% in 2025 to $11.1 billion, but management guided for only 2% to 4% revenue growth in 2026. North America remained the weak spot, while international growth stayed strong.
That makes a 4.3% revenue assumption reasonable. It sits near management’s 2026 outlook and reflects slower growth than the company delivered over the last five and ten years. It also assumes international momentum helps offset softer sales in North America.
2. Operating Margins: 17.4%
Lululemon’s operating margin fell to 19.9% in 2025 from 23.7% in 2024, as gross margin compressed and operating income declined 11.8%. Fourth-quarter operating margin also dropped to 22.3% from 28.9% a year earlier.
The model’s 17.4% margin assumption builds in caution. Based on analysts’ consensus estimates, we assume margins stay below recent peak levels as tariffs, markdown risk, and weaker full-price selling continue to pressure profitability. That is a more conservative view than simply extrapolating past margins.
3. Exit P/E Multiple: 12.9x
Lululemon is trading at about 12.9x NTM P/E and 12.0x LTM P/E, which is far below the higher multiples the market gave the stock during its stronger growth years. The guided model uses the same 12.9x exit multiple.
That matters because this valuation is not assuming the stock reverts to a premium multiple. Instead, it assumes Lululemon keeps trading at a more modest earnings multiple unless growth and brand momentum improve materially. That is why even a recovery in price still leads to only mid-single-digit annualized returns in the model.
Build your own Valuation Model to value any stock (It’s free!) >>>
What Happens If Things Go Better or Worse?
Different scenarios for LULU stock through 2031 show varied outcomes based on North America demand, margin recovery, and valuation levels (these are estimates, not guaranteed returns):
- Low Case: North America remains weak, and margins stay under pressure → 1.2% annual returns
- Mid Case: International growth offsets softness, and margins stabilize → 7.5% annual returns
- High Case: Product momentum improves, and profitability recovers more quickly → 9.7% annual returns

Even in the conservative case, LULU stock offers positive returns supported by its strong brand, high gross margins, and near-net-cash balance sheet.
But the model also shows why the market remains hesitant. Lululemon still needs to prove that North America can recover, margins can stabilize, and leadership uncertainty will not drag on the brand.
See what analysts think about LULU stock right now (Free with TIKR) >>>
Should You Invest in lululemon athletica?
The only way to really know is to look at the numbers yourself. TIKR gives you free access to the same institutional-quality financial data that professional analysts use to answer exactly that question.
Pull up LULU, and you’ll see years of historical financials, what Wall Street analysts expect for revenue and earnings in the quarters ahead, how valuation multiples have moved over time, and whether price targets are trending up or down.
You can build a free watchlist to track LULU alongside every other stock on your radar. No credit card required. Just the data you need to decide for yourself.
Analyze lululemon athletica stock on TIKR Free→
Looking for New Opportunities?
- See what stock billionaire investors are buying so you can follow the smart money.
- Analyze stocks in as little as 5 minutes with TIKR’s all-in-one, easy-to-use platform.
- The more rocks you overturn… the more opportunities you’ll uncover. Search 100K+ global stocks, global top investor holdings, and more with TIKR.
Disclaimer:
Please note that the articles on TIKR are not intended to serve as investment or financial advice from TIKR or our content team, nor are they recommendations to buy or sell any stocks. We create our content based on TIKR Terminal’s investment data and analysts’ estimates. Our analysis might not include recent company news or important updates. TIKR has no position in any stocks mentioned. Thank you for reading, and happy investing!