
Every investor loves the idea of passive income. There is something deeply satisfying about checking your brokerage account and seeing cash deposited simply because you own a piece of a business.
This appeal often leads investors to look for stocks with high dividend yields because dividends are a form of passive income from your investments.
Find the best high-yield dividend stocks to buy today (Sign up for TIKR, it’s free) >>>
However, buying stocks with the highest possible dividend yield is usually a mistake. An unusually high yield is rarely a gift from the market; it is often a warning sign that the stock price has collapsed because the market expects a dividend cut or the business has deteriorating fundamentals.
If you buy a stock solely for its 10% yield, you may end up losing 50% of your principal over time if the business struggles to compete in the marketplace.
Sustainable dividend income requires a different approach. You need to focus on the business’s durability and its ability to generate the cash required to pay you. By using TIKR to look under the hood of a company’s financials, you can distinguish between a high-quality compounder and a value trap.
The Yield Trap Warning
Before you look at a single metric, you must accept a simple reality about yield. The dividend yield is simply the company’s annual dividend divided by its stock price. Therefore, when a stock’s price falls, the yield automatically goes up, even if the business is getting worse.
For example, a stable utility yielding 4% because it consistently generates cash is very different from a stock yielding 4% because its share price just fell 30% due to weak results or a legal issue. The yield number is the same, but the risk is completely different.
Your goal is to own high-yield stocks that can comfortably pay their dividends from real business profits. If a company cannot fund its dividend from its operations, it will eventually have to borrow money or issue more shares to keep paying it. That usually leads to worse outcomes for shareholders.
Step 1: Check the Stock’s Payout Ratio
The payout ratio is your first line of defense against a dividend cut. It tells you exactly what percentage of a company’s earnings is being returned to shareholders as cash. If a company earns $1.00 per share and pays out $0.95, management has almost no margin for error.
If profits dip even slightly due to a recession or operational issue, that dividend becomes mathematically unsustainable.
Value any stock in less than 60 seconds with TIKR’s new Valuation Model (It’s free) >>>
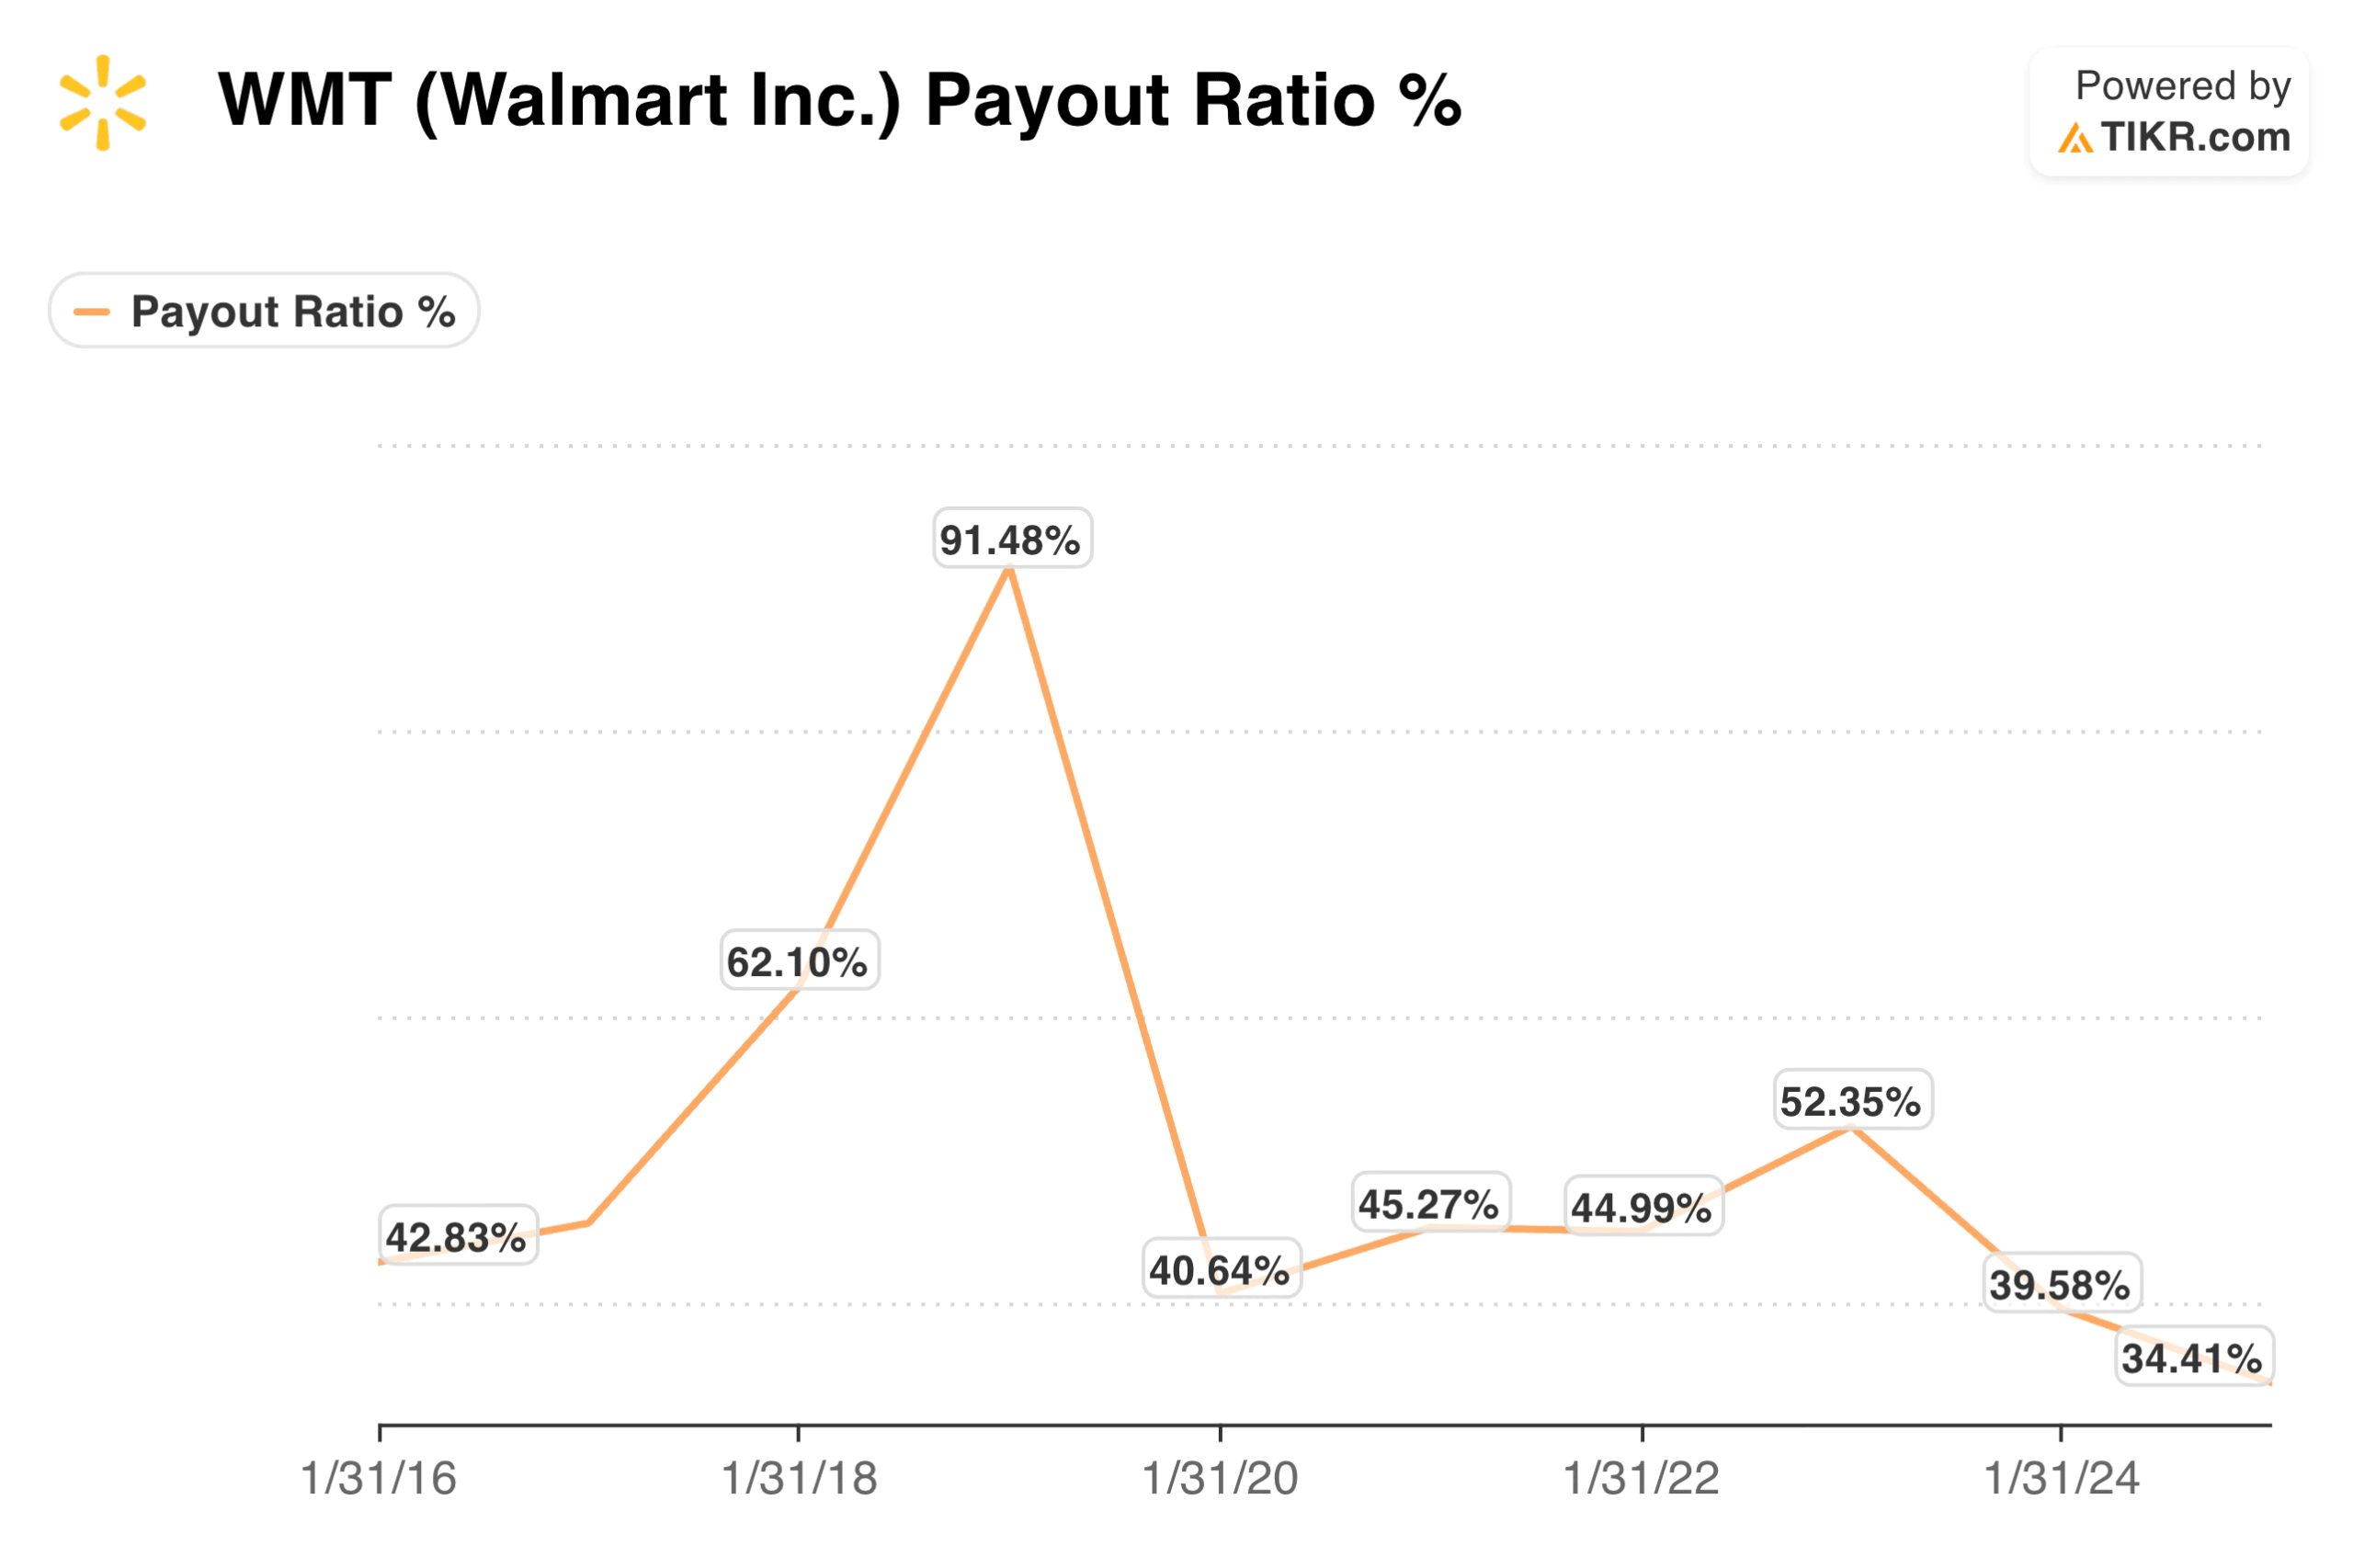
On the TIKR Financials > Income Statement tab, you can view the payout ratio trends over the last decade to see if the company is becoming more or less conservative. You need to apply different standards to different industries.
For most standard industrial or consumer companies, a payout ratio below 60% is generally considered healthy, as it leaves ample capital for reinvestment.
However, for REITs or Business Development Companies (BDCs), which are legally required to distribute 90% of taxable income, a higher ratio is standard and acceptable. If you see a payout ratio consistently above 100%, the company is paying out more than it earns, which is a major red flag.
Step 2: Verify Free Cash Flow Coverage

Earnings per share can sometimes be misleading due to non-cash accounting adjustments, but cash flow rarely lies. You need to verify that the company generates enough actual cash to cover the checks it sends to investors.
If a company reports strong net income but has weak cash flow, it might be borrowing money just to maintain its dividend streak, which destroys shareholder value over the long term.
Switch your view on TIKR to the Cash Flow statement and compare “Free Cash Flow” to “Dividends Paid” over a five-year period. You want to see Free Cash Flow comfortably exceeding the dividend payments in every single year, ideally with a buffer of 20% or more.
This surplus cash allows the company to pay down debt, buy back stock, or acquire competitors without putting the dividend at risk. If the free cash flow is consistently lower than the dividend, the payout is living on borrowed time.
Get the most up to date financial snapshots of thousands of stocks with TIKR (It’s free) >>>
Step 3: Analyze the Stock’s Dividend History

The best predictor of future behavior is typically past behavior, especially when it comes to capital allocation. Management teams that have consistently raised dividends through recessions, pandemics, and inflationary periods have proven that they view the dividend as a commitment, not an option.
A long track record of increases suggests a business model with durable competitive advantages and a culture of shareholder alignment.
Use the TIKR Chart feature to visually plot “Dividend Per Share” over a 5 or 10-year horizon. You are looking for a “staircase” pattern, steady steps up and to the right, year after year.
It might be best to avoid companies with jagged charts where the dividend is cut, raised, and then cut again, as this indicates a cyclical or unstable business. You want a boring, predictable growth in dividends that mirrors the long-term growth of the business’s underlying earnings.
Analyze the top stocks in your portfolio with TIKR (It’s free) >>>
Step 4: Screen for Dividend Growth, Not Just a High Dividend Yield
A high starting yield is nice, but dividend growth is what protects your purchasing power against inflation over the long term. A stock yielding 2% today that grows its payout by 10% annually will eventually pay you far more on your original investment than a stagnant stock that yields 4% but never raises it.
This “yield on cost” compounding is the secret engine of many successful retirement portfolios.
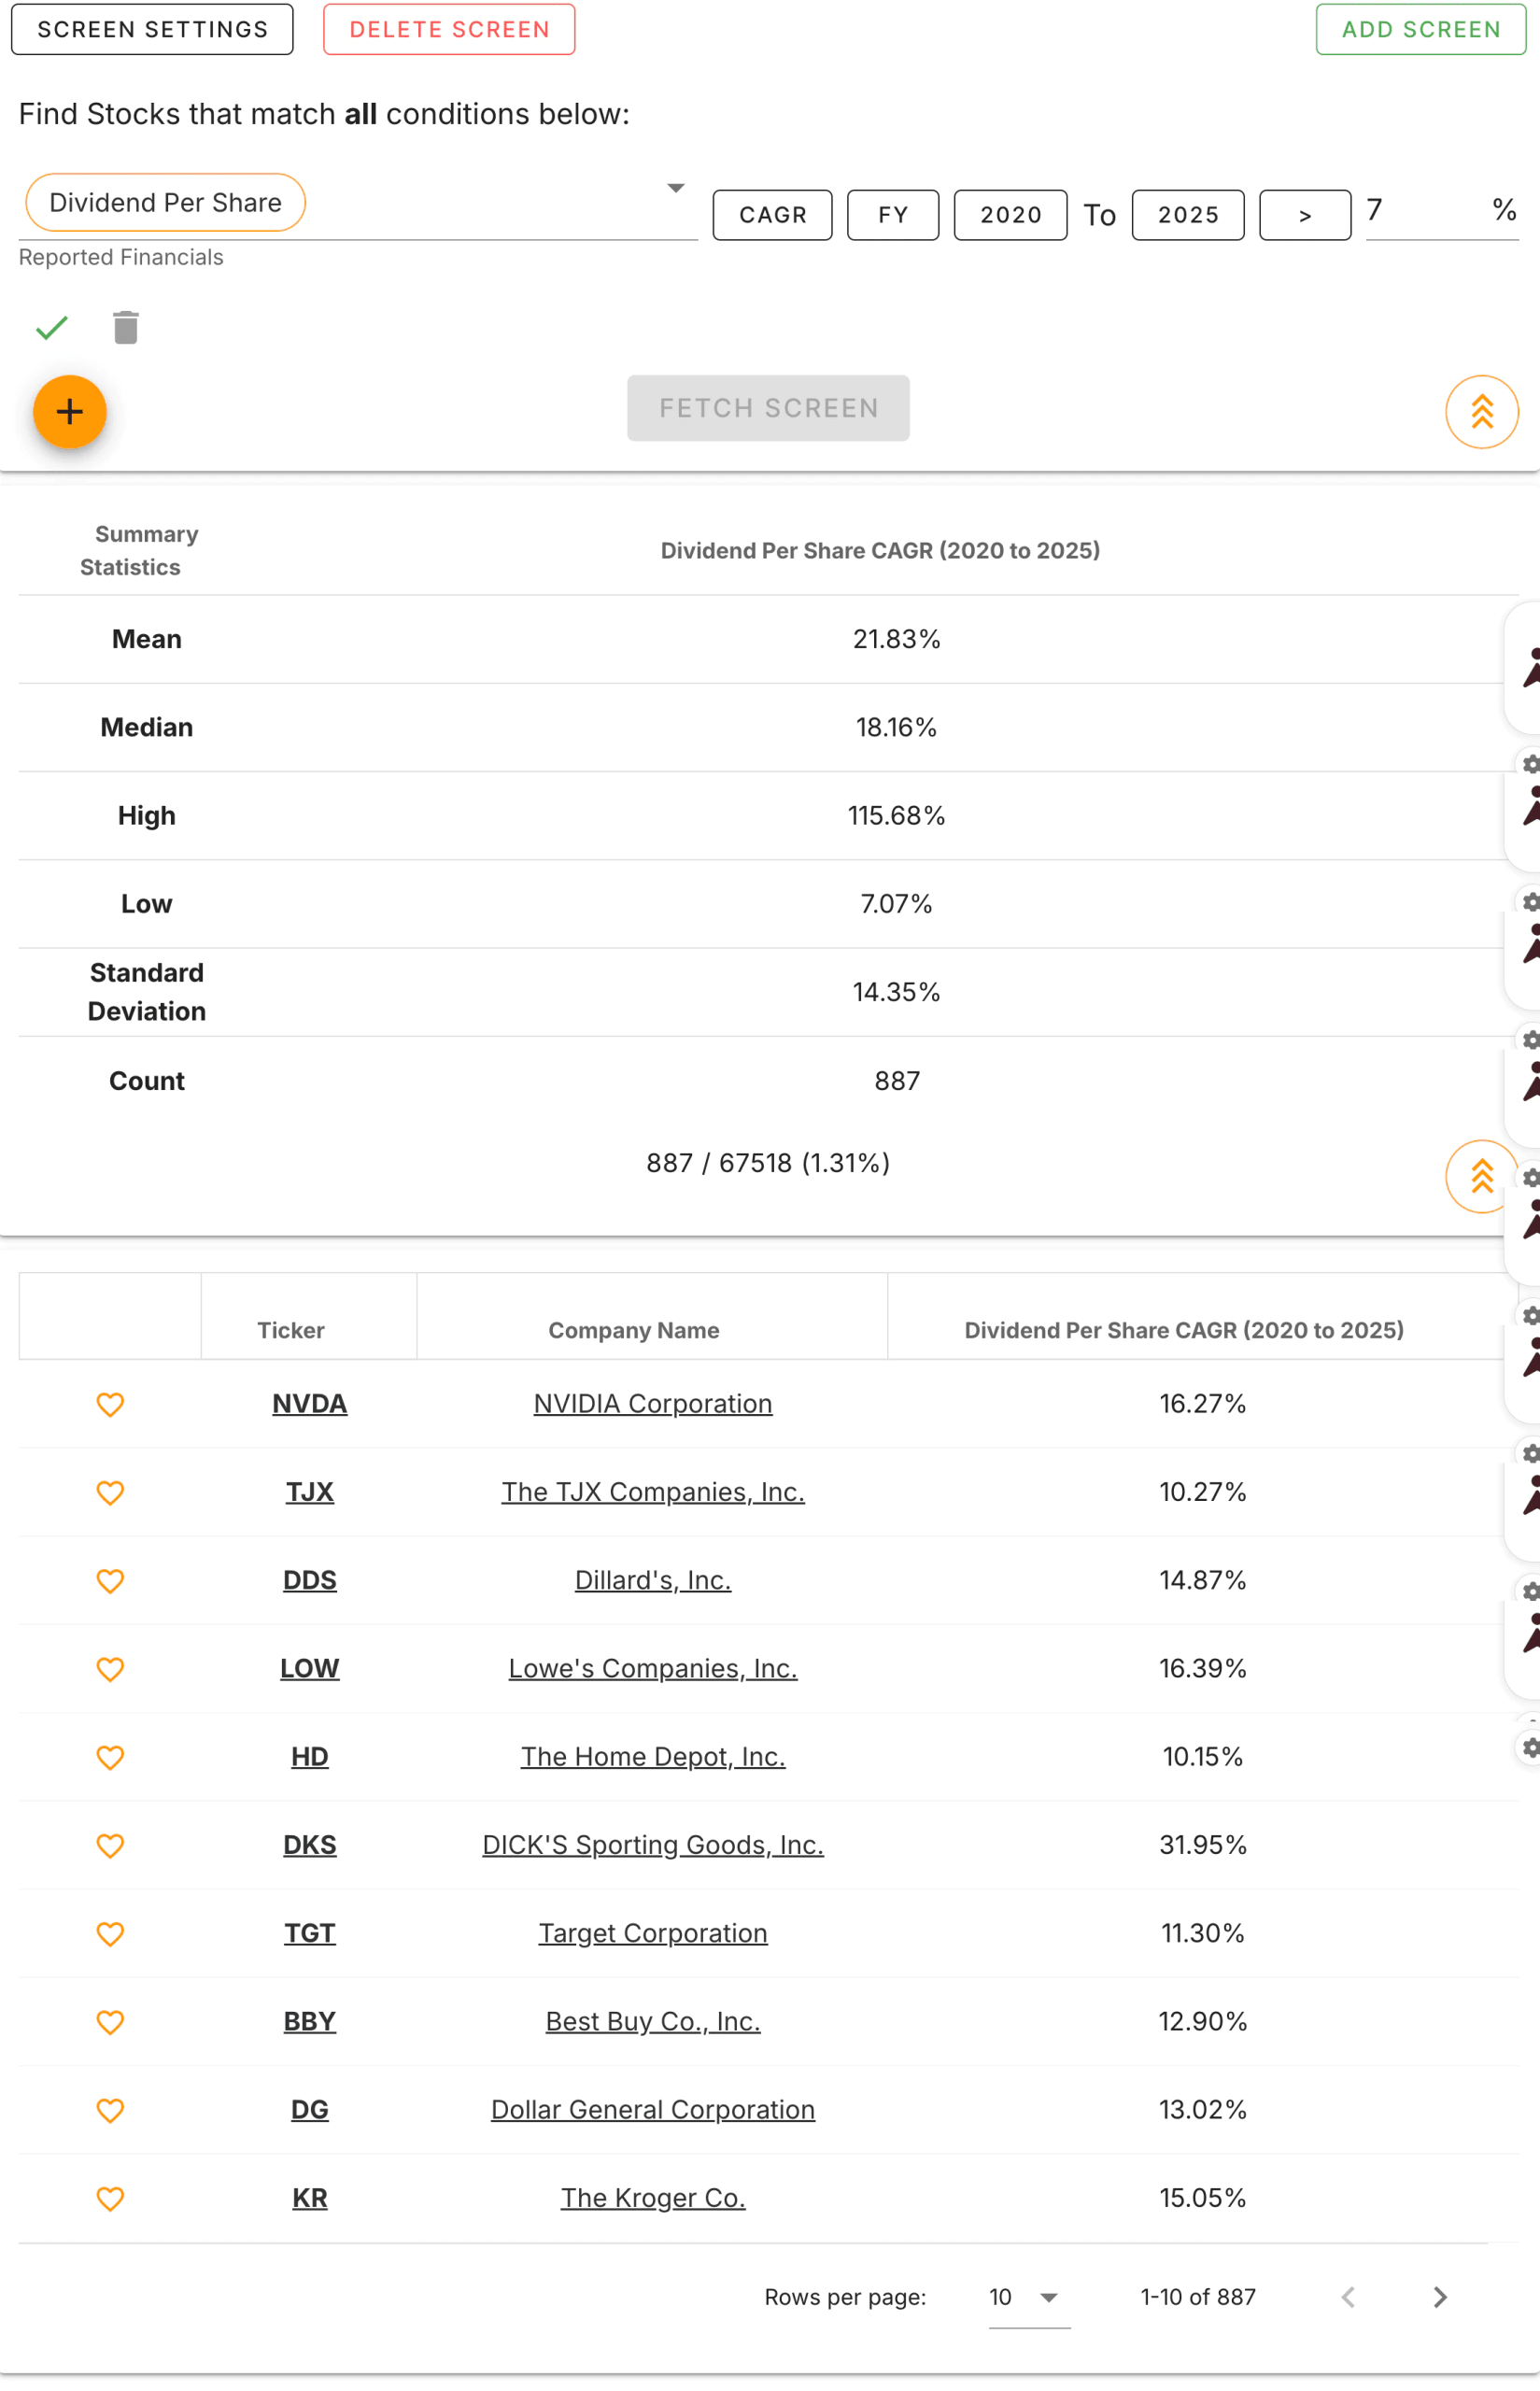
You can use the Global Screener tool on TIKR to filter specifically for companies with a high “Dividend CAGR” (Compound Annual Growth Rate). Setting a filter for a 5-year Dividend CAGR of at least 7% weeds out the stagnant “bond-proxy” businesses and leaves you with the growers.
This ensures you identify companies that are increasing their intrinsic value over time.
Quickly find the best dividend stocks to buy today with TIKR’s stock screener (It’s free) >>>
Common Mistakes to Avoid
One of the most common mistakes investors make is focusing on the current dividend yield while ignoring the company’s balance sheet. A stock can look “safe” because it has a high yield, even if the company is carrying a lot of debt.
When interest rates rise or the company needs to refinance its debt at higher costs, more cash goes toward interest payments. In many cases, the dividend is the first thing management cuts to conserve cash.
Always check a stock’s Net Debt/EBITDA ratio on TIKR. If this ratio is significantly higher than peers, the dividend is less secure than it appears.
Another error is ignoring cyclicality. A commodity producer might pay a massive dividend when oil or copper prices are high, but that payout will vanish when commodity prices cycle down. Do not value a cyclical company based on its peak-cycle yield.
How Investors Should Apply This in Practice
Imagine you are looking at a major pharmaceutical company. It offers a 3.5% yield, which appears attractive relative to Treasury bonds. Before buying, you check TIKR.
You see the Payout Ratio is 120%, which alarms you. However, digging deeper into the Financials, you notice that a one-time legal settlement skewed this year’s earnings. You check Free Cash Flow and see it still easily covers the dividend.
You then review the Valuation model and see that the yield is at the high end of its 10-year range, suggesting the stock is undervalued relative to its historical performance. By combining these steps, you confirm the dividend is safe despite the messy headline earnings.
The TIKR Takeaway
Dividend yield is just a number, while safety is a research process. You do not need to guess if a dividend is at risk.
By using TIKR to check payout ratios, cash flow coverage, and historical trends, you can build an income portfolio based on business durability rather than hope.
Value Any Stock in Under 60 Seconds with TIKR
With TIKR’s new Valuation Model tool, you can estimate a stock’s potential share price in under a minute.
All it takes is three simple inputs:
- Revenue Growth
- Operating Margins
- Exit P/E Multiple
If you’re not sure what to enter, TIKR automatically fills in each input using analysts’ consensus estimates, giving you a quick, reliable starting point.
From there, TIKR calculates the potential share price and total returns under Bull, Base, and Bear scenarios so you can quickly see whether a stock looks undervalued or overvalued.
See a stock’s true value in under 60 seconds (Free with TIKR) >>>
Looking for New Opportunities?
- Discover which stocks billionaire investors are purchasing, so you can follow the smart money.
- Analyze stocks in as little as 5 minutes with TIKR’s all-in-one, easy-to-use platform.
- The more rocks you overturn… the more opportunities you’ll uncover. Search 100K+ global stocks, global top investor holdings, and more with TIKR.
Disclaimer:
Please note that the articles on TIKR are not intended to serve as investment or financial advice from TIKR or our content team, nor are they recommendations to buy or sell any stocks. We create our content based on TIKR Terminal’s investment data and analysts’ estimates. Our analysis might not include recent company news or important updates. TIKR has no position in any stocks mentioned. Thank you for reading, and happy investing!