Key Stats for Wells Fargo Stock
- Price Change for Wells Fargo stock: -4.61%
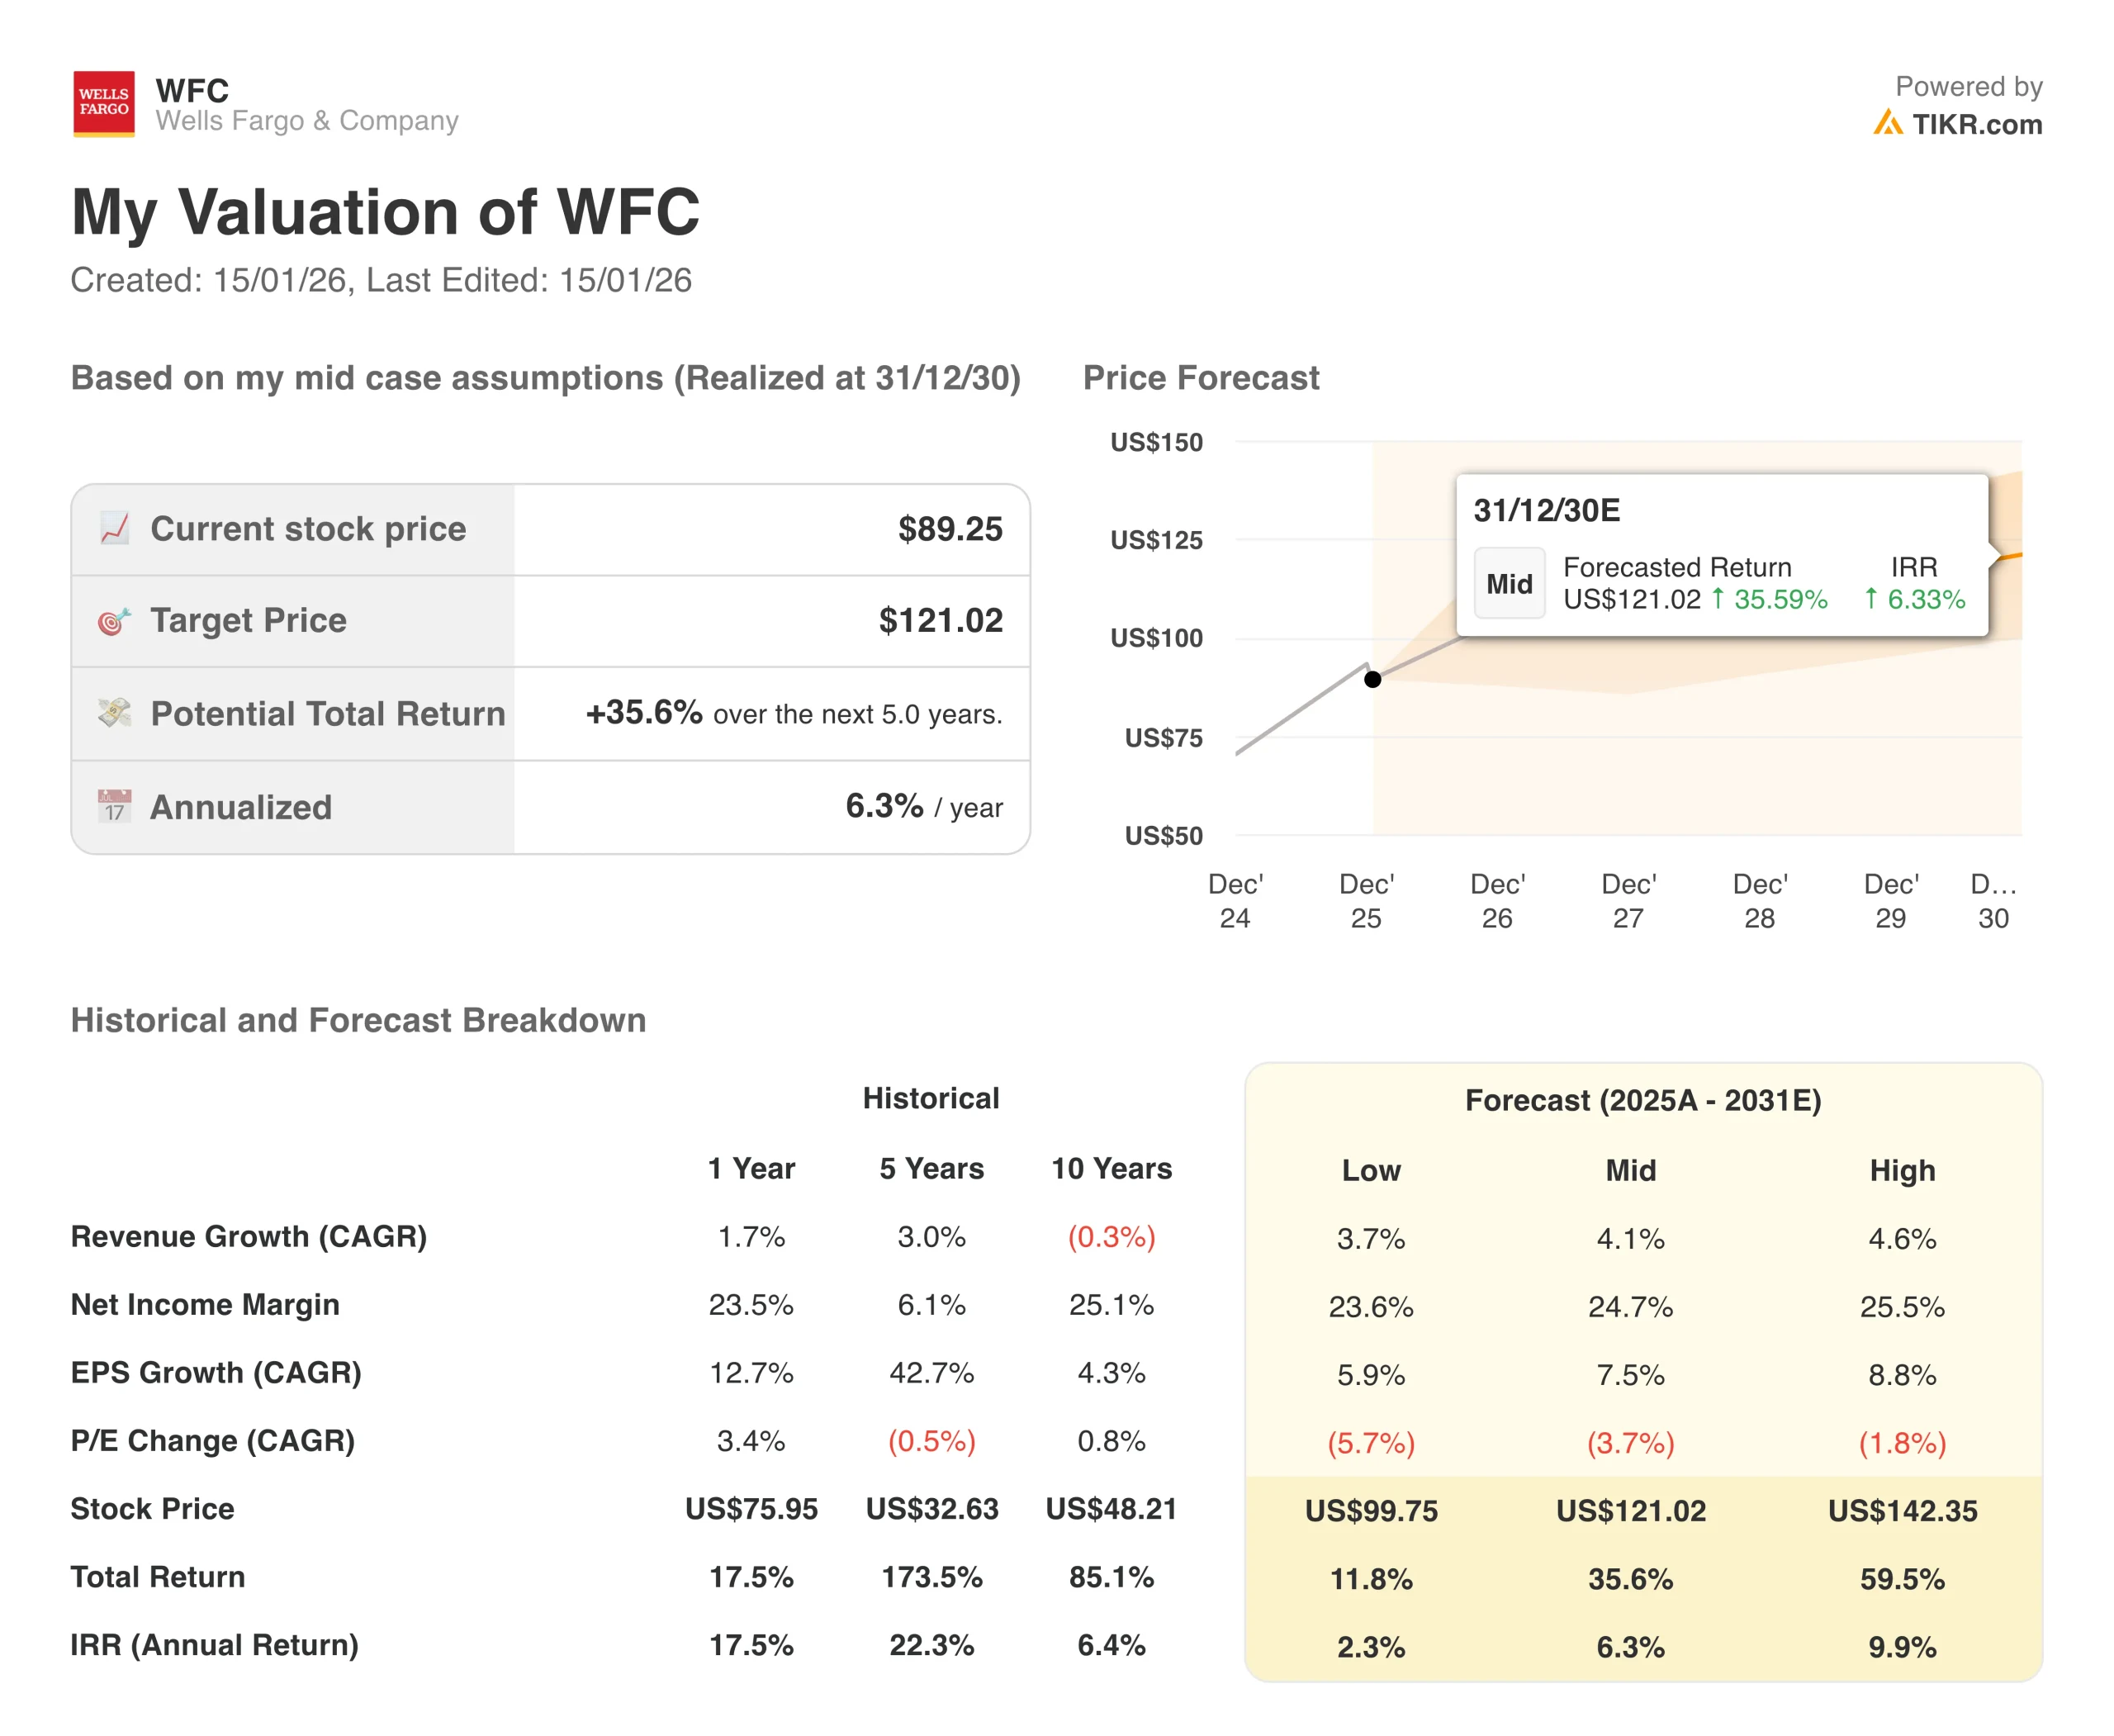
- $WFC Share Price as of Jan. 14: $89
- 52-Week High: $98
- $WFC Stock Price Target: $101
Now Live: Discover how much upside your favorite stocks could have using TIKR’s new Valuation Model (It’s free)>>>
What Happened?
Wells Fargo (WFC) stock dropped over 4% despite beating earnings expectations in the fourth quarter, as investors focused on a revenue miss that raised questions about the bank’s ability to accelerate growth now that the Federal Reserve’s asset cap has been lifted.
The San Francisco-based bank reported adjusted earnings of $1.76 per share, easily topping the $1.66 analyst estimate.
But revenue came in at $21.29 billion, missing the $21.64 billion consensus forecast. That shortfall overshadowed an otherwise solid quarter, with net income climbing to $5.4 billion.
CEO Charlie Scharf tried to put the best face on the results, saying:
“Strong financial performance, removal of the asset cap imposed by the Federal Reserve, termination of multiple consent orders, and stronger growth in both our consumer and commercial businesses make me proud of our 2025 results.”
The asset cap removal was a pivotal moment for Wells Fargo. The Fed imposed the restriction in 2018 following the fake accounts scandal, capping the bank’s assets at $1.95 trillion and preventing it from growing its balance sheet.
With that constraint now gone, Wells Fargo has been ramping up lending and trading activity to make up for lost time.
The numbers show some early success. Average loans jumped 5% year-over-year to $955.8 billion, the strongest quarterly growth since the first quarter of 2020.
Period-end loans surged 5% from the third quarter alone, driven by commercial and industrial lending, corporate investment banking, and growth in the commercial bank.

But the revenue miss tells a different story. Total revenue grew just 4% year-over-year, which doesn’t look impressive for a bank that’s supposed to be unleashing pent-up growth now that regulatory shackles are off.
Net interest income rose 4% to $12.33 billion, while noninterest income increased 5% to $8.96 billion. Those are solid numbers, but not the kind of explosive growth that would justify the hype around the asset cap removal.
Wells Fargo stock has been on a tear over the past few years, up 157% since the start of 2021. Investors bought into the turnaround narrative, betting that Scharf could clean up the bank’s compliance mess, slash costs, and position Wells Fargo for higher returns once regulators got out of the way.
The stock hit a 52-week high of $89 in December, reflecting peak optimism about what 2026 could bring.
But the fourth-quarter revenue miss is making investors nervous that the turnaround story might be more complicated than it looked.
See analysts’ growth forecasts and price targets for WFC stock (It’s free!) >>>
What the Market Is Telling Us About WFC Stock
Wells Fargo stock sold off because the revenue guidance for 2026 didn’t meet expectations, even though the underlying business showed some positive momentum.
CFO Mike Santomassimo laid out the bank’s outlook on the earnings call, projecting total net interest income of $50 billion for 2026, up from $47.5 billion in 2025.
That’s about 5% growth, which sounds decent until you realize that Wells Fargo is growing its balance sheet at a mid-single-digit clip and should be seeing bigger revenue gains.
The issue is net interest income excluding markets, which Santomassimo pegged at $48 billion for 2026 compared to $46.7 billion in 2025.
That’s only about 3% growth, and when you annualize the fourth quarter run rate and adjust for day count, it implies NII will be basically flat through most of the year.
The bank’s guidance assumes two to three rate cuts by the Fed in 2026, with the 10-year Treasury staying relatively stable. That creates a headwind to net interest income as lower rates compress margins, particularly on the commercial side, where Wells Fargo has a big variable-rate portfolio.
The offset is supposed to come from loan and deposit growth. Wells Fargo expects average loans to grow in the mid-single digits from Q4 2025 to Q4 2026, driven by commercial lending, auto lending, and credit cards.
Average deposits are also projected to grow at mid-single-digit rates, though the mix is shifting toward higher-cost interest-bearing deposits rather than free checking accounts.
Here’s the problem: Wells Fargo saw 5% sequential loan growth in the fourth quarter alone. If that pace slows to mid-single digits for the full year, it suggests the bank front-loaded growth in Q4 and could see a meaningful deceleration in 2026. That’s not what investors want to hear from a bank that just got its asset cap removed.
The other wrinkle is the markets business, which Wells Fargo is ramping aggressively. Markets NII is expected to grow to $2 billion in 2026 from a much smaller base, driven by lower short-term funding costs and increased client financing activities.
But Santomassimo warned that this NII growth will be partially offset by lower trading fees, so the net revenue contribution isn’t as big as it looks.
Wells Fargo stock is also facing questions about expense discipline.
- The bank guided to $55.7 billion in noninterest expenses for 2026, up from $54.8 billion in 2025.
- That’s about 1.6% growth, which sounds good until you factor in that Wells Fargo expects $2.4 billion in gross expense reductions from efficiency initiatives.
- Those savings are getting eaten up by $1.1 billion in incremental technology spending, $800 million in other investments, and another $800 million for merit increases and performance-based comp.
Wells Fargo also took $908 million in severance charges in the second half of 2025 to fund headcount reductions in 2026, but Santomassimo said the bank doesn’t expect significant additional severance next year.
The net result is that Wells Fargo is projecting only about $900 million in net expense growth for 2026, which gives it some operating leverage. But it’s not the kind of massive efficiency story that would drive a big step-up in profitability.
On the positive side, credit quality remains strong. Net charge-offs declined 13% year-over-year to $1.03 billion, and the net charge-off ratio dropped 10 basis points to 43 basis points of average loans. Commercial real estate losses ticked up modestly, mostly in the office portfolio, but Santomassimo said office valuations are stabilizing and future losses should be manageable.
Wells Fargo’s capital position is solid with a CET1 ratio of 10.6%, down from 11.1% a year ago but still well above the 8.5% regulatory minimum.
The bank returned $23 billion to shareholders in 2025, including $18 billion in stock buybacks. But Scharf warned that share repurchases will be lower in 2026 as Wells Fargo prioritizes organic loan growth.
Investors have gotten used to aggressive buybacks that have shrunk the share count by 26% over the past six years. If buybacks slow materially in 2026, it removes a key support for earnings-per-share growth.
The strategic outlook is unchanged. Wells Fargo is targeting a return on tangible common equity of 17% to 18% over the medium term, up from 15% in 2025. Scharf emphasized that 17% to 18% isn’t the final goal, just another milestone on the path to best-in-class returns.
But he refused to put a time frame on hitting that target, citing uncertainty around interest rates, credit conditions, and the regulatory environment.
That lack of specificity is frustrating for investors who want to know when the turnaround will translate into materially higher returns.
Estimate a company’s fair value instantly (Free with TIKR) >>>
How Much Upside Does Wells Fargo Stock Have From Here?
With TIKR’s new Valuation Model tool, you can estimate a stock’s potential share price in under a minute.
All it takes is three simple inputs:
- Revenue Growth
- Operating Margins
- Exit P/E Multiple
If you’re not sure what to enter, TIKR automatically fills in each input using analysts’ consensus estimates, giving you a quick, reliable starting point.
From there, TIKR calculates the potential share price and total returns under Bull, Base, and Bear scenarios so you can quickly see whether a stock looks undervalued or overvalued.
See a stock’s true value in under 60 seconds (Free with TIKR) >>>
Looking for New Opportunities?
- See what stocks billionaire investors are buying so you can follow the smart money.
- Analyze stocks in as little as 5 minutes with TIKR’s all-in-one, easy-to-use platform.
- The more rocks you overturn… the more opportunities you’ll uncover. Search 100K+ global stocks, global top investor holdings, and more with TIKR.
Disclaimer:
Please note that the articles on TIKR are not intended to serve as investment or financial advice from TIKR or our content team, nor are they recommendations to buy or sell any stocks. We create our content based on TIKR Terminal’s investment data and analysts’ estimates. Our analysis might not include recent company news or important updates. TIKR has no position in any stocks mentioned. Thank you for reading, and happy investing!