Key Takeaways:
- Price Target: Based on the valuation model, doValue shares could reach €5 by 2027, supported by stable servicing fees and normalized operating performance.
- Upside Potential: The €5 target represents roughly 54% total upside from the current price of €3, reflecting earnings normalization rather than aggressive growth assumptions.
- Return Profile: The model implies an annualized return of about 25% over the next 2 years, driven by margin recovery and modest multiple expansion.
- Earnings Support: Operating margins near 21% and revenue growth around 1% underpin the valuation, showing returns are supported by efficiency and cost discipline rather than top-line acceleration.
doValue S.p.A. (DOV) is a European credit servicing group managing non-performing and performing loans across Italy, Spain, Greece, and Cyprus, operating an asset-light model tied to recovery volumes rather than balance-sheet lending.
In December 2025, the company launched a fund focused on Italian state-guaranteed loans with €200 million in gross book value, expanding fee-based assets under management and increasing visibility of future servicing income.
For the first nine months of 2025, doValue generated about €365 million in net revenue, reflecting stable servicing volumes despite muted European credit formation, which matters because revenues are tied more to portfolio size than new loan origination.
DOVA’s net profit reached €12 million after removing non-recurring costs, while operating margins around 18% show strong cost control and the benefit of a largely fixed-cost servicing platform.
Despite improving profits and steady margins, the company’s roughly €500 million market value still reflects investor caution around European credit cycles, highlighting a gap between business performance and how the stock is currently priced.
What the Model Says for DOV Stock
We assessed doValue’s upside using conservative assumptions tied to stable servicing revenues, cost discipline, and a capital-light credit management model.
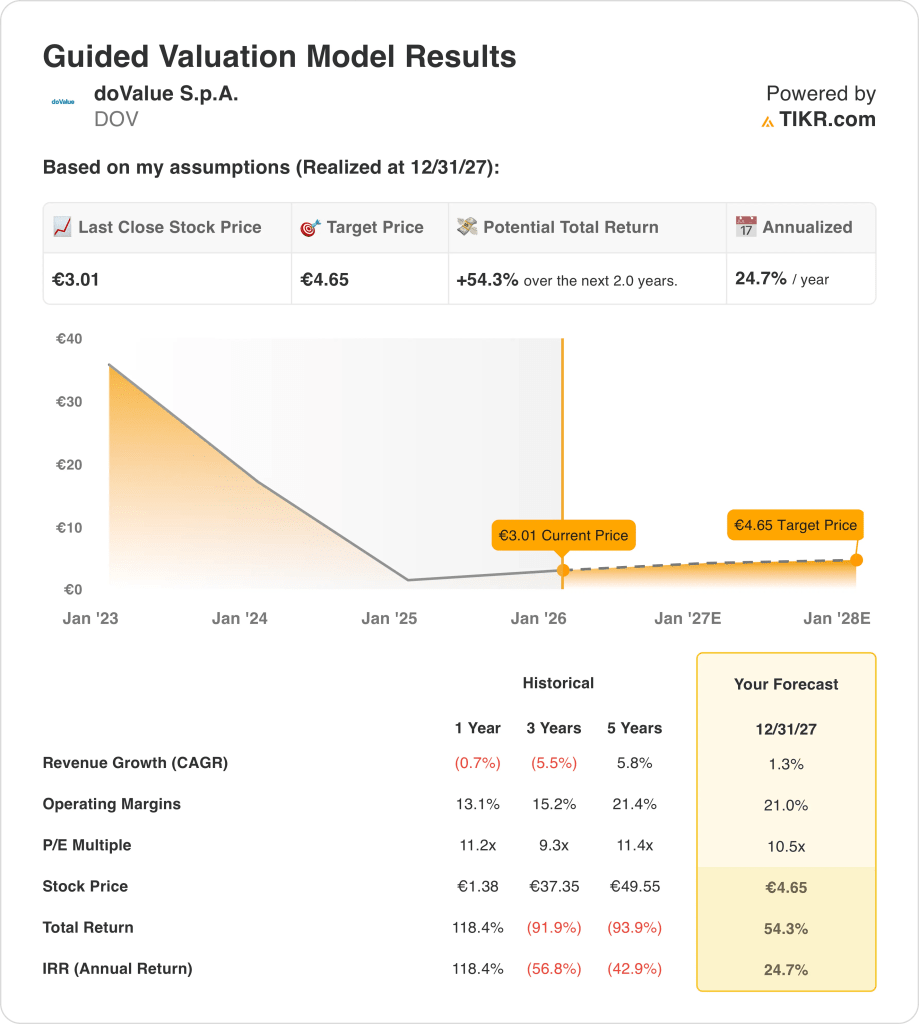
Using 1.3% revenue growth, 21.0% operating margins, and a 10.5x exit P/E, the model projects the stock rising from €3.01 to €4.65.
This implies a 54.3% total return, or 24.7% annualized returns, over the next 2.0 years with execution rather than multiple expansion.
Value any stock in 30 seconds with TIKR (It’s free) →
Our Valuation Assumptions
TIKR’s Valuation Model lets you plug in your own assumptions for a company’s revenue growth, operating margins, and P/E multiple, and calculates the stock’s expected returns.
Here’s what we used for DOV stock:
1. Revenue Growth: 1.3%
doValue’s revenue base has declined modestly in recent years, with LTM revenue around €480 million, reflecting portfolio runoff and muted European NPL formation across Italy, Spain, Greece, and Cyprus.
Recent performance shows stabilization, with 9M 2025 net revenue of roughly €365 million, supported by large servicing mandates and asset-light fees tied to €138 billion in managed assets.
Forward growth is limited by lower new NPL inflows but supported by UTP recoveries, state-guaranteed loan initiatives, and gradual expansion of capital-light fund and advisory activities.
From aggregated analyst forecasts, a 1.3% revenue growth assumption reflects stable portfolio economics tempered by structural runoff and a muted European credit origination backdrop.
2. Operating Margins: 21%
doValue has historically generated operating margins between roughly 13% and 21% which reflects a fixed-cost leverage inherent in large-scale loan servicing and recovery operations.
Recent margins improved as cost controls offset lower revenue, with LTM operating margins near 18% and EBITDA margins above 35%, highlighting efficiency gains despite soft top-line trends.
Normalization toward 21.0% assumes stable servicing volumes, limited incremental hiring, and continued discipline in SG&A and technology spending as portfolios mature.
Across surveyed analyst expectations, operating margins of roughly 21.0% represent normalized efficiency and operating leverage without relying on elevated recovery cycles or accelerated growth.
3. Exit P/E Multiple: 10.5x
doValue currently trades near 11x earnings, broadly consistent with its historical valuation range between roughly 9x and 12x during periods of stable profitability.
Investor caution persists due to European credit cyclicality, earnings volatility, and limited organic growth, despite improving margins and recurring servicing revenues.
For re-rating to occur, the company must sustain normalized profits, maintain capital-light expansion, and avoid renewed cost pressure or sharp portfolio runoff.
Under pooled market forecasts, a 10.5× exit multiple captures balanced expectations for earnings durability and cash generation while accounting for limited growth visibility and constrained re-rating potential.
See analysts’ 5-year forecasts for doValue with TIKR (It’s free) →
What Happens If Things Go Better or Worse?
doValue’s outcomes depend on portfolio inflows, recovery efficiency, and cost discipline across European credit cycles, setting up a range of plausible execution paths through 2029.
- Low Case: If portfolio runoff persists and recovery activity remains muted, revenue grows around 9.2%, net income margins hold near 14.3%, valuation stays cautious, and returns rely mainly on earnings normalization → 20.1% annualized return.
- Mid Case: With servicing volumes stable and cost discipline sustained, revenue growth near 10.1%, net income margins improving toward 15.3%, and valuation remaining steady support balanced earnings expansion → 29.9% annualized return.
- High Case: If recoveries accelerate and capital-light initiatives scale effectively, revenue reaches about 11.1%, net income margins approach 16.0%, and valuation pressure eases, allowing stronger price appreciation → 39.6% annualized return.
Execution on recoveries, portfolio mix, and operating efficiency matters more than macro optimism, as returns are driven by how consistently earnings convert across cycles.

The high-case target price of €11.34 becomes achievable if earnings growth accelerates and margins expand toward the upper end of expectations, without requiring aggressive multiple expansion or speculative valuation assumptions.
How Much Upside Does doValue Have From Here?
With TIKR’s new Valuation Model tool, you can estimate a stock’s potential share price in under a minute.
All it takes is three simple inputs:
- Revenue Growth
- Operating Margins
- Exit P/E multiple
If you’re not sure what to enter, TIKR automatically fills in each input using analysts’ consensus estimates, giving you a quick, reliable starting point.
From there, TIKR calculates the potential share price and total returns under Bull, Base, and Bear scenarios so you can quickly see whether a stock looks undervalued or overvalued.
Value any stock in under a minute with TIKR for free →
Looking for New Opportunities?
- See what stocks billionaire investors are buying so you can follow the smart money.
- Analyze stocks in as little as 5 minutes with TIKR’s all-in-one, easy-to-use platform.
- The more rocks you overturn… the more opportunities you’ll uncover. Search 100K+ global stocks, global top investor holdings, and more with TIKR.
Disclaimer:
Please note that the articles on TIKR are not intended to serve as investment or financial advice from TIKR or our content team, nor are they recommendations to buy or sell any stocks. We create our content based on TIKR Terminal’s investment data and analysts’ estimates. Our analysis might not include recent company news or important updates. TIKR has no position in any stocks mentioned. Thank you for reading, and happy investing!