

A lot of investors think more complicated means more accurate. So they build huge spreadsheets with tons of tabs and formulas. But most of the time, they end up spending more time fixing cells and formatting rows than actually thinking about the business.
Valuation does not need to be complicated. It really comes down to three things. How the business has performed in the past. How fast you think it can grow in the future. And what is a fair price to pay for that growth. If you get those three things right, the math is simple.
TIKR does the data work for you, so you do not need a spreadsheet at all. With clean data and simple visuals, you can build a solid valuation in just a few minutes instead of a few hours. Here is how to do it inside the platform.
TIKR’s Valuation Model

Estimate a stock’s fair value instantly (Free with TIKR) >>>
TIKR’s Valuation Model is built around three simple inputs.
First, you estimate how fast the company’s revenues will grow.
Second, you decide what operating margins the business can reach over time.
Third, you choose what multiple the stock should trade at in the future.
That’s it.
As you can see in the image below, TIKR walks you through these three inputs step by step.
For each input, the platform shows you the company’s historical track record, so you can anchor your assumptions in reality instead of guessing.
If you are not sure what to use, you can even select analysts’ consensus estimate by clicking “I don’t know.”

Accurately value a stock in under 30 seconds (Free with TIKR) >>>
TIKR’s Valuation Model makes it easy to value practically any stock.
However, this simplistic valuation approach isn’t going to be the best way to value every stock.
In this article, we’ll break down how you can value any company by yourself.
No quick hacks, no magic tools. This is the operating system running inside the minds of practically every great investor.
Even if you’d rather use a simple stock valuation tool like TIKR’s Valuation Model, it still helps to understand why this kind of model works and how to think about business valuation.
Step 1: Identify the Correct Valuation Metric

Every business has a specific metric that best reflects its economic reality. You can use the TIKR Financials tab, which standardizes data across years, to identify the right driver. Look for the metric that tracks closely alongside share price, sales, or other key metrics over time. If a company has volatile earnings but consistent free cash flow, base your model on cash flow. Choosing the stable metric reduces noise in your valuation.
Step 2: Establish a Historical Baseline Multiple

Context is critical for determining a fair price, so paying 25x earnings might be expensive for a bank but cheap for a high-quality compounder. You need to know what the market has historically been willing to pay for this specific business.
Navigate to the TIKR Valuation tab and view the chart for your chosen metric, such as P/E or EV/EBITDA. Expand the view to 5 or 10 years to see the full cycle. Identify the average multiple over that period. This historical average serves as your baseline for a “fair” valuation, assuming the business quality hasn’t deteriorated.
Step 3: Determine Consensus Growth Expectations

Valuation is inherently forward-looking. You need a realistic estimate of the company’s future earnings to justify today’s price. Instead of guessing, you can use the market consensus as a starting point.
The TIKR Estimates tab aggregates projections from Wall Street analysts. Review the consensus numbers for the next two to three years and check the trend of these estimates. If analysts are consistently revising their numbers down, the business may be facing headwinds that the historical multiple does not capture. Use these forward estimates as the growth input for your model.
Track company financials, stock value, and competitor information with TIKR (It’s free) >>>
Step 4: Calculate the Implied Returns
Once you have the forward estimate and the historical multiple, the math is straightforward. Multiply the expected future metric (e.g., Next Twelve Months EPS) by your baseline multiple. This gives you a target share price based on fundamentals.
Compare this implied price to the current trading price. If your calculated price is significantly higher than the stock’s current price, the stock may be undervalued. If it is lower, the market is pricing in growth that the data does not yet support. This simple equation filters out market noise and focuses on value.
Step 5: Stress Test with Peer Comparison
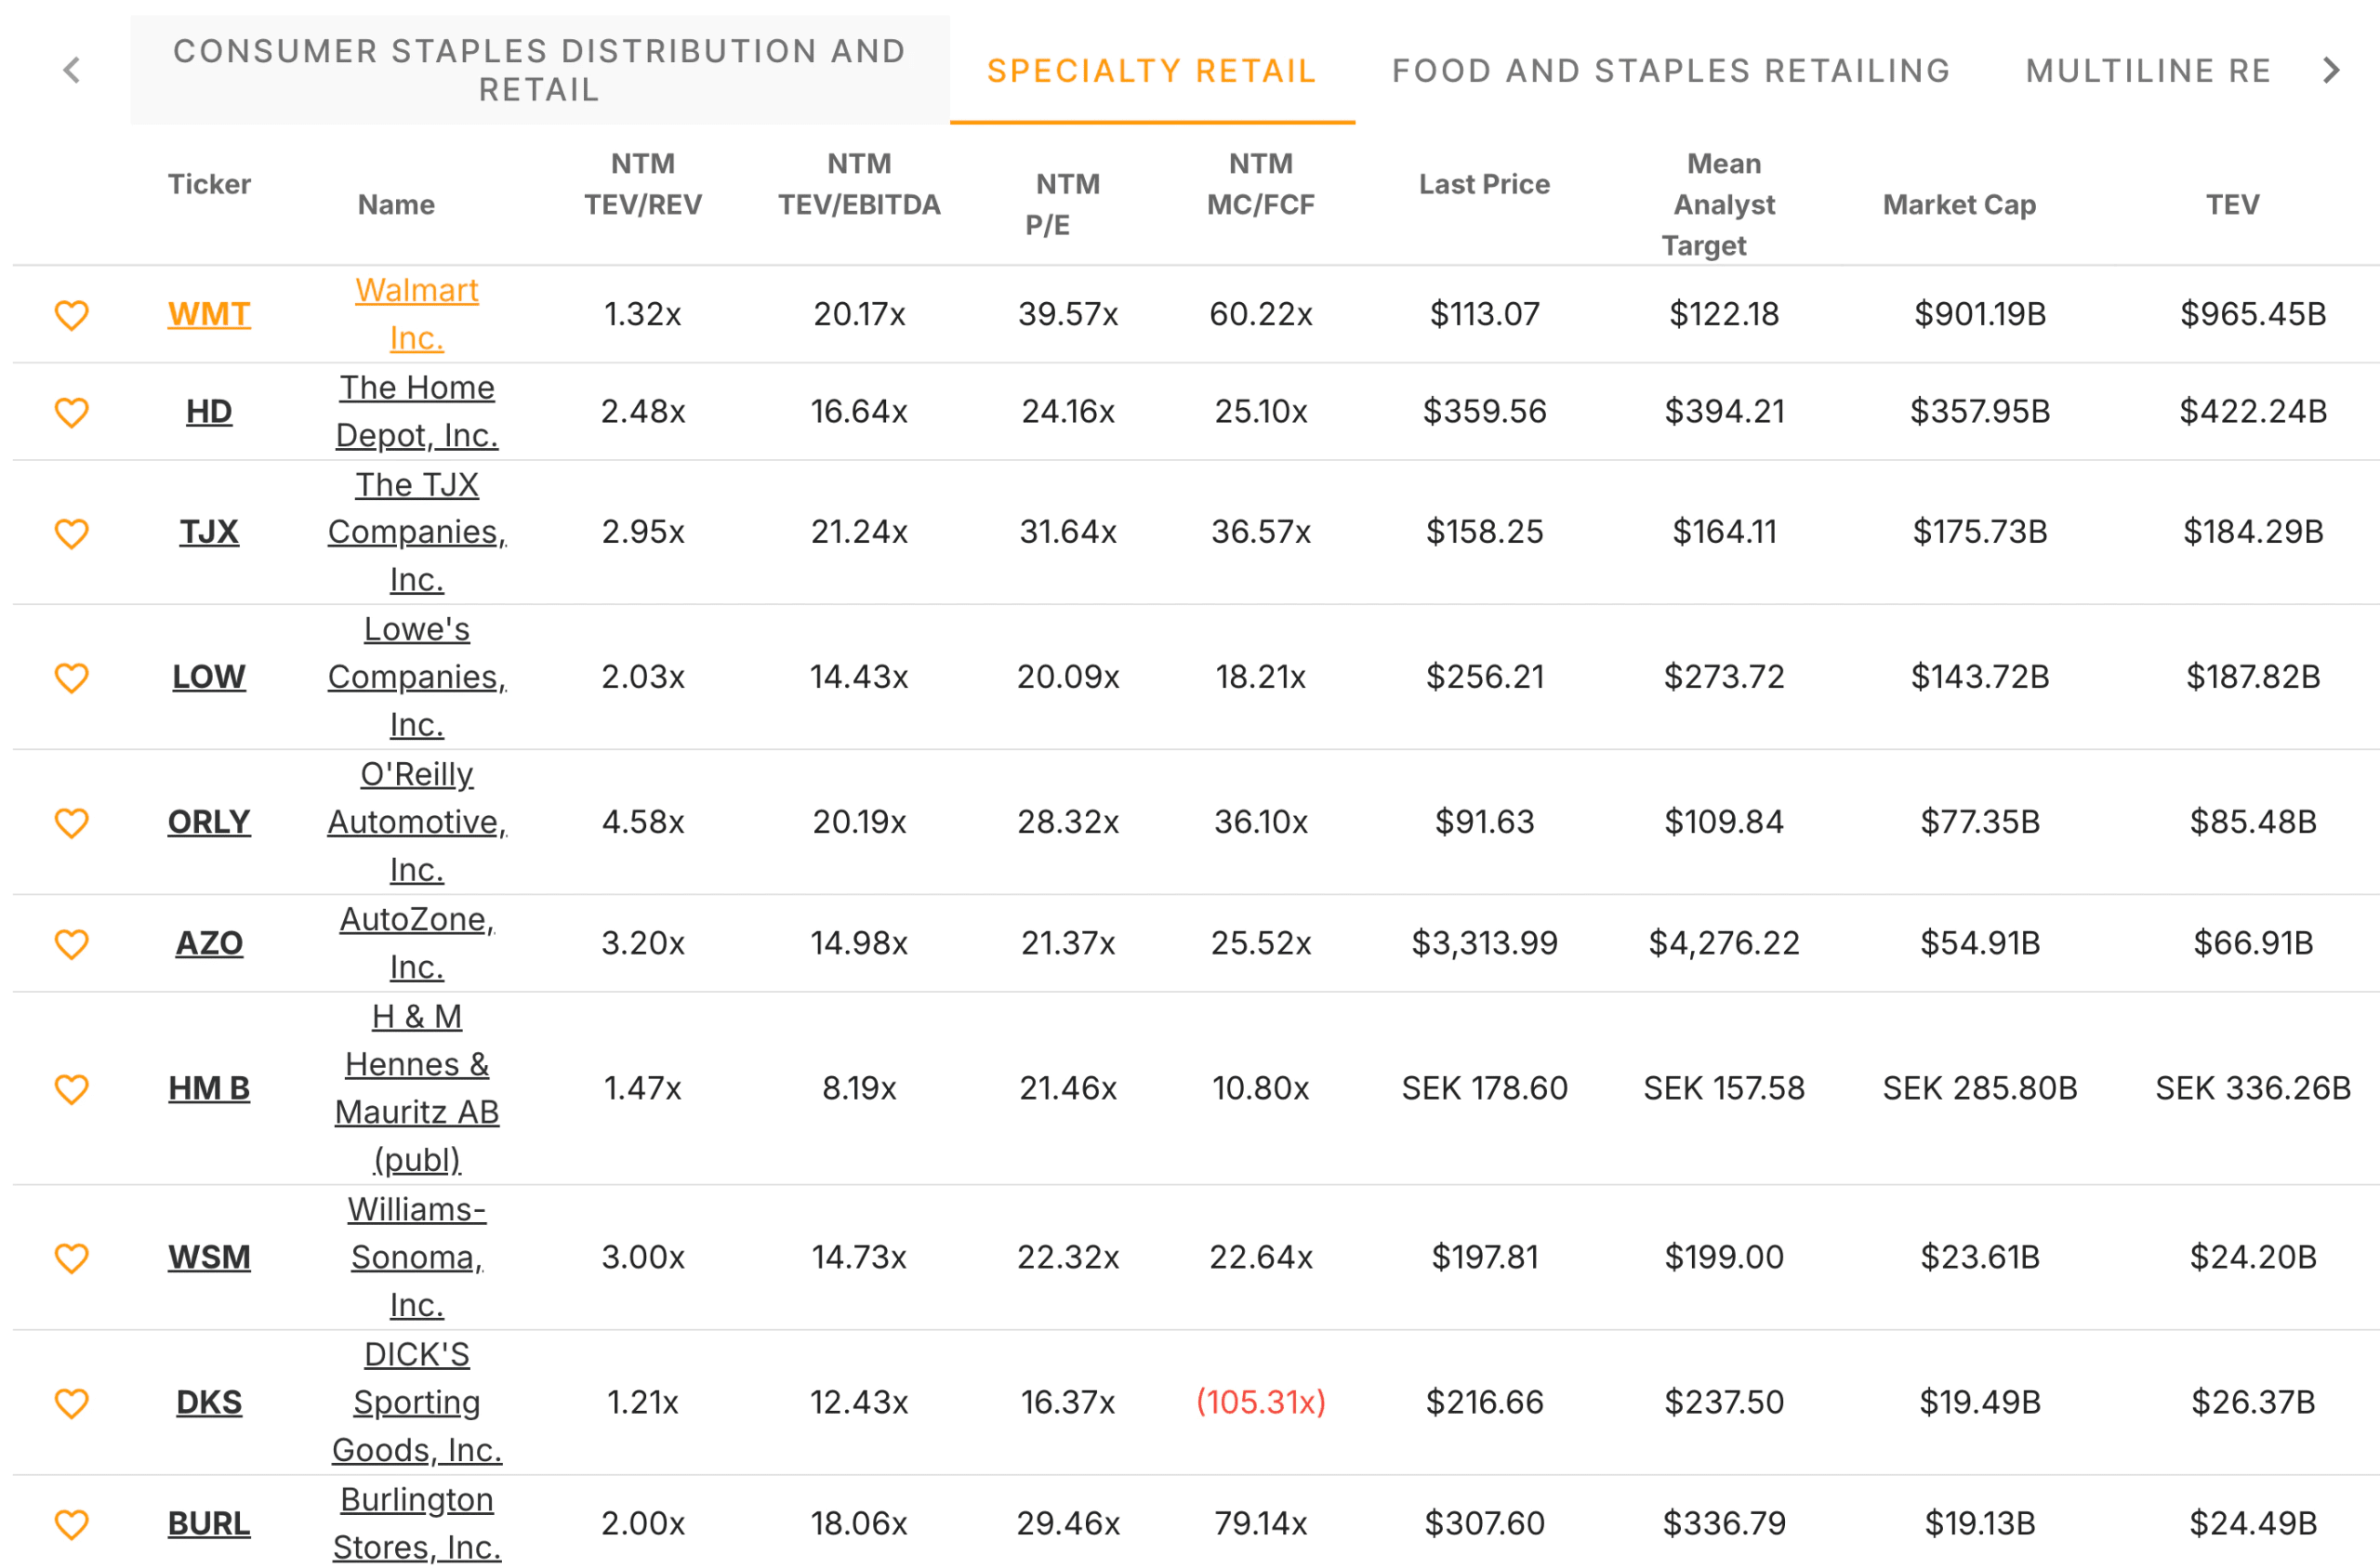
A valuation does not exist in a vacuum. A stock trading at 15x earnings isn’t attractive if a superior competitor trades at 12x. Relative valuation helps you avoid value traps where a stock is cheap for a valid reason.
Use the TIKR Competitors tab to benchmark your target company against its industry. Compare valuation multiples alongside growth rates and margins. If your company trades at a discount, verify that its margins are comparable. If it trades at a premium, ensure the growth rate justifies the higher price.
Common Mistakes to Avoid
A frequent mistake is relying on a single year of data. Cyclical companies often look cheapest at the top of a cycle when earnings are abnormally high. If you apply a standard multiple to peak earnings, you will overpay. Always look at the long-term trend in the Financials tab to ensure the current year isn’t an outlier.
Another error is ignoring the balance sheet. A simple P/E ratio does not account for debt. A company might look cheap on an earnings basis but have significant leverage that increases risk. Reviewing the Enterprise Value (EV) metrics for TIKR provides a clearer view of the total cost to acquire the business, including its debt load.
How Investors Can Apply This In Practice
Consider an investor analyzing a global beverage company. They would first check the Financials tab to confirm that EPS and Free Cash Flow have grown consistently over the last decade. Next, they would see on the Valuation chart that the stock typically trades between 20x and 25x earnings.
They would then pull the EPS estimate for two years out from the Estimates tab. By multiplying that future EPS by the conservative end of the historical multiple range (20x), they derive a price target. Finally, they check the Peers tab to ensure this valuation aligns with other major consumer staples. If the current price provides a margin of safety relative to that target, the investor has a data-driven thesis rather than speculation.
TIKR Takeaway
You do not need Excel to be a disciplined investor, but you do need accurate data and a consistent process. By using the TIKR platform to anchor your assumptions in historical data and consensus estimates, you can build a robust valuation model that focuses on the business’s long-term durability.
How to Accurately Value a Stock in Under 30 Seconds
All it takes to value a stock with TIKR is three simple inputs:
- Revenue Growth
- Operating Margins
- Exit P/E Multiple
If you’re not sure what assumptions to use, TIKR automatically fills in each input using analysts’ consensus estimates, giving you a quick, reliable starting point.
From there, TIKR calculates the potential share price and total returns under Bull, Base, and Bear scenarios so you can quickly see whether a stock looks undervalued or overvalued.
See a stock’s true value in under 60 seconds (Free with TIKR) >>>
Looking for New Opportunities?
- Discover which stocks billionaire investors are purchasing, so you can follow the smart money.
- Analyze stocks in as little as 5 minutes with TIKR’s all-in-one, easy-to-use platform.
- The more rocks you overturn… the more opportunities you’ll uncover. Search 100K+ global stocks, global top investor holdings, and more with TIKR.
Disclaimer:
Please note that the articles on TIKR are not intended to serve as investment or financial advice from TIKR or our content team, nor are they recommendations to buy or sell any stocks. We create our content based on TIKR Terminal’s investment data and analysts’ estimates. Our analysis might not include recent company news or important updates. TIKR has no position in any stocks mentioned. Thank you for reading, and happy investing!


