
Key Takeaways:
- Scale Profile: Lululemon generated about $11 billion in revenue and $2 billion in operating profit, confirming durable global demand and strong brand monetization.
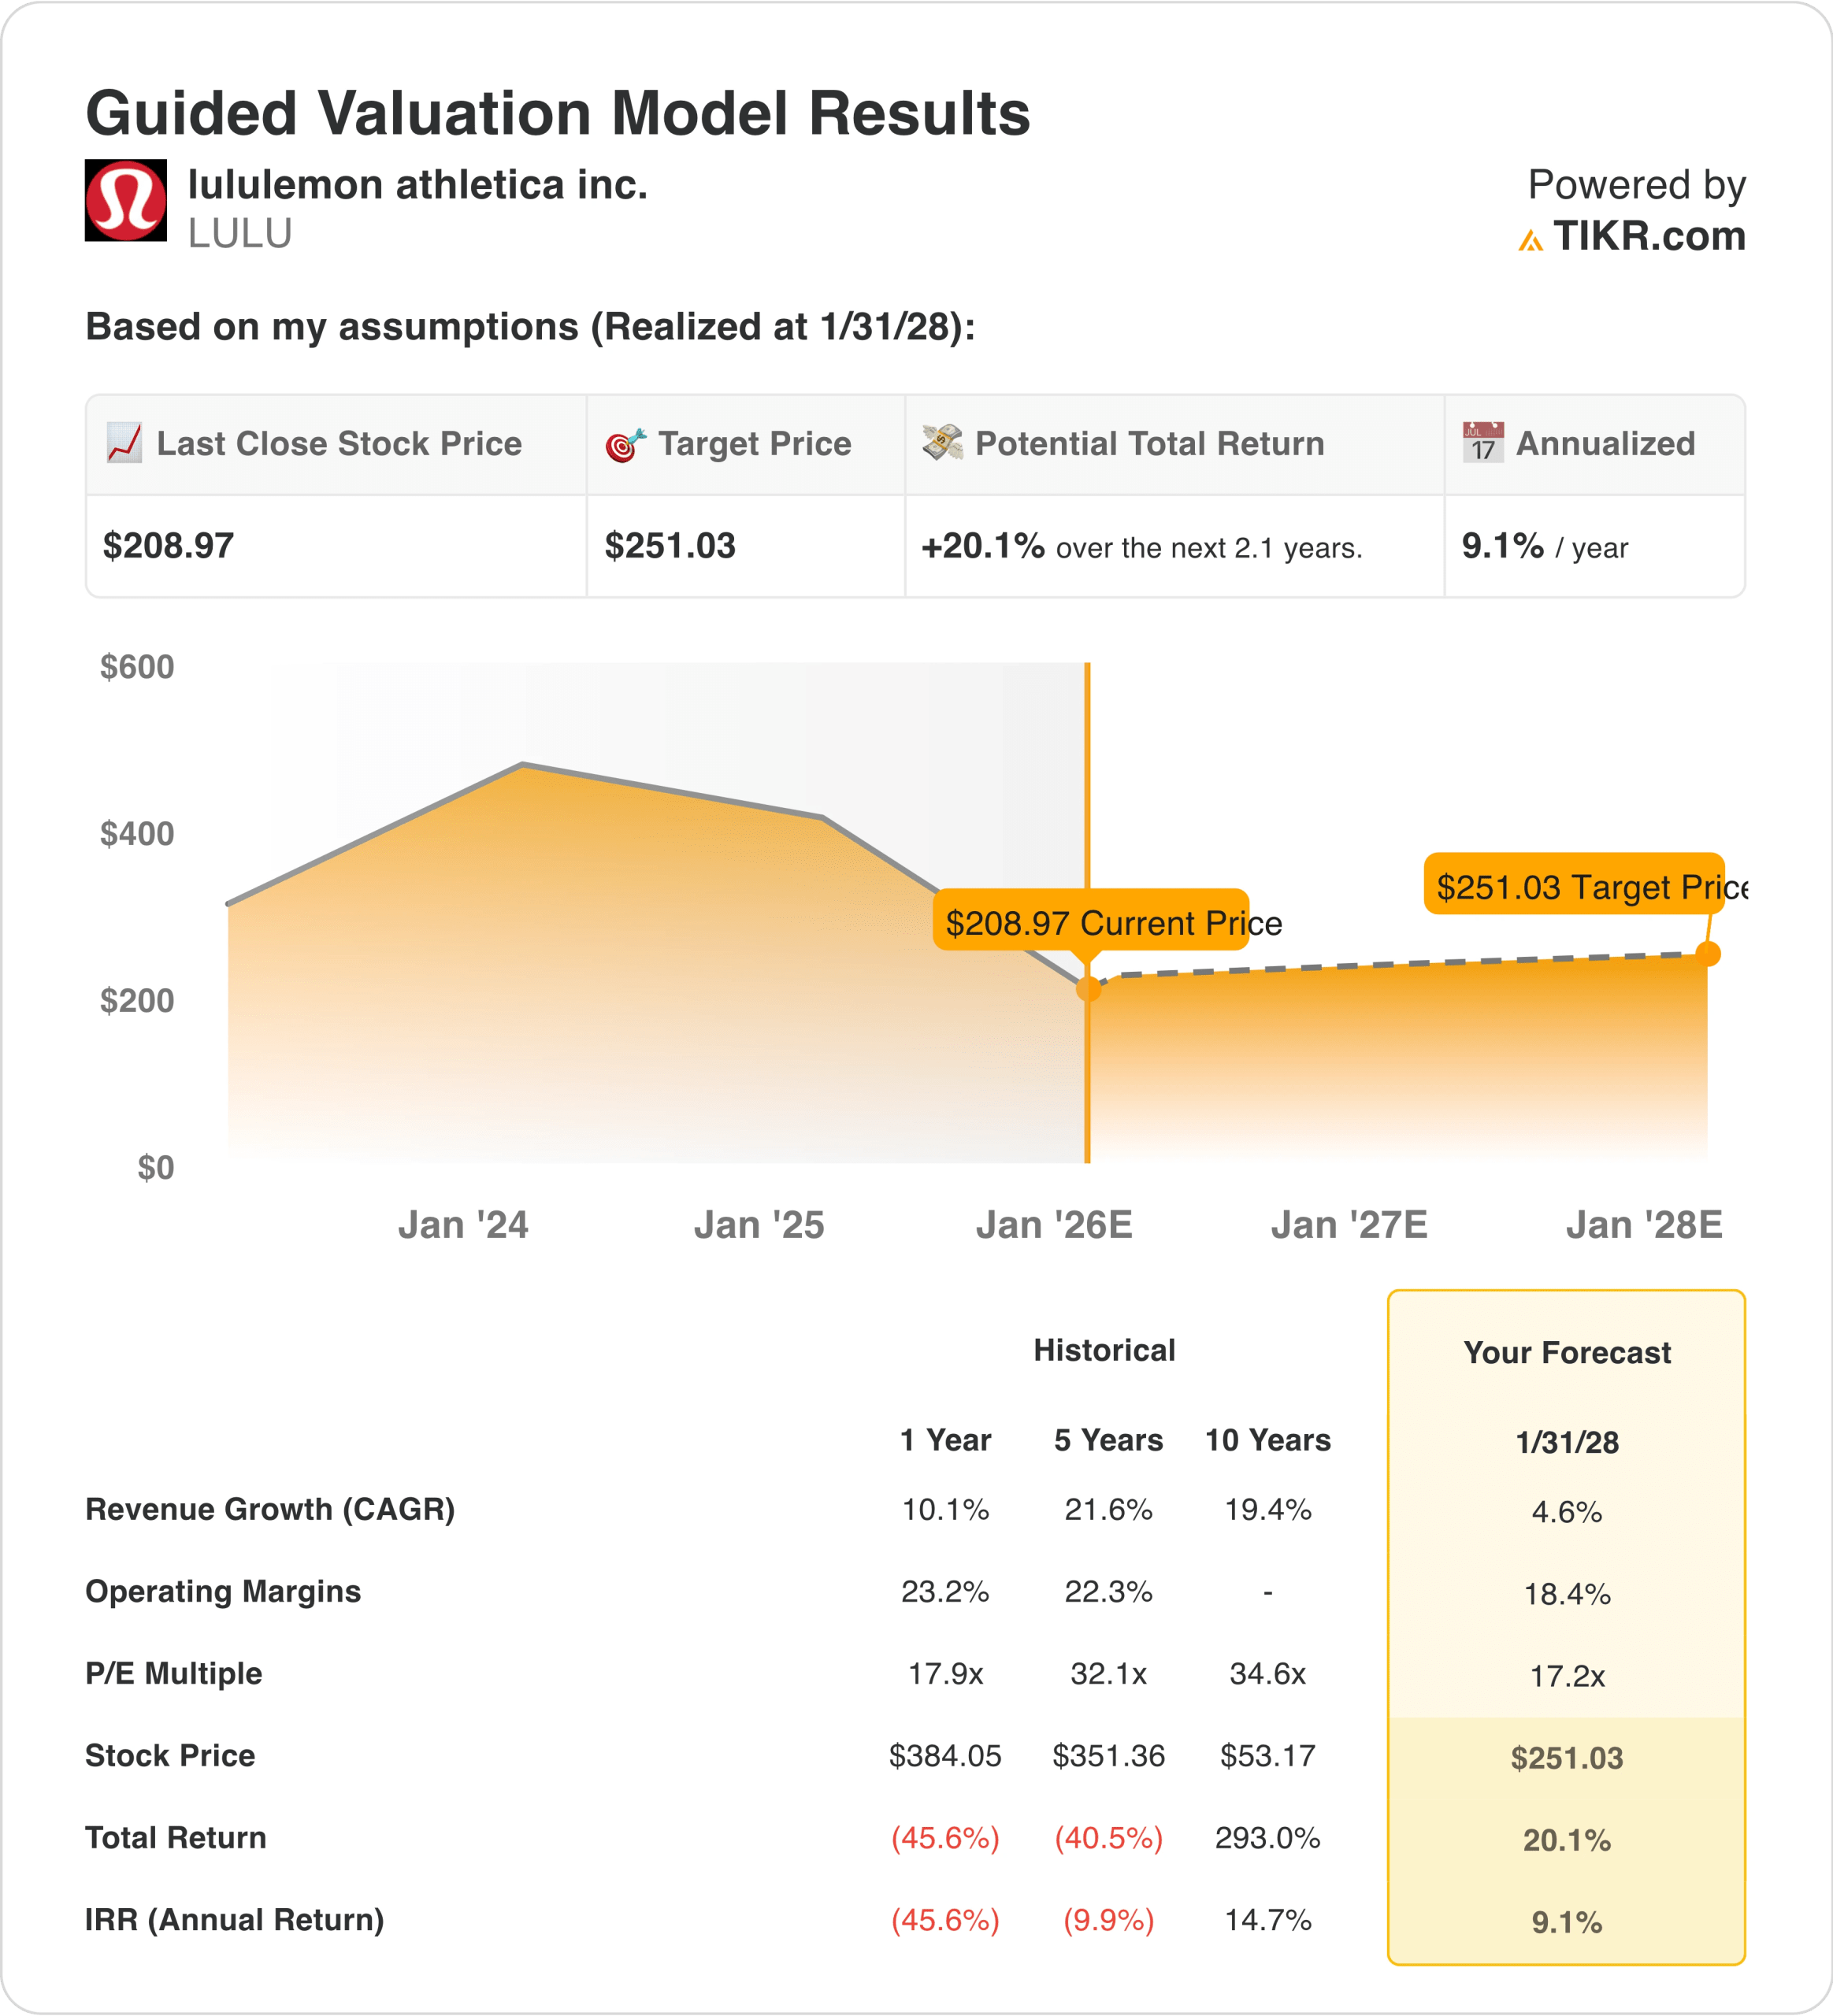
- Price Projection: Based on normalized growth and margins, the stock could reach $251 from $209 by January 2028 under conservative valuation assumptions.
- Potential Gains: This target represents a 20% total return from the current $209 share price, reflecting earnings growth rather than valuation expansion.
- Annual Return: The model implies roughly 9% annualized returns over the next 2 years, tied to operating discipline and brand resilience.
Lululemon Athletica (LULU) operates a premium athletic apparel platform built around direct-to-consumer distribution, high-margin product categories, and a brand that remains culturally relevant across fitness, lifestyle, and wellness trends.
In December 2025, the company announced a CEO transition effective January 2026, a leadership change that matters as Lululemon manages growth normalization amid tighter consumer spending and higher operating scrutiny.
Revenue reached roughly $11 billion in 2024 while operating profit totaled about $2 billion, showing that scale remains meaningful even as top-line growth slows from prior peak years.
Operating margins settled near low-20% in 2022-25, down from cycle highs, with future profitability increasingly tied to cost control, inventory discipline, and pricing decisions.
With a market capitalization near $26 billion, future revenue growth is expected to come from international expansion and men’s apparel, while profitability depends on direct sales mix and controlled promotions.
Despite stable earnings and cash generation, the stock trades near 17x forward earnings, raising the question of whether the market views Lululemon as a steady brand compounder or a fully matured apparel business.
What the Model Says for LULU Stock
We analyzed Lululemon using assumptions that reflect brand stability, global expansion, and disciplined cost control in a more selective consumer environment.
Based on 5% annual revenue growth, 18% operating margins, and a 17x exit multiple, the model estimates the stock could rise from $209 to $251.
That outcome implies a 20% total return, or about 9% annually, by January 2028, ending at a $251 target price.
Our Valuation Assumptions
TIKR’s Valuation Model lets you plug in your own assumptions for a company’s revenue growth, operating margins, and P/E multiple, and calculates the stock’s expected returns.
Here’s what we used for LULU stock:
1. Revenue Growth: 4.6%
Lululemon delivered double-digit growth through most of the past decade as brand penetration expanded rapidly across North America and early international markets.
Recent revenue growth has slowed meaningfully, with trailing growth moderating as U.S. demand normalized and discretionary spending tightened.
Trailing twelve-month revenue of roughly $11.1 billion reflects a business operating at scale, with expansion continuing but at a moderated rate.
International markets continue to grow faster than North America, but their smaller base limits overall consolidated growth acceleration.
Product innovation and men’s category expansion support ongoing growth, though neither offsets broader category maturation.
Competitive intensity and promotional activity could increasingly constrain pricing-led volume expansion
In line with analyst consensus projections, a 4.6% growth outlook reflects steady execution supported by brand loyalty, tempered by category maturity and slower consumer demand growth.
2. Operating Margins: 18.4%
Lululemon’s operating margins peaked above 22% during the post-pandemic demand surge, driven by strong full-price selling and limited discounting.
Margins have since normalized, with recent operating margins settling between 22–23% as freight, promotions, and wage costs increased.
The direct-to-consumer model continues to support structurally higher margins compared with wholesale-driven apparel peers.
Ongoing investment in international expansion, leadership transition costs, and product development limit near-term margin upside.
Supply chain normalization provides partial cost relief but does not fully eliminate potential promotional pressure.
Low-20s to high-teens profitability represents a sustainable level
Historically, the company has been able to sustain margins in the low-20s even outside peak demand periods.
Based on consensus market estimates, 18.4% margins assume sustained brand pricing power while accounting for normalized demand and ongoing reinvestment needs.
3. Exit P/E Multiple: 17.2x
Lululemon currently trades near 17× forward earnings, well below its historical premium multiples during periods of faster growth.
Prior-cycle valuations exceeded 25× when revenue growth and margin expansion were both accelerating simultaneously.
Investor sentiment has shifted toward valuation discipline as discretionary growth slowed across global apparel.
The company’s balance sheet strength and consistent cash generation continue to justify a premium to traditional apparel peers.
Leadership transition introduces execution uncertainty that limits near-term multiple expansion.
Sustained high-teens to low-20s margins and stable growth are required to maintain current valuation levels.
According to aggregated analyst estimates, a 17.2× exit multiple reflects brand quality and cash generation while recognizing slower growth and limited re-rating appetite.
What Happens If Things Go Better or Worse?
Consumer demand and brand pricing cycles can shift quickly in global apparel. Here is how Lululemon stock could perform under different execution outcomes through 2028:
- Low Case: If revenue contracts 4.1% annually with net income margins fall toward 12% → 0.8% per year.
- Mid Case: With revenue flat near 4.5% growth and net income margins stabilizing around 12.8% → 6.2% annually.
- High Case: If revenue resumes modest growth and peak at 5% with net income margins recover above 13% → approach 10.9%.
Lululemon has moved into a steadier operating phase where execution discipline matters more than rapid growth.

Under stable demand and controlled margins, the path toward the $251 price target depends on earnings durability rather than valuation expansion.
How Much Upside Does LULU Have From Here?
With TIKR’s new Valuation Model tool, you can estimate a stock’s potential share price in under a minute.
All it takes is three simple inputs:
- Revenue Growth
- Operating Margins
- Exit P/E multiple
If you’re not sure what to enter, TIKR automatically fills in each input using analysts’ consensus estimates, giving you a quick, reliable starting point.
From there, TIKR calculates the potential share price and total returns under Bull, Base, and Bear scenarios so you can quickly see whether a stock looks undervalued or overvalued.
Build your own valuation model for lululemon with TIKR (It’s free) →
Looking for New Opportunities?
- See what stocks billionaire investors are buying so you can follow the smart money.
- Analyze stocks in as little as 5 minutes with TIKR’s all-in-one, easy-to-use platform.
- The more rocks you overturn… the more opportunities you’ll uncover. Search 100K+ global stocks, global top investor holdings, and more with TIKR.
Disclaimer:
Please note that the articles on TIKR are not intended to serve as investment or financial advice from TIKR or our content team, nor are they recommendations to buy or sell any stocks. We create our content based on TIKR Terminal’s investment data and analysts’ estimates. Our analysis might not include recent company news or important updates. TIKR has no position in any stocks mentioned. Thank you for reading, and happy investing!