

Key Stats for Costco Stock
- Price Change for Costco stock: 3.70%
- $COST Share Price as of Jan. 8: $915
- 52-Week High: $1,078
- $COST Share Price Target: $1,032
Now Live: Discover how much upside your favorite stocks could have using TIKR’s new Valuation Model (It’s free)>>>
What Happened?
Costco (COST) stock jumped on Thursday after the warehouse giant reported December sales numbers that crushed Wall Street’s expectations.
Shares finished the day up more than 3.5% after climbing as much as 5.6% earlier in the session, reaching levels not seen in about a month.
The retailer’s net sales surged 8.5% year-over-year to $29.86 billion for the five weeks ended January 4.
More importantly, comparable sales grew 6.2% companywide when excluding gas prices and foreign exchange impacts. That number came in well above analyst expectations, which ranged from just 3% to 5% growth.
Costco’s online business was strong, with digitally-enabled sales jumping 18.3%. Customer traffic also showed healthy growth, up 2.7% worldwide and 2.4% in the U.S., proving that shoppers aren’t just buying more per trip—they’re also visiting more frequently.
The sales breakdown showed strength across the board. Food categories like bakery, meat, and candy performed well, while non-food items, including jewelry, tires, and small appliances, also posted solid gains.
Geographically, the Midwest, Northwest, and Southeast regions led the U.S., while Australia, Japan, and Korea stood out internationally.
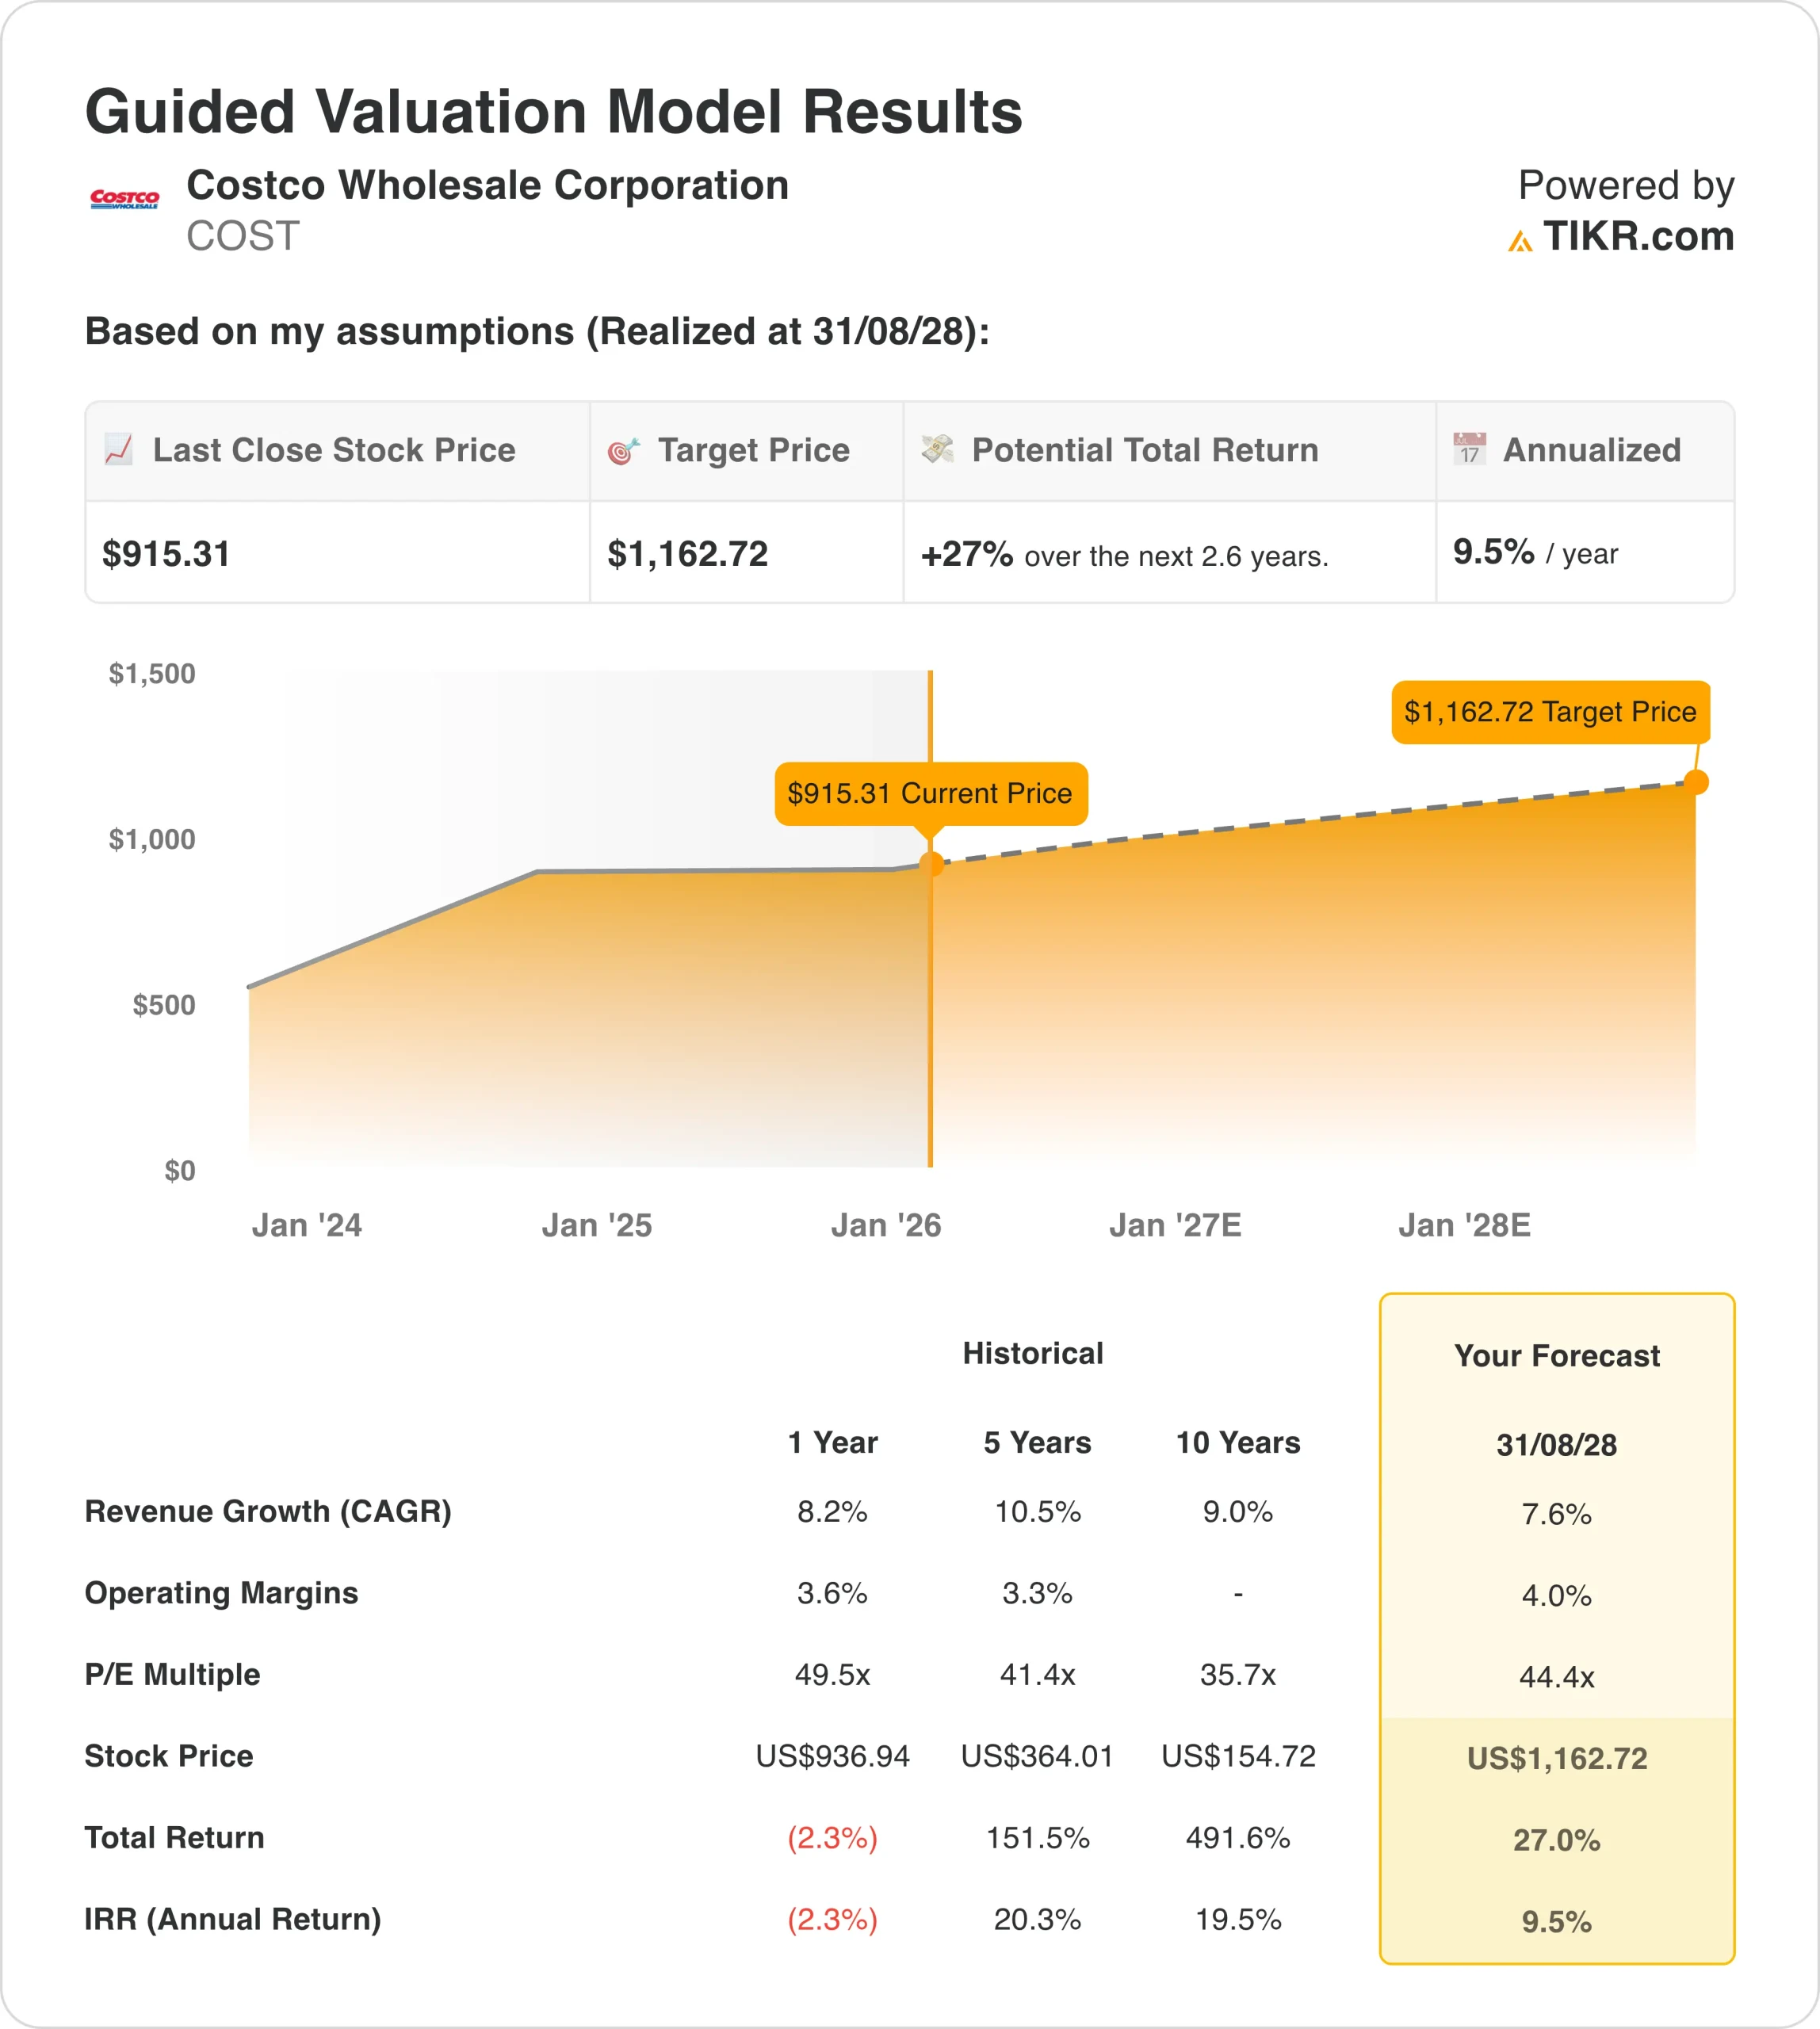
Costco stock has returned over 600% in the last 10 years. Despite its outsized returns, the big-box retailer might deliver annual returns of 9.5% over the next two years, according to our valuation model.
See analysts’ growth forecasts and price targets for Costco stock (It’s free!) >>>
What the Market Is Telling Us About Costco Stock
The strong reaction in Costco stock reflects relief among investors who had grown concerned about the company’s elevated valuation.
Shares had dropped roughly 10% over the past six months as some analysts questioned whether the premium multiple was justified, especially amid a broader rotation out of retail stocks.
UBS analysts noted that many investors expected slower same-store sales growth, so the 6.2% comparable sales figure “slightly exceeded even the high-end market bar.” William Blair’s analysts called the results a “much-needed boost” and maintained their bullish stance on the shares.
Costco’s winning formula remains simple but effective: leverage massive scale to offer quality products at rock-bottom prices.
In an environment where cash-strapped consumers are hunting for deals, this strategy is clearly resonating. The company’s membership model drives repeat traffic and creates a reliable profit stream that’s hard for competitors to replicate.
Looking ahead, most Wall Street analysts remain optimistic about Costco stock. The consensus price target of around $1,035 suggests about 17% upside from recent levels, though that still falls short of the all-time highs near $1,080 hit earlier in 2025.
Some investors are also speculating about potential catalysts, such as a stock split—which hasn’t happened in decades—or another special dividend similar to the one issued in early 2024.
With today’s rally bringing Costco stock back to breakeven for the past 12 months, the company has demonstrated that strong execution and steady traffic growth can still move the needle, even for a retail giant valued at over $400 billion.
Estimate a company’s fair value instantly (Free with TIKR) >>>
How Much Upside Does Costco Stock Have From Here?
With TIKR’s new Valuation Model tool, you can estimate a stock’s potential share price in under a minute.
All it takes is three simple inputs:
- Revenue Growth
- Operating Margins
- Exit P/E Multiple
If you’re not sure what to enter, TIKR automatically fills in each input using analysts’ consensus estimates, giving you a quick, reliable starting point.
From there, TIKR calculates the potential share price and total returns under Bull, Base, and Bear scenarios so you can quickly see whether a stock looks undervalued or overvalued.
See a stock’s true value in under 60 seconds (Free with TIKR) >>>
Looking for New Opportunities?
- See what stocks billionaire investors are buying so you can follow the smart money.
- Analyze stocks in as little as 5 minutes with TIKR’s all-in-one, easy-to-use platform.
- The more rocks you overturn… the more opportunities you’ll uncover. Search 100K+ global stocks, global top investor holdings, and more with TIKR.
Disclaimer:
Please note that the articles on TIKR are not intended to serve as investment or financial advice from TIKR or our content team, nor are they recommendations to buy or sell any stocks. We create our content based on TIKR Terminal’s investment data and analysts’ estimates. Our analysis might not include recent company news or important updates. TIKR has no position in any stocks mentioned. Thank you for reading, and happy investing!


