Cadence Design Systems, Inc. (NASDAQ: CDNS) is a leading provider of electronic design automation software used by semiconductor and system companies worldwide. Shares recently traded around $306 per share, giving the company a market value of roughly $84.5 billion.
Once primarily known for core EDA tools, Cadence has expanded into system design, IP, and advanced verification software, positioning the company as a critical supplier as chip complexity and AI workloads continue to rise.
Looking at who owns Cadence and how insiders have traded helps show how large institutions and company leadership appear to be positioning around the stock today.
Who Are Cadence’s Top Shareholders?

Cadence’s shareholder base is led by major asset managers and long-only institutions. These firms tend to hold through market cycles, which can help support long term ownership stability. At the same time, activity among active managers shows a mix of confidence and selectivity.
- The Vanguard Group: 26,797,602 shares (9.84%), ~$8.32B value. Added 324,805 shares (+1.23%).
- BlackRock Institutional Trust Company: 15,729,743 shares (5.78%), ~$4.88B value. Cut 134,445 shares (-0.85%).
- State Street Investment Management: 12,468,162 shares (4.58%), ~$3.87B value. Added 149,577 shares (+1.21%).
- Fidelity Management & Research: 8,985,870 shares (3.30%), ~$2.79B value. Added 1,124,861 shares (+14.31%).
- Jennison Associates: 8,731,648 shares (3.21%), ~$2.71B value. Cut 606,454 shares (-6.49%).
- Geode Capital Management: 7,535,120 shares (2.77%), ~$2.34B value. Added 1,171,386 shares (+18.41%).
- Invesco Capital Management (QQQ Trust): 6,107,549 shares (2.24%), ~$1.90B value. Added 394,979 shares (+6.91%).
- MFS Investment Management: 5,142,149 shares (1.89%), ~$1.60B value. Added 704,222 shares (+15.87%).
- AllianceBernstein: 4,618,332 shares (1.70%), ~$1.43B value. Cut 302,484 shares (-6.15%).
- BlackRock Investment Management (UK): 3,990,974 shares (1.47%), ~$1.24B value. Cut 72,235 shares (-1.78%).
- Norges Bank Investment Management: 3,863,761 shares (1.42%), ~$1.20B value. Cut 30,963 shares (-0.79%).
Vanguard, BlackRock, and State Street continue to form a stable ownership base, while meaningful additions from Fidelity, Geode, and MFS suggest some active managers remain constructive on Cadence’s long term earnings profile even as others trim exposure, for investors.
Hedge Fund Highlights
Balyasny Asset Management LP, founded by Dmitry Balyasny, increased its Cadence position by 128% last quarter, lifting its stake to roughly $9.5M value. The size of the increase suggests the firm may be leaning more positively on Cadence’s exposure to advanced semiconductor design and AI driven workloads.
Magnetar Financial, led by founder Alec Litowitz, boosted its Cadence holdings by 664%, adding close to 18,800 shares to reach a position worth about $7.6M value. While still modest in absolute terms, the sharp increase stands out.
Winton Group, founded by David Harding, raised its Cadence stake by 185%, now holding approximately $6.6M value. The move appears to reflect confidence in the durability of Cadence’s software-driven revenue model.
D. E. Shaw, founded by David Shaw, expanded its position by 183%, bringing its Cadence stake to roughly $2.7M value. Though smaller in size, the percentage increase suggests a notable shift in positioning.
These moves show that several hedge funds appear to be selectively building exposure rather than exiting, even as valuation considerations remain in focus, for investors.
Track the top shareholders of over 50,000 global stocks (It’s free) >>>
Cadence’s Recent Insider Trades
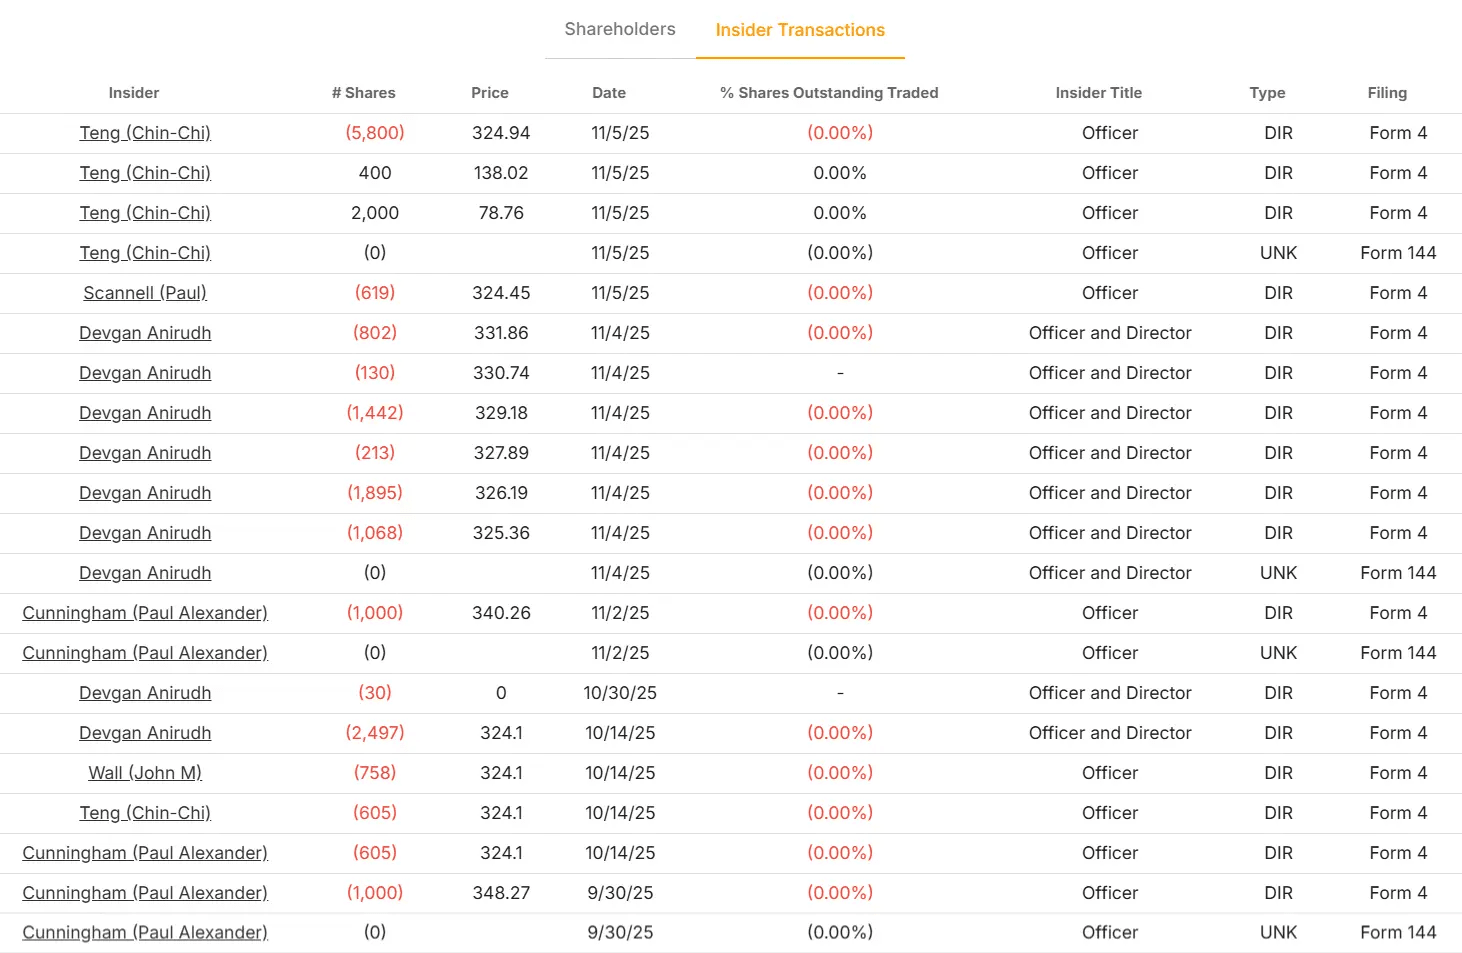
Insider trades can offer useful context on how executives and directors may be managing personal exposure to the stock. Recent filings for Cadence show multiple small transactions that lean toward selling.
- Chin-Chi Teng (Officer): Sold ~$1.9M across multiple trades around $325; also recorded zero-share entries that appear administrative.
- Paul Scannell (Officer): Sold ~$200K at ~$324.
- Anirudh Devgan (Officer and Director): Sold ~$5.3M across several transactions between ~$324 and ~$332.
- Paul Alexander Cunningham (Officer): Sold ~$688K across two trades at ~$340 and ~$348.
- John M. Wall (Officer): Sold ~$246K at ~$324.
These transactions are small relative to Cadence’s overall ownership base and do not materially change control. It appears insiders are trimming modest amounts at higher price levels rather than making large directional statements, for investors.
See recent insider trade data for over 50,000 global stocks (It’s free) >>>
What the Ownership & Insider Trade Data Tell Us
Cadence remains firmly held by large institutions, with passive managers providing a stable base and active managers adjusting exposure around valuation and growth expectations. Hedge fund activity points to selective accumulation rather than broad risk taking.
Insider activity appears measured, with mostly small sales and limited buying, which may reflect personal portfolio management rather than a shift in business outlook.
Taken together, the data suggests Cadence continues to be viewed as a high quality, long term compounder in semiconductor design software, even as institutions and insiders appear thoughtful about position sizing at current price levels, for investors.
Value Any Stock in Under 60 Seconds (It’s Free)
With TIKR’s new Valuation Model tool, you can estimate a stock’s potential share price in under a minute.
All it takes is three simple inputs:
- Revenue Growth
- Operating Margins
- Exit P/E Multiple
From there, TIKR calculates the potential share price and total returns under Bull, Base, and Bear scenarios so you can quickly see whether a stock looks undervalued or overvalued.
If you’re not sure what to enter, TIKR automatically fills in each input using analysts’ consensus estimates, giving you a quick, reliable starting point.
See a stock’s true value in under 60 seconds (Free with TIKR) >>>