

Most investors evaluate a company’s performance by starting with the same two numbers: revenue growth and earnings growth. They’re easy to find and simple to compare, but they rarely tell the whole story.
However, professional analysts go much deeper. They track dozens of indicators to get a deeper understanding of how a business works and how the company might perform in the future. These metrics help to reveal a business’s long-term compounding potential years before the market catches on.
Two companies can grow revenue at the same pace and post similar earnings, yet one compounds for a decade while the other stagnates. The difference often comes down to the details hiding below the surface, like how efficiently a company runs, how intelligently it reinvests, and how resilient it is through cycles.
Most tools only scratch the surface. TIKR helps you go deeper by giving you up to 5 years of analyst forecasts, decades of historical data, and the full financial picture across more than 100,000 global companies. You can see what professionals see and use those insights to make higher-quality decisions.
In this article, we will break down eight forward-looking metrics that help you evaluate business quality, growth potential, and risk, along with exactly where to find each one inside TIKR.

See detailed Analyst Estimates on over 100,000 global stocks on TIKR (It’s free) >>>
Business Quality
1. Margin Trends (Gross Margin + EBITDA Margin)

Where: TIKR > Estimates > Actuals & Forward Estimates
Margins are one of the clearest indicators of a company’s competitive position. They show whether a business is scaling efficiently or losing its edge.
Gross margin reveals pricing power: the profit remaining after direct costs. EBITDA margin adds a second layer, showing how well management controls operating expenses. When both expand together, it often signals strong demand and cost discipline. When they fall, it can mean inflation, pricing pressure, or declining efficiency.
Alphabet’s gross margin is projected to stay around 58% through 2028, while EBITDA margin rises from 34% to 36%. That stability shows analysts expect its investments in AI and cloud infrastructure to improve efficiency rather than dilute profitability.
Analysts pay close attention to margin forecasts because they reflect expectations about a company’s underlying strength. A rising margin profile can drive higher long-term earnings and valuation multiples, while a shrinking one can signal strategic challenges ahead.
In TIKR, you can view both metrics together to see how profitability is expected to evolve over time.
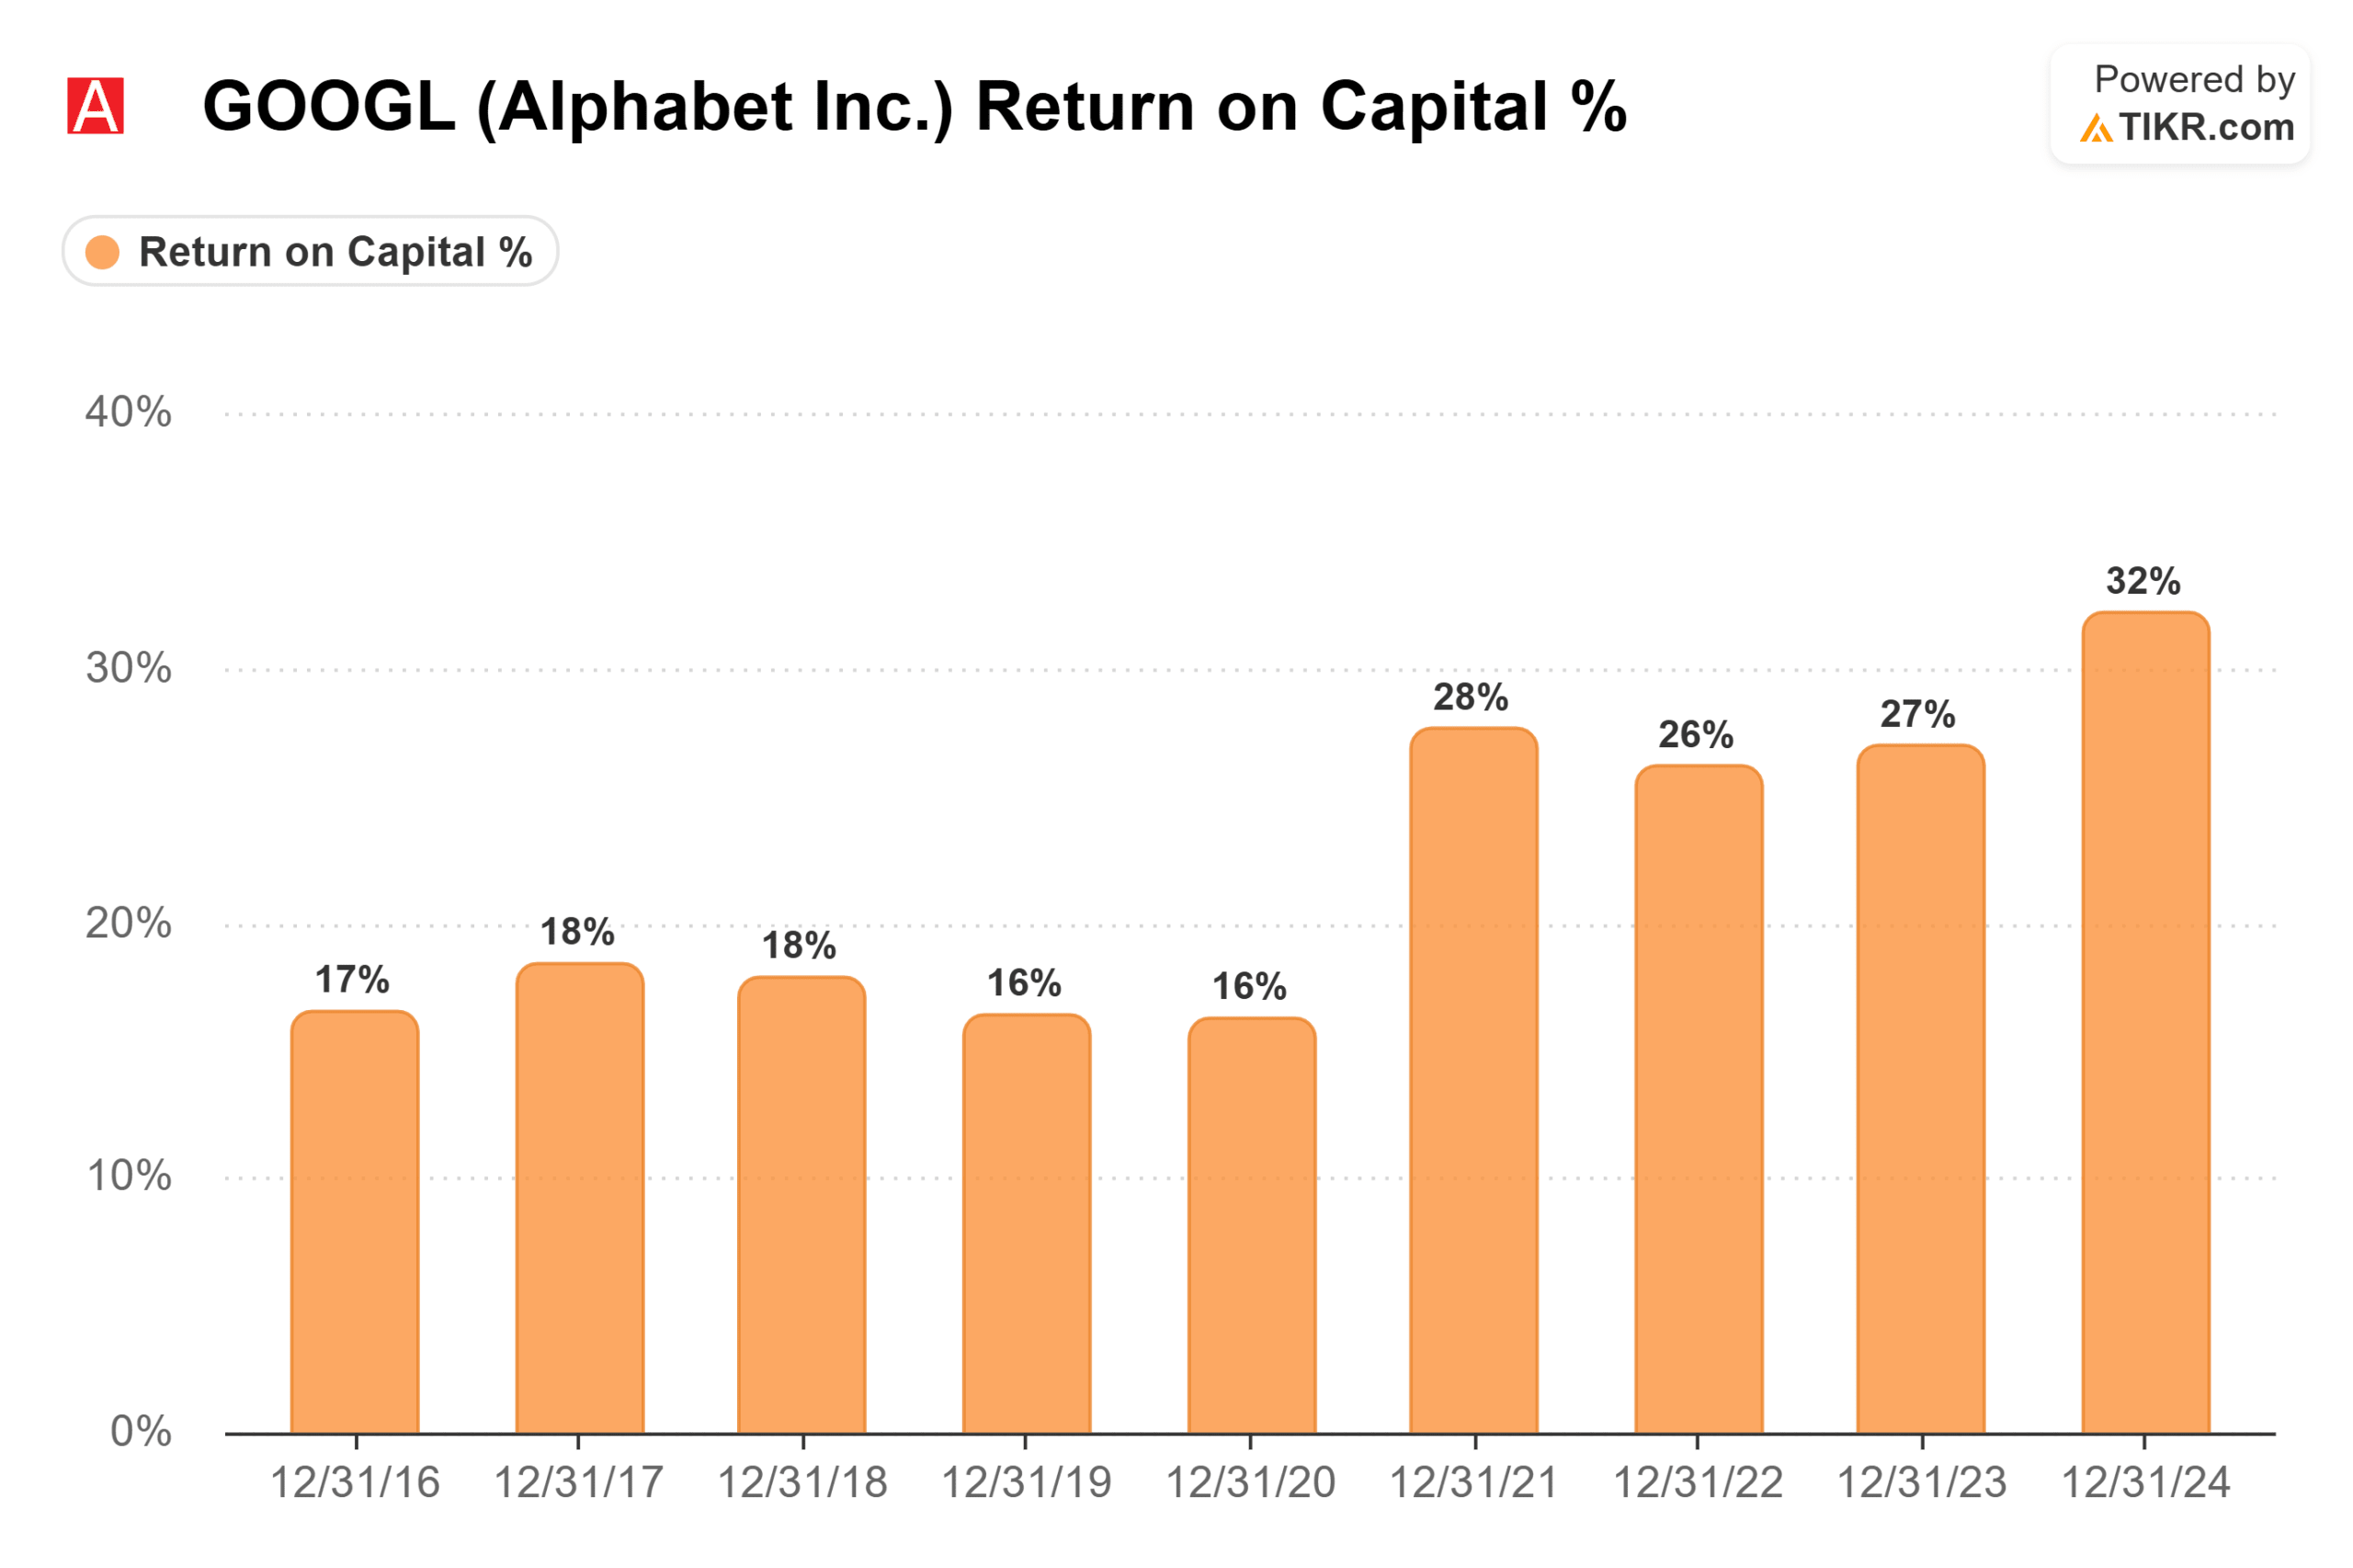
2. Return on Invested Capital (ROIC)
Where: TIKR > Financials > Ratios
If margins tell you how profitable a company is, ROIC tells you how efficiently it creates that profit.
Return on Invested Capital measures how well management uses its capital resources, which are debt and equity, to generate returns. High and stable ROIC typically signals a company with a durable competitive advantage, strong pricing power, or an efficient reinvestment strategy.
Alphabet’s ROIC has recently notched up to over 30%, which is excellent for a business. Alphabet’s consistency in seeing over 15% returns on capital signals disciplined capital allocation and meaningful competitive advantages within the business, even amid record infrastructure spending.
Analysts also compare ROIC to the company’s Weighted Average Cost of Capital (WACC) to determine whether the comapny is creating or destroying value. If a company’s return on capital consistently exceeds its cost of capital, the company can go on to become a true compounder and potentially deliver multi-bagger returns for investors.
In TIKR, you’ll want to watch for upward trends or stable readings well above the company’s cost of capital.
Value any stock in under 60 seconds with TIKR’s new Valuation Model tool (It’s free) >>>
Growth Rates
3. Revenue Growth (Historical + Projected CAGR)

Where: TIKR > Estimates > Actuals & Forward Estimates
Revenue growth tells you how fast the business is expanding, but how growth is trending is just as important as the year-over-year or quarterly growth number.
As an example, analysts’ estimate that Alphabet’s revenue will grow at about 11-14% annually through 2030. That steady growth rate reflects a mature but still expanding business driven by Search, YouTube, and Google Cloud.
Tracking both historical and forward Compound Annual Growth Rates (CAGR) helps investors spot inflection points. A consistent 5–10% annual growth rate for a mature business often signals sustainable expansion, while flat or negative revenue growth can signal market saturation or tougher competition.
Analysts’ revenue forecasts provide insight into whether they expect growth to accelerate or normalize, and whether the market might be over- or underestimating the company’s trajectory.
4. EPS Growth (Historical + Projected CAGR)

Where: TIKR > Estimates > Actuals & Forward Estimates
Earnings per share (EPS) growth blends together revenue growth, margins, and capital allocation into one clear measure of a company’s performance. EPS growth is very important for a company’s long-term success because it directly drives a stock’s long-term value, and investors are willing to pay more for companies that can grow per-share profits predictably.
Analysts expect Alphabet’s EPS to rise from $8.04 in 2024 to $17.23 in 2029. When EPS grows faster than revenue, it often reflects share buybacks or operating leverage from improving profit margins. Analysts expect Alphabet to see increasing profit margins going forward, which is why EPS growth is expected to outpace revenue growth.
When EPS growth lags revenue growth, it can mean that the business is seeing cost pressure or dilution.
In TIKR, you can see both historical and current EPS data, helping you see whether analysts expect a company’s profitability to accelerate or plateau.
Track company financials, analyst estimates, and competitor information with TIKR (It’s free) >>>
5. Share Count Trend

Where: TIKR > Financials > Balance Sheet > Supplementary Data
Companies that repurchase shares increase the value of each remaining share, which lifts EPS over time. Companies that regularly issue new shares for compensation or acquisitions can do the opposite and dilute existing shareholders.
Alphabet’s diluted share count is expected to fall from 12.2 billion in 2024 as the company continues to buy back stock. That steady reduction in shares acts as a long-term tailwind for EPS growth and compounding.
Tracking share count alongside EPS forecasts helps you see whether a company’s earnings growth comes from real operational improvement or from financial engineering.
Risks
6. NTM P/E vs. 5-Year Average

Where: TIKR > Valuation > Multiples
Valuation context is everything.
A company’s Next-Twelve-Month (NTM) P/E ratio compared with its five-year average helps investors see whether a stock is trading at a discount or a premium relative to its own history.
It is a useful starting point for understanding market expectations.
A lower-than-average multiple with stable fundamentals may indicate that the stock is undervalued. A multiple that’s well above a stock’s 5-year average might suggest the market is pricing in near-perfect execution.
As an example, Alphabet trades near at about 26.7x forward earnings, which is slightly above its five-year average of around 22.8x.
Even if the company delivers on expected growth, the stock could re-rate lower if the market returns to a more typical multiple in the future, which could negatively impact future returns.
7. Net Debt / EBITDA

Where: TIKR > Estimates > Actuals & Forward Estimates > Balance Sheet Supp. Data
The Net Debt to EBITDA ratio shows how many years it would take a company to pay off its total debt using Earnings Before Interest, Taxes, Depreciation & Amortization.
Alphabet has a negative Net Debt/EBITDA ratio because Alphabet has more cash on hand than total debt. This results in a negative net debt and a negative ratio.
It’s best for a company to have a low Net Debt/EBITDA ratio below 3x, because this means that the company has a stronger balance sheet and more optionality. A high ratio above 3x meant that a company may have a limited ability to reinvest in the business and the company could see increased risk in downturns.
Analysts’ forward forecasts help investors see whether leverage is improving, holding steady, or trending higher. In TIKR, you can track this ratio over time, allowing you to compare a company’s leverage against peers.
8. Earnings Quality

Where: TIKR > Estimates > Actuals & Forward Estimates
Earnings quality looks at how much of a company’s accounting profit turns into real cash flow. Analysts watch Free Cash Flow (FCF) and cash conversion to judge whether a business generates durable cash or relies too heavily on non-cash adjustments.
Strong earnings are supported by cash flow, while weak earnings might be built on non-cash accounting items. That difference often determines how resilient a company is during slower periods.
For Alphabet, free cash flow is projected to increase from about $73 billion in 2024 to more than $150 billion by 2029. FCF margins are also expected to improve from roughly 21% in 2024 to the mid-20s by 2029. Rising cash flow and expanding margins suggest a business that is becoming more efficient and converting a larger share of its revenue into cash flow.
In TIKR, you can review historical and forecasted FCF alongside net income to see how a company’s cash generation is expected to change over time.
TIKR Takeaway:
It’s important for investors to understand the full range of a company’s analyst forecasts. Estimates for a company’s revenue and earnings are helpful, but so are estimates for metrics like free cash flow, gross & EBITDA margins, and debt levels.
These metrics offer a deeper view of a company’s financial health and future performance.
By tracking these trends over time, you can build more confidence in your investment decisions and stay aligned with how professional analysts view the business.
The TIKR Terminal offers in-depth analyst estimates on over 100,000 global stocks, so if you’re looking to find the best stocks to buy for your portfolio, you’ll want to use TIKR!
TIKR offers institutional-quality research for investors who think of buying stocks as buying a piece of a business.
Value Any Stock in Under 60 Seconds with TIKR
With TIKR’s new Valuation Model tool, you can estimate a stock’s potential share price in under a minute.
All it takes is three simple inputs:
- Revenue Growth
- Operating Margins
- Exit P/E Multiple
If you’re not sure what to enter, TIKR automatically fills in each input using analysts’ consensus estimates, giving you a quick, reliable starting point.
From there, TIKR calculates the potential share price and total returns under Bull, Base, and Bear scenarios so you can quickly see whether a stock looks undervalued or overvalued.
Value any stock in under 60 seconds (Free with TIKR) >>>
Looking for New Opportunities?
- See what stocks billionaire investors are buying so you can follow the smart money.
- Analyze stocks in as little as 5 minutes with TIKR’s all-in-one, easy-to-use platform.
- The more rocks you overturn… the more opportunities you’ll uncover. Search 100K+ global stocks, global top investor holdings, and more with TIKR.
Disclaimer:
Please note that the articles on TIKR are not intended to serve as investment or financial advice from TIKR or our content team, nor are they recommendations to buy or sell any stocks. We create our content based on TIKR Terminal’s investment data and analysts’ estimates. We aim to provide informative and engaging analysis to help empower individuals to make their own investment decisions. Neither TIKR nor our authors hold any positions in the stocks mentioned in this article. Thank you for reading, and happy investing!


