

Charlie Munger once said, “If you don’t have a broad array of mental models, you’re going to miss a lot.”
Mental models give investors a structured way to think about businesses, especially when making decisions with incomplete information.
Instead of relying on scattered facts, mental models help to organize what matters and ignore what doesn’t.
In this write-up, we’ll explore 3 of the most useful mental models investors can use for analyzing stocks. Each one gives you a framework to answer fundamental stock analysis questions:
- How strong is the business?
- How capable is the management team?
- Will the stock likely deliver good returns at the current share price?
Together, these three lenses help to form the backbone of intelligent investing.
Analyze and value stocks in under a minute with TIKR’s new Valuation Model (It’s free) >>>
Mental Model 1: The 7 Powers Framework
When you evaluate a company, one of the first questions you’ll probably have is about the business’s quality.
Is this a business that can defend its profits over time, or one that will eventually get competed away?
Great businesses share one defining trait: they can maintain their competitive advantages. They make it hard for others to catch up.
Hamilton Helmer’s 7 Powers framework is one of the best ways to think about why that happens. Each one of the seven “Powers” represents a structural source of competitive strength, and can be thought of as a type of economic moat a company might have.
It can be helpful to look for companies that might have one or more of these 7 Powers. Let’s walk through them one by one.
1) Economies of Scale
Some companies win simply by being large enough to spread their fixed costs across millions of customers. When unit costs fall with volume, the company will see higher margins or can lower prices to squeeze competitors.
Economies of scale are why small rivals rarely unseat long-time giants in capital-intensive industries. The more production grows, the harder it becomes for a smaller player to match their cost structure.
Example: Netflix
Netflix spends billions every year producing original content, but every new subscriber makes those costs more efficient. The more users it adds, the lower the average cost per viewer, freeing up even more cash to reinvest in better content and technology. That loop of scale, reinvestment, and cost advantage creates a durable edge that few can match.

2) Network Effects
Some businesses become more valuable as they grow, not because of cost, but because of connection. Network effects occur when each new user improves the experience for everyone else, creating a self-reinforcing cycle of growth. When they work, they can turn a product into an ecosystem that’s almost impossible to replace.
Example: Airbnb
Airbnb’s platform works because more hosts attract more guests, and more guests attract more hosts. That two-sided feedback loop means each new listing improves the network’s value for future travelers. Over time, scale creates trust and liquidity that new entrants simply can’t replicate, giving Airbnb an enduring lead in short-term rentals.
3) Counter-Positioning
Sometimes a smaller company wins not by being cheaper or faster, but by thinking differently. Counter-positioning happens when a newcomer adopts a superior business model that incumbents won’t copy, usually because doing so would destroy their existing profits.
It’s one of the most powerful forces in disruption, because it traps competitors in their own success.
Example: Netflix vs. Blockbuster
Netflix’s DVD-by-mail and eventual streaming model was far more convenient than Blockbuster’s physical stores. But Blockbuster couldn’t copy this new business model without giving up the late fees and in-store sales that made it profitable.
By the time Blockbuster tried to pivot, the customer base had already moved on. Netflix’s counter-positioning permanently rewrote the rules of home entertainment.
4) Switching Costs
Switching costs protect a company by making it financially, operationally, or psychologically painful for customers to leave.
The higher the switching cost, the stronger the moat. High switching costs often make customers feel that leaving a company would be disruptive or risky.
Example: SAP
Enterprise software provider SAP builds its products into the heart of corporate operations. Replacing it isn’t as simple as downloading something new. It means retraining employees, migrating data, reworking entire workflows, and risking downtime.
Even if an alternative offers a lower price, the switching process often costs more than it saves, keeping SAP’s customers loyal for years.
5) Branding
A strong brand lets a company charge premium prices or maintain customer loyalty long after competitors enter the market.
Brands simplify decision-making for consumers by often standing for something like quality, trust, or identity.
Example: Apple
There are plenty of smartphones that cost less than an iPhone, but few inspire the same loyalty. Apple’s brand signals reliability, quality, and status.
That trust lets Apple maintain industry-leading margins and retain customers across devices and services. Branding isn’t just advertising, it’s a strategic asset that compounds over time.
See whether insiders or hedge funds are buying Apple stock today with TIKR (It’s free) >>>
6) Cornered Resource
Some advantages come from exclusive access rather than scale. A cornered resource gives a company exclusive control over something valuable, such as intellectual property, raw materials, partnerships, or talent that competitors can’t easily copy or buy.
These advantages are often temporary, but while they last, they can drive extraordinary profits.
Example: Pfizer
Pfizer’s patent on its COVID-19 vaccine gave it an immense advantage during the pandemic. That exclusivity, even for a few years, allowed the company to dominate the market and recoup billions in R&D spending.
Cornered resources don’t always last forever, but they can supercharge profitability during their window of exclusivity.

7) Process Power
Some companies build advantages that run deep in their culture or operations that others can’t easily imitate, even when they try.
Process power emerges when know-how, structure, and execution combine into something that looks simple from the outside but is almost impossible to replicate internally.
Example: Toyota
For decades, Toyota has shared the principles behind its production system with the world. Yet no competitor has managed to replicate it.
The system’s strength isn’t just efficiency; it’s discipline, continuous improvement, and cultural integration. Process power is invisible on a balance sheet, but it can drive years of outperformance.
Why the 7 Powers Matter
Each of these powers strengthens a company’s ability to sustain high returns and defend market share. Some, like patents or scale, are visible on paper. Others, like brand or process power, show up subtly in margin stability or steady cash flow.
When you find a company with two or three of these advantages working together, say, network effects, scale, and brand, you’re often looking at a business capable of compounding value for a very long time.
TIKR makes identifying these patterns easier. You can spot economies of scale through rising margins, network effects through accelerating revenue and user growth, and process power through long-term ROIC stability.
Analyze over 100,000 global stocks quicker with TIKR (It’s free) >>>
Mental Model 2: The 3-Step Framework for Evaluating Management
Once you’ve identified a great business, the next question is: who’s steering the ship?
You can have a company with a fantastic product, a strong moat, and a massive market opportunity, but if the leadership team misallocates capital or loses focus, all that potential can fade quickly. Management quality determines whether a good business stays great.
Evaluating management is part art, part science. You can’t quantify integrity or judgment as easily as margins or growth rates, but you can look for patterns.
We’ve studied lots of great investors and read dozens of books, but we’ve found that Warren Buffett’s simple formula remains the best way to think about management:
Great Management = Ethics + Competence + Motivation.
Let’s break each of these parts down.
1) Ethics
The first thing to look for is integrity. Management’s character doesn’t show up on a balance sheet, but it shows up in their decisions.
Leaders with integrity act transparently, even when the truth isn’t flattering. They communicate clearly with shareholders, admit mistakes, and avoid shortcuts that might boost short-term results at long-term cost.
Investors often underestimate how much this matters. Honest managers don’t just build trust, they reduce uncertainty. When you can rely on management’s word, you don’t have to second-guess every quarterly update.
Example: Warren Buffett and Charlie Munger at Berkshire Hathaway
For decades, Berkshire’s annual letters have set the standard for transparency. Buffett has openly admitted investment mistakes (like Dexter Shoe or IBM) and shared how he evaluates performance, both good and bad. That culture of honesty has earned Berkshire investors’ trust even through market volatility.
How to spot it on TIKR:
Check whether management’s long-term goals align with their reported performance. Are they delivering what they said they would? You can see if management kept to their word by reading past earnings transcripts.
Track years of earnings transcripts and public filings for any company with TIKR (It’s free) >>>
2) Competence
Ethics matter, but they’re not enough. A management team also needs the skill to execute.
Competence shows up in capital allocation: how leaders reinvest earnings, manage balance sheet risk, and build new revenue streams without diluting returns. It’s not about being the most innovative; it’s about using capital wisely and consistently.
Truly competent leaders think like owners. They focus on returns, not just growth. They know when to reinvest and when to return cash to shareholders.
Example: Satya Nadella at Microsoft
When Nadella took over in 2014, Microsoft was viewed as a slow-moving incumbent. By shifting the company’s focus to cloud computing and recurring subscription revenue, he transformed its economics and reignited growth. Revenue tripled, margins improved, and Microsoft’s valuation followed. That kind of transformation reflects both operational skill and disciplined capital allocation.
How to spot it in TIKR:
Look for rising ROIC, expanding margins, or consistent free cash flow growth. Compare these metrics across management tenures, a steady upward trend is usually a sign of competence.

3) Motivation
Finally, motivation ties everything together. The best leaders tend to care deeply about the mission and have skin in the game.
A motivated management team is aligned with shareholders because their own wealth and reputation depend on long-term success. They make decisions that protect the company’s future, not just next quarter’s earnings call.
Motivation can be intrinsic, a personal drive to build something meaningful, or financial, through significant share ownership or performance-based pay. Both matter, but the combination is rare.
Example: Jensen Huang at NVIDIA
Huang founded NVIDIA in 1993 and still leads it today. He owns roughly 3% of the company, which is an enormous stake for a business of that size. That ownership keeps him aligned with investors, and his passion for the technology keeps the company innovating faster than competitors. Under his leadership, NVIDIA evolved from a niche graphics card maker into the dominant force in AI computing.
How to spot it in TIKR:
Look at insider ownership and share sales. High ownership stakes or consistent buybacks often signal confidence. Frequent equity sales or short-term bonuses tied to revenue growth (rather than returns) can be red flags.
Use TIKR to spot high-ownership CEOs and track every insider buy or sale (It’s free) >>>
Why Management Quality Matters
Leadership doesn’t just shape results, it shapes durability. Ethical, competent, and motivated management teams can extend the lifespan of a company’s moat and amplify shareholder returns for decades.
Even slight differences in capital allocation decisions, such as how much to reinvest, when to buy back stock, or whether to pursue an acquisition, can compound into enormous differences in long-term value.
That’s why evaluating management isn’t a soft skill. It’s one of the most overlooked forms of edge an investor can develop.
Mental Model 3: Long-Term Drivers of a Stock’s Intrinsic Value
Even the best business can be a disappointing investment when you pay the wrong price. That is why valuation thinking matters.
It gives you a way to connect a company’s fundamentals to the returns you can reasonably expect from a stock.
Valuing a stock can become much easier when you organize your thinking around a simple idea:
Stock Value = FCF per Share × Valuation Multiple
Multiples move up and down for many reasons, and in the short term they are often driven by sentiment or market psychology.
That’s why it’s often best to focus on what drives free cash flow per share, as this is easier to forecast.
There are 3 main components that drive a company’s free cash flow over the long term:
- Revenue: How much the business grows top line sales.
- Margins: How efficiently the business can turn revenue into operating profit and free cash flow.
- Capital Allocation: How management reinvests, returns, or distributes capital.
When you evaluate a company using these three levers, you get clarity on what truly drives intrinsic value. In most cases, a full investment thesis can be explained by one or two of these factors, rather than a long list of talking points.
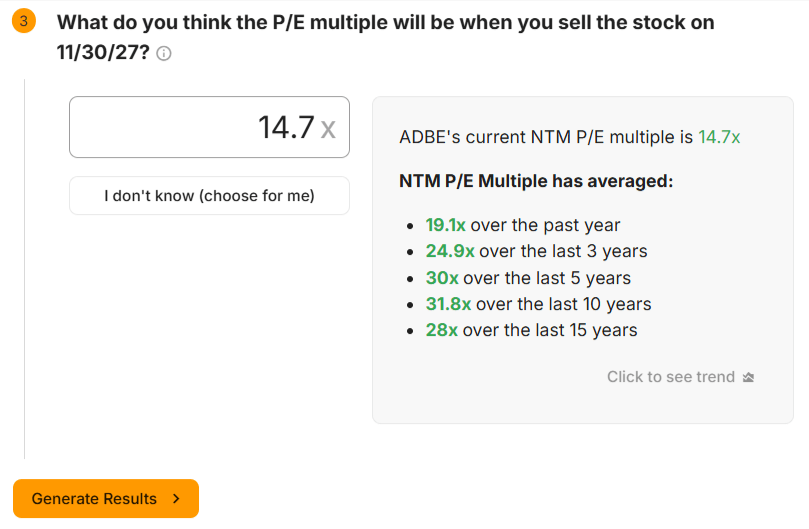
That’s why we built TIKR’s Valuation Model to value a company based on 3 simple inputs:
- Revenue Growth
- Margins
- P/E Multiple
Users can simply fill these 3 numbers into the Valuation Model Builder, and TIKR will automatically value the stock.
To make it even easier, users can select “I don’t know” for any of these inputs, and the model will automatically enter analysts’ consensus estimates for these inputs.
As an example, here’s what it looks like to value Adobe (ADBE) stock:

This makes it simple to value a stock and easy to see what’s driving returns.
In under 30 seconds, TIKR built a Guided Valuation Model that shows that Adobe stock could have nearly 30% upside today based on our revenue, margin, and valuation assumptions:

It’s free to build a Guided Valuation Model for any stock inside TIKR.
Try valuing your favorite stocks today!
Build a Valuation Model for any stock in under a minute with TIKR (It’s free) >>>
Building in a Margin of Safety
No matter how much research you do, the future is bound to unfold differently than expected.
That’s why it’s important to build a margin of safety into your valuation to give you a cushion between your estimate of a stock’s fair value and the price you pay.
If you can buy a stock at a discount to what you expect it to be worth, you’ll end up giving yourself a better chance of earning strong long-term returns because you paid a low price.
TIKR makes it easy to build a margin of safety into your valuation because you can test a stock’s Bull, Base, and Bear cases inside the Advanced Valuation Model.
This Adobe model projects what the stock could return using analysts’ high, mid, and low case estimates:

It’s likely that a strong margin of safety exists when it looks like the stock will still offer acceptable returns even if the bearish Low-case scenario plays out.
Inside TIKR, you can build a valuation model for any company, and it updates automatically as analyst estimates change. This helps you see the most current fair value targets and return expectations.
The Forecasted Summary section gives you an easy view of projected fair values and estimated returns based on the model’s assumptions:

With TIKR’s Advanced Model, you can build a fully customized financial forecast.
You can edit any cell in the Operating Data section to customize the model however you want.
This allows you to build professional-level equity models without using complicated Excel spreadsheets:

It only takes a minute to build the model, and you’ll quickly see how different growth assumptions can change a stock’s long-term return potential.
The Advanced Valuation Model is only available for paid TIKR users, but every upgrade comes with a 14-day money-back guarantee, so you can try it without any risk.
If it looks interesting, give it a try and see what returns your favorite stocks might offer today!
Value any stock in under 60 seconds (Free with TIKR) >>>
TIKR Takeaway:
At the end of the day, every investment decision is a blend of three judgments:
- How durable is the business?
- How capable is the management?
- And how fair is the price?
TIKR brings all three perspectives into one place. You can analyze the strength of a company’s moat, assess management through long-term returns and ownership data, and test valuation scenarios with TIKR’s Valuation Model.
Together, these 3 mental models give you clear frameworks to analyze investment ideas.
Value Any Stock in Under 60 Seconds with TIKR
With TIKR’s new Valuation Model tool, you can estimate a stock’s potential share price in under a minute.
All it takes is three simple inputs:
- Revenue Growth
- Operating Margins
- Exit P/E Multiple
If you’re not sure what to enter, TIKR automatically fills in each input using analysts’ consensus estimates, giving you a quick, reliable starting point.
From there, TIKR calculates the potential share price and total returns under Bull, Base, and Bear scenarios so you can quickly see whether a stock looks undervalued or overvalued.
Value any stock in under 60 seconds (Free with TIKR) >>>
Looking for New Opportunities?
- See what stocks billionaire investors are buying so you can follow the smart money.
- Analyze stocks in as little as 5 minutes with TIKR’s all-in-one, easy-to-use platform.
- The more rocks you overturn… the more opportunities you’ll uncover. Search 100K+ global stocks, global top investor holdings, and more with TIKR.
Disclaimer:
Please note that the articles on TIKR are not intended to serve as investment or financial advice from TIKR or our content team, nor are they recommendations to buy or sell any stocks. We create our content based on TIKR Terminal’s investment data and analysts’ estimates. We aim to provide informative and engaging analysis to help empower individuals to make their own investment decisions. Neither TIKR nor our authors hold any positions in the stocks mentioned in this article. Thank you for reading, and happy investing!


