
Key Takeaways:
- Revenue Base: Western Union generated $4 billion in trailing revenue, reflecting scale even as transaction volumes face competitive pressure.
- Profitability: Operating income of $800 million and a 19% margin highlight cost discipline in a mature remittance model.
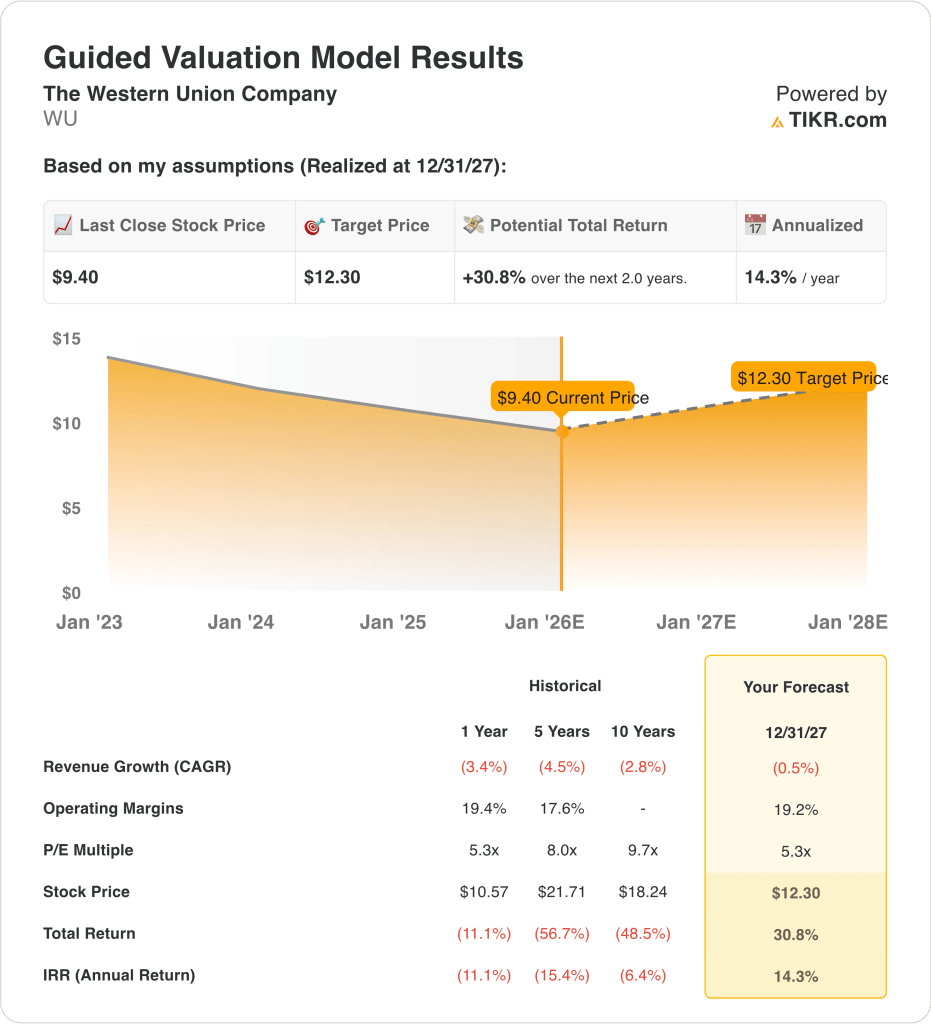
- Price Projection: Based on valuation assumptions, the stock could reach $12 by December 2027.
- Return Profile: This implies a 31% total return from $9, or about 14% annually over two years.
The Western Union Company (WU) operates one of the world’s largest cross-border money transfer networks, serving retail and digital customers across more than 200 countries with a focus on remittances.
In December, Western Union expanded its European footprint through a Deutsche Post partnership, increasing physical access ahead of 2026, which matters as distribution breadth supports transaction stability.
Revenue declined modestly year over year as pricing pressure and digital competition weighed on volumes, still produced roughly $800 million in operating income, reflecting resilience in its cost structure.
Operating margins held near 19%, showing earnings efficiency even as top-line growth remained constrained, which preserves cash flow flexibility during a mature business phase.
With a market capitalization near $4 billion, Western Union is prioritizing margin protection, dividends, and partner-led reach rather than aggressive expansion.
Despite steady profits and cash generation, the stock trades near 5x forward normalized earnings, raising the question of whether current pricing fully reflects its durability and capital return profile.
What the Model Says for Western Union Stock
Western Union’s model reflects a mature remittance franchise prioritizing cash returns and distribution expansion over growth, supported by stable operating income and a high dividend payout.
Assuming roughly –0.5% revenue growth, ~19% operating margins, and a 5.3× exit P/E, the model projects the stock rising from $9 to $12.
That implies a 31 % total return, or 14% annualized returns, by December 2027.
Our Valuation Assumptions
TIKR’s Valuation Model lets you plug in your own assumptions for a company’s revenue growth, operating margins, and P/E multiple, and calculates the stock’s expected returns.
Here’s what we used for WU stock:
1. Revenue Growth: -0.5%
Per compiled analyst estimates, a –0.5% annual revenue outlook assumes near-term stabilization while recognizing limited structural growth in Western Union’s mature core markets.
Western Union’s revenue base has declined consistently, falling from $5.1B in 2021 to roughly $4.1B LTM, reflecting structural pressure in legacy consumer-to-consumer remittances.
Recent quarters show stabilization rather than acceleration, with forward revenue estimates flattening between $4.1B and $4.3B through 2027 as price competition persists.
The Deutsche Post partnership in Germany introduces incremental corridor expansion, but its scale limits near-term top-line impact relative to global revenue.
Digital transaction growth partially offsets physical-agent softness, though competitive fintech pricing caps meaningful ARPU expansion.
2. Operating Margins: 19.2%
Western Union’s LTM operating margin sits near 19.4%, supported by scale, disciplined cost controls, and a largely fixed infrastructure base.
Margins have compressed modestly from historical peaks reached 22% as marketing investment and pricing actions intensified to defend transaction volumes.
Forward estimates show operating margins stabilizing between 18–19%, suggesting cost discipline offsets revenue pressure.
Digital mix expansion improves unit economics, but promotional intensity constrains margin expansion potential.
Ongoing efficiency programs protect profitability, yet regulatory and compliance costs remain structurally elevated.
As reflected in consensus expectations, a 19.2% margin outlook keeps profitability near current normalized levels without implying a return to prior-cycle highs.
3. Exit P/E Multiple: 5.3x
Western Union trades around 5×-6x normalized forward earnings which places it at the low end of global payments and financial services peers.
Historical multiples averaged closer to 8–10× during periods of revenue growth and corridor expansion.
Investor caution reflects secular volume pressure, limited reinvestment optionality, and a shrinking earnings base.
Offsetting factors include strong free cash flow generation and a dividend yield in the high-single-digit to low-double-digit range.
Re-rating requires evidence of sustained revenue stabilization and digital-led transaction growth.
Based on street consensus estimates, A 5.3× exit multiple reflects current forward valuation levels and assumes no meaningful re-rating. supported by steady cash generation but capped re-rating potential.
What Happens If Things Go Better or Worse?
Western Union outcomes depend on transaction stability, margin protection, and whether valuation remains anchored to its low-growth remittance profile. Here is how WU stock might perform through 2027:
- Low Case: If revenue continues to decline slightly and net income margins drift toward 12.6%, valuation compresses toward ~4.5x earnings → ~6% annual return.
- Mid Case: With flat revenue, margins holding to 13.2%, and valuation staying around ~5x earnings → ~11% annual return.
- High Case: If partner expansion stabilizes volumes and margins improve toward 13.6%, valuation lifts toward ~6x earnings → ~14% annual return.
Western Union’s $12 target is achievable if margins hold and cash returns remain intact, even without a return to revenue growth.

How Much Upside Does Western Union Have From Here?
With TIKR’s new Valuation Model tool, you can estimate a stock’s potential share price in under a minute.
All it takes is three simple inputs:
- Revenue Growth
- Operating Margins
- Exit P/E multiple
If you’re not sure what to enter, TIKR automatically fills in each input using analysts’ consensus estimates, giving you a quick, reliable starting point.
From there, TIKR calculates the potential share price and total returns under Bull, Base, and Bear scenarios so you can quickly see whether a stock looks undervalued or overvalued.
Looking for New Opportunities?
- See what stocks billionaire investors are buying so you can follow the smart money.
- Analyze stocks in as little as 5 minutes with TIKR’s all-in-one, easy-to-use platform.
- The more rocks you overturn… the more opportunities you’ll uncover. Search 100K+ global stocks, global top investor holdings, and more with TIKR.
Disclaimer:
Please note that the articles on TIKR are not intended to serve as investment or financial advice from TIKR or our content team, nor are they recommendations to buy or sell any stocks. We create our content based on TIKR Terminal’s investment data and analysts’ estimates. Our analysis might not include recent company news or important updates. TIKR has no position in any stocks mentioned. Thank you for reading, and happy investing!