
By the time a stock makes headlines for beating earnings or surprising the Street, the market has usually already reacted. The price jumps in pre-market trading. Analysts scramble to update their models.
Retail investors read the news and wonder whether they missed the move. But the trend that drove those results didn’t appear overnight. It was built over quarters, hidden in plain sight within financial statements, management commentary, and analyst revisions that most people never tracked.
Catch earnings inflections early using TIKR’s data and valuation tools (It’s free)>>>
Professional investors don’t wait for headlines. They watch for early signals that earnings momentum is inflecting, whether accelerating or decelerating, long before it becomes consensus.
They track sequential revenue trends, monitor margin behavior across cycles, and compare guidance patterns to historical norms. When several indicators align, they position the narrative ahead. When the data diverges from management’s story, they get cautious before the market catches on.
The edge isn’t access to inside information, it’s knowing where to look and having the discipline to consistently track the right metrics.
This guide shows you how to spot earnings trends early using publicly available data, how to interpret what you find, and how to use TIKR to monitor these signals without building complicated spreadsheets or toggling between a dozen sources.
Why Earnings Trends Matter More Than Single Quarters
A single earnings report tells you what happened last quarter. An earnings trend tells you where the business is headed. Investors who focus only on whether a company beat or missed estimates are looking in the rearview mirror. The real opportunity, and the real risk, lies in understanding whether performance is improving, deteriorating, or inflecting in a new direction.
Trends reveal momentum. When revenue growth accelerates for two or three consecutive quarters, it signals strengthening demand, market-share gains, or successful new-product launches. When margins expand steadily, it shows pricing power or operational leverage kicking in.
Conversely, when growth decelerates or margins compress over multiple periods, it suggests competitive pressure, market saturation, or execution issues, even if the company is still beating estimates.
The market eventually prices in these trends, but there’s often a lag. Companies that report solid but decelerating growth can trade sideways for quarters before sentiment shifts.
Businesses with quietly accelerating fundamentals can stay undervalued until the pattern becomes undeniable. Spotting the inflection early gives you time to position before the headlines catch up.
Step 1: Track Sequential Revenue Growth, Not Just Year-Over-Year
Most investors focus on year-over-year revenue growth because that’s what gets reported in earnings releases and discussed on calls. But year-over-year comparisons can hide inflections, especially when you’re lapping easy or tough comps from the prior year. Sequential growth, which looks at quarterly periods, shows what’s happening now.

Even if year-over-year growth looks consistent, sequential trends can reveal whether momentum is building or fading.
For example, if a company grew revenue 15% year over year for three consecutive quarters but sequential growth fell from 5% to 3% to 2%, the business is decelerating. The market might not react immediately, but that pattern often leads to guidance cuts or multiple compressions.
However, if sequential growth is reaccelerating after several flat quarters, you might be catching an inflection before it shows up in year-over-year comps.
Find multi-bagger stocks early with TIKR (It’s free) >>>
Step 2: Monitor Gross and Operating Margin Trends
Revenue growth gets the attention, but margin trends often tell you more about the quality and sustainability of that growth. Expanding margins signal pricing power, operating leverage, or cost discipline.
Shrinking margins suggest competition, input cost pressures, or heavy investment that has not yet translated into efficiency gains.

Investors can track a company’s Gross and Operating Margins over quarterly periods and look for patterns. Are margins expanding as revenue grows, suggesting the company is scaling efficiently?
Are they stable despite revenue growth, indicating reinvestment or competitive dynamics? Are they compressing, which could mean the growth is expensive or unsustainable?
Also, compare margin trends to what management discusses on earnings calls. If they emphasize strong unit economics but margins are declining, there’s a disconnect.
If they talk about near-term investment but margins are already improving, the payoff might be arriving sooner than expected. TIKR’s charts make these patterns immediately visible without manual calculation.
Analyze stocks quicker with TIKR (It’s free) >>>
Step 3: Watch for Changes in Free Cash Flow Conversion
Earnings can be managed through accounting choices. Cash flow is harder to manipulate. One of the earliest signs of deteriorating quality, or improving strength, shows up in how well net income converts to free cash flow.

Navigate to TIKR’s Cash Flow Statement and compare Free Cash Flow to Net Income over the past several quarters. If free cash flow is growing faster than earnings, the business is becoming more efficient or benefiting from favorable working capital trends.
If earnings are rising but cash flow is flat or declining, something’s off. The company might be aggressively growing receivables, building inventory that isn’t selling, or facing higher capital expenditures.
This divergence often precedes headline surprises. A company reporting strong earnings with weak cash flow eventually faces a reckoning when investors realize the profits aren’t translating to cash generation.
Businesses with conservative accounting that generate more cash than reported earnings are often revalued higher once the market recognizes it.
Review stock fundamentals in less than 60 seconds with TIKR (It’s free) >>>
Step 4: Compare Actual Results to Guidance Patterns
Companies that consistently beat their own guidance aren’t necessarily outperforming. They might just be sandbagging. Companies that consistently miss might not be underperforming. They might be too aggressive.
Understanding a company’s guidance patterns helps you anticipate whether the next quarter’s result will meet, beat, or miss expectations.
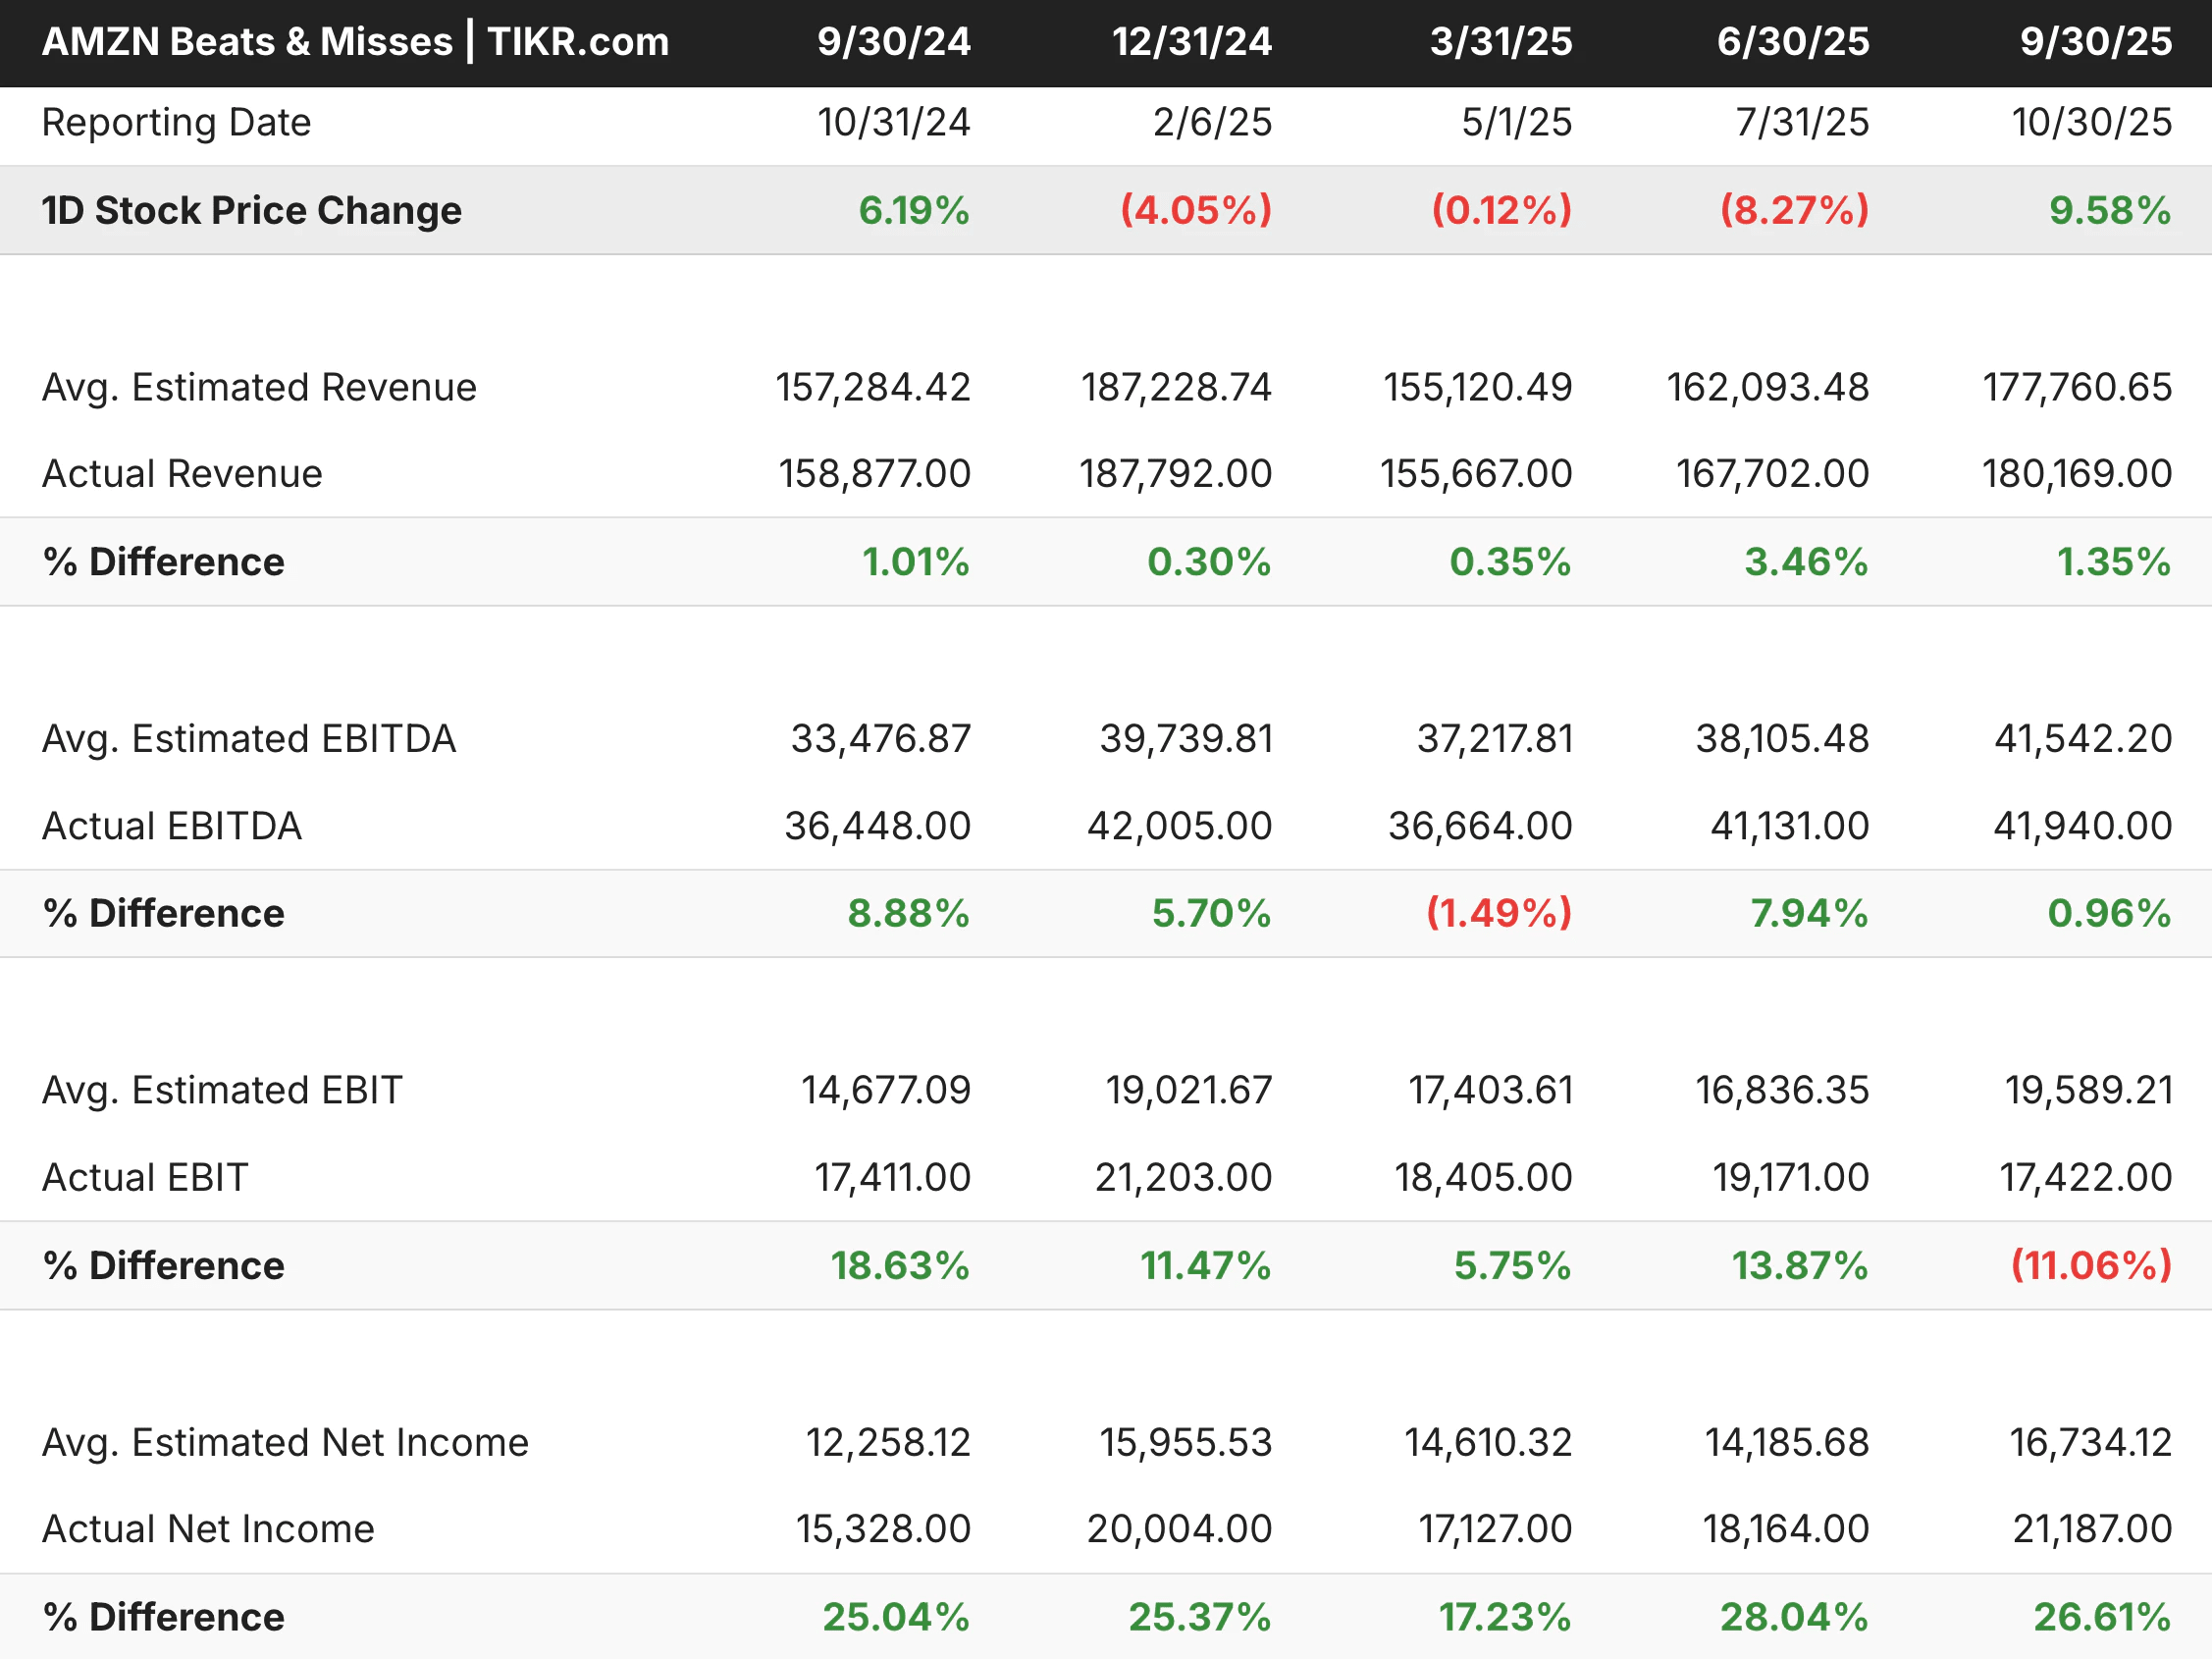
In TIKR’s Estimates > Beats & Misses tab, compare management’s guidance (often discussed in earnings call transcripts) to the actual results that followed. Track this over four to eight quarters.
Does the company guide conservatively and beat by 2-3% every time? Does it guide in line and deliver exactly as promised? Does it frequently revise guidance mid-quarter?
When a company that typically sandbags suddenly guides in line with the Street or only slightly above, it can signal weakening confidence. When a company known for conservative guidance raises estimates, it’s often a stronger signal than when an aggressive guider does the same.
TIKR’s transcript archive lets you review historical calls to see how management’s tone and precision have evolved over time.
Step 5: Track Analyst Estimate Revisions
Analyst estimates don’t predict the future, but the direction and magnitude of revisions reveal where consensus expectations are headed. When multiple analysts raise their revenue or earnings estimates within a short window, especially outside of earnings season, it often reflects new data points like channel checks, product cycles, or management updates that suggest improving fundamentals.
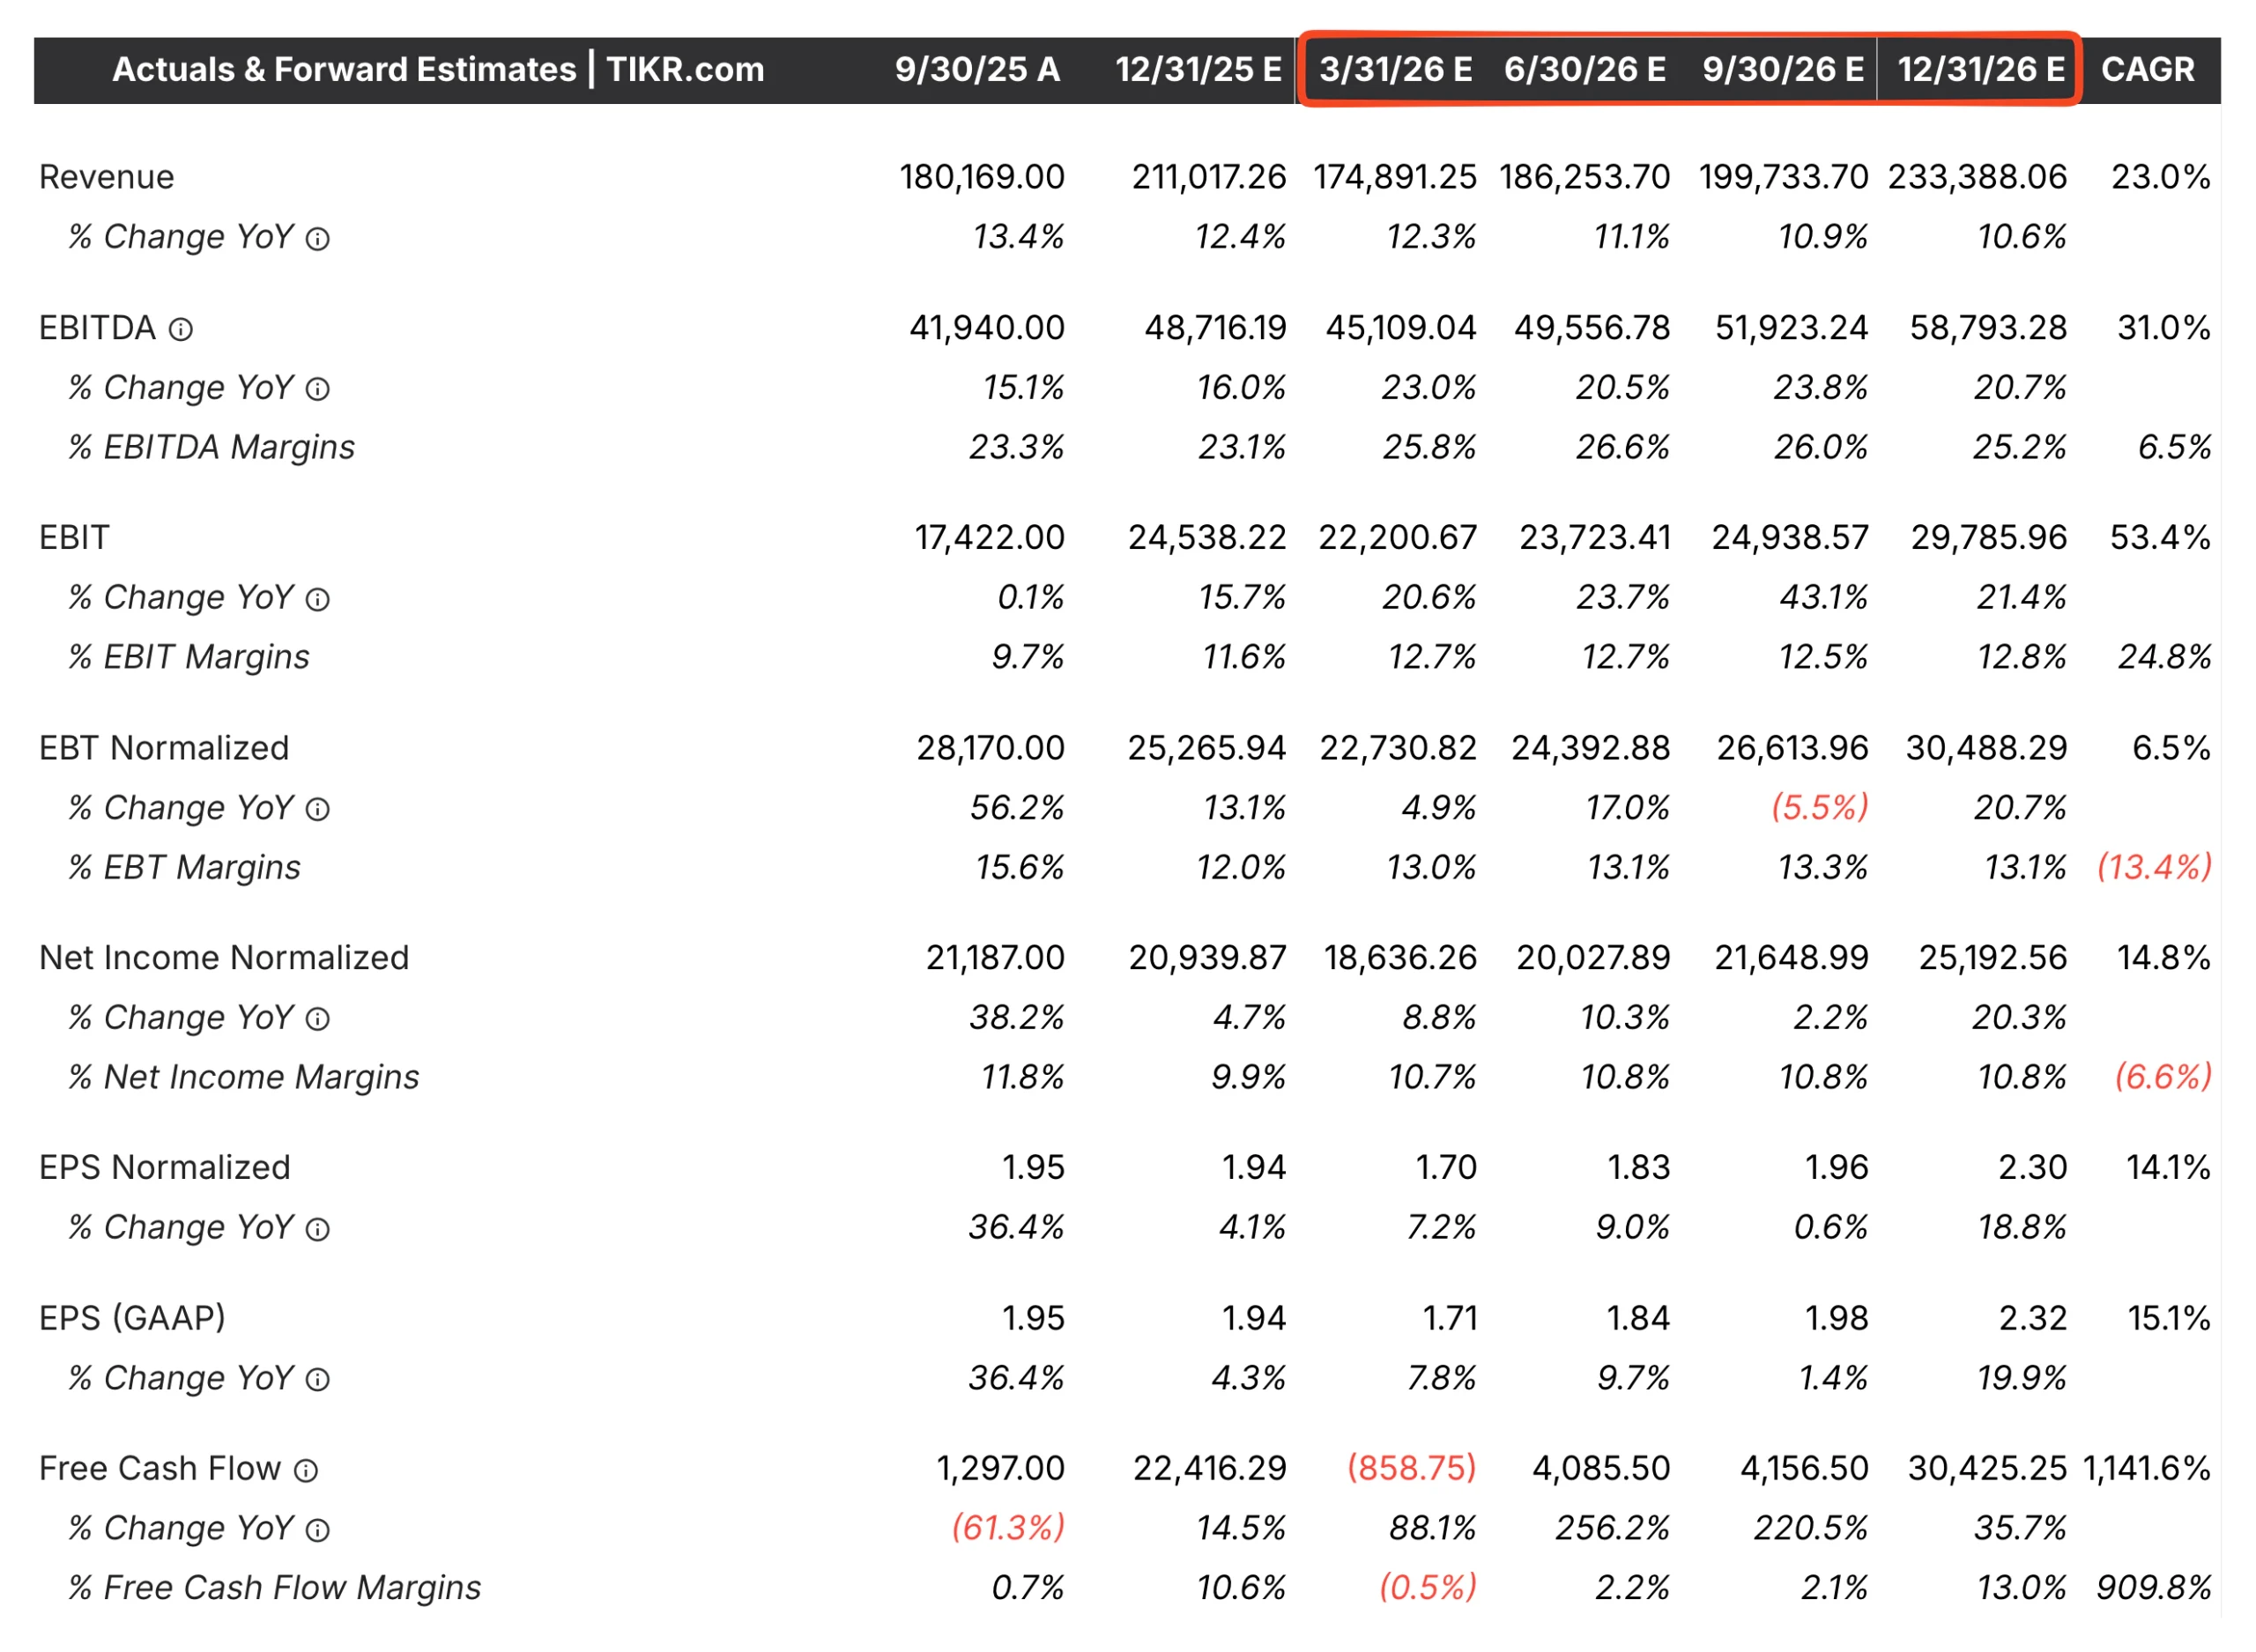
TIKR’s Estimates tab shows you consensus revenue and earnings forecasts for the next several quarters and years, along with how those numbers have changed over time. Look for steady upward revisions, which tend to precede positive earnings surprises and stock outperformance.
Conversely, watch for downward revisions that cluster together. These often signal deteriorating industry dynamics or company-specific challenges before they become widely recognized.
You can also compare the high and low estimates to the consensus. A wide range suggests uncertainty. A tight range with rising consensus suggests growing confidence.
These patterns give you a sense of whether the Street is getting more or less bullish, often before that sentiment shows up in price action.
Step 6: Look for Inflections in Return Metrics
Return on Invested Capital (ROIC), Return on Equity (ROE), and Return on Assets (ROA) measure how efficiently a company generates profits from its capital base. These ratios tend to move slowly, but when they inflect, it’s often a sign that something fundamental has changed in the business model, competitive position, or management execution.

In TIKR’s Ratios tab, chart ROIC or ROE over the past three to five years. Look for periods where returns were stable or declining, followed by a sustained uptick. This inflection often coincides with margin expansion, asset efficiency improvements, or successful capital allocation. It’s also one of the metrics that separates temporary earnings beats from sustainable outperformance.
Rising returns on capital, especially when paired with revenue growth, suggest a business entering a compounding phase. Declining returns, even with revenue growth, can signal that the company is investing more to achieve the same results, a warning sign that competitive dynamics are shifting.
Common Mistakes to Avoid
The biggest mistake is focusing only on the headline numbers: did they beat or miss, and by how much. Beats and misses are backward-looking. Trends are forward-looking.
A company can beat estimates every quarter while fundamentals deteriorate underneath. If you’re not tracking sequential growth, margins, and cash flow, you miss the inflection.
Another error is ignoring guidance patterns. Not all guidance is created equal. A conservative guider who suddenly guides in line is sending a different signal than a sandbagging company doing the same thing.
Without historical context, you can misinterpret management’s tone and positioning. TIKR’s multi-year estimates and transcript history give you that context quickly.
Finally, many investors spot a trend but fail to verify it across multiple metrics. Revenue might be accelerating, but if margins are compressing and cash flow is lagging, the growth might not be sustainable.
The strongest trends show up in multiple places: revenue, margins, cash flow, returns, and analyst revisions all moving in the same direction. When only one metric looks good, dig deeper before assuming the trend is real.
Track company financials, analysts’ estimates, and competitor information with TIKR (It’s free) >>>
TIKR Takeaway
Spotting earnings trends before they hit the headlines isn’t about predicting the future. It’s about consistently tracking the right metrics and recognizing patterns that signal shifts in business momentum.
Sequential revenue growth, margin trends, cash flow conversion, guidance behavior, estimate revisions, and return metrics all tell part of the story. When they align, the signal is strong.
TIKR makes this process repeatable by centralizing everything you need on a single platform. You can view quarterly financials, chart margins and cash flow over time, compare results to estimates, review earnings call transcripts, and track analyst revisions without leaving the terminal.
Instead of building spreadsheets or jumping between sites, you can monitor these signals in minutes and stay ahead of the market.
The trends are already there, waiting in the data. You just need to know where to look and have the tools to track them efficiently. That’s how professionals stay ahead of the headlines, and now you can too.
How to Accurately Value a Stock in Under 30 Seconds
With TIKR’s new Valuation Model tool, you can accurately estimate a stock’s potential share price in 30 seconds or less.
All it takes are three simple inputs:
- Revenue Growth
- Operating Margins
- Exit P/E Multiple
If you’re not sure what to enter, TIKR will enter analysts’ consensus estimates for you.
From there, TIKR calculates the potential share price and total returns under Bull, Base, and Bear scenarios so you can quickly see whether a stock looks undervalued or overvalued today.
See a stock’s true value in under 30 seconds (Free with TIKR) >>>
Looking for New Opportunities?
- Discover which stocks billionaire investors are purchasing, so you can follow the smart money.
- Analyze stocks in as little as 5 minutes with TIKR’s all-in-one, easy-to-use platform.
- The more rocks you overturn… the more opportunities you’ll uncover. Search 100K+ global stocks, global top investor holdings, and more with TIKR.
Disclaimer:
Please note that the articles on TIKR are not intended to serve as investment or financial advice from TIKR or our content team, nor are they recommendations to buy or sell any stocks. We create our content based on TIKR Terminal’s investment data and analysts’ estimates. Our analysis might not include recent company news or important updates. TIKR has no position in any stocks mentioned. Thank you for reading, and happy investing!