
Key Stats for Costco Stock
- 1- Year Price Change for Costco stock: 3.6%
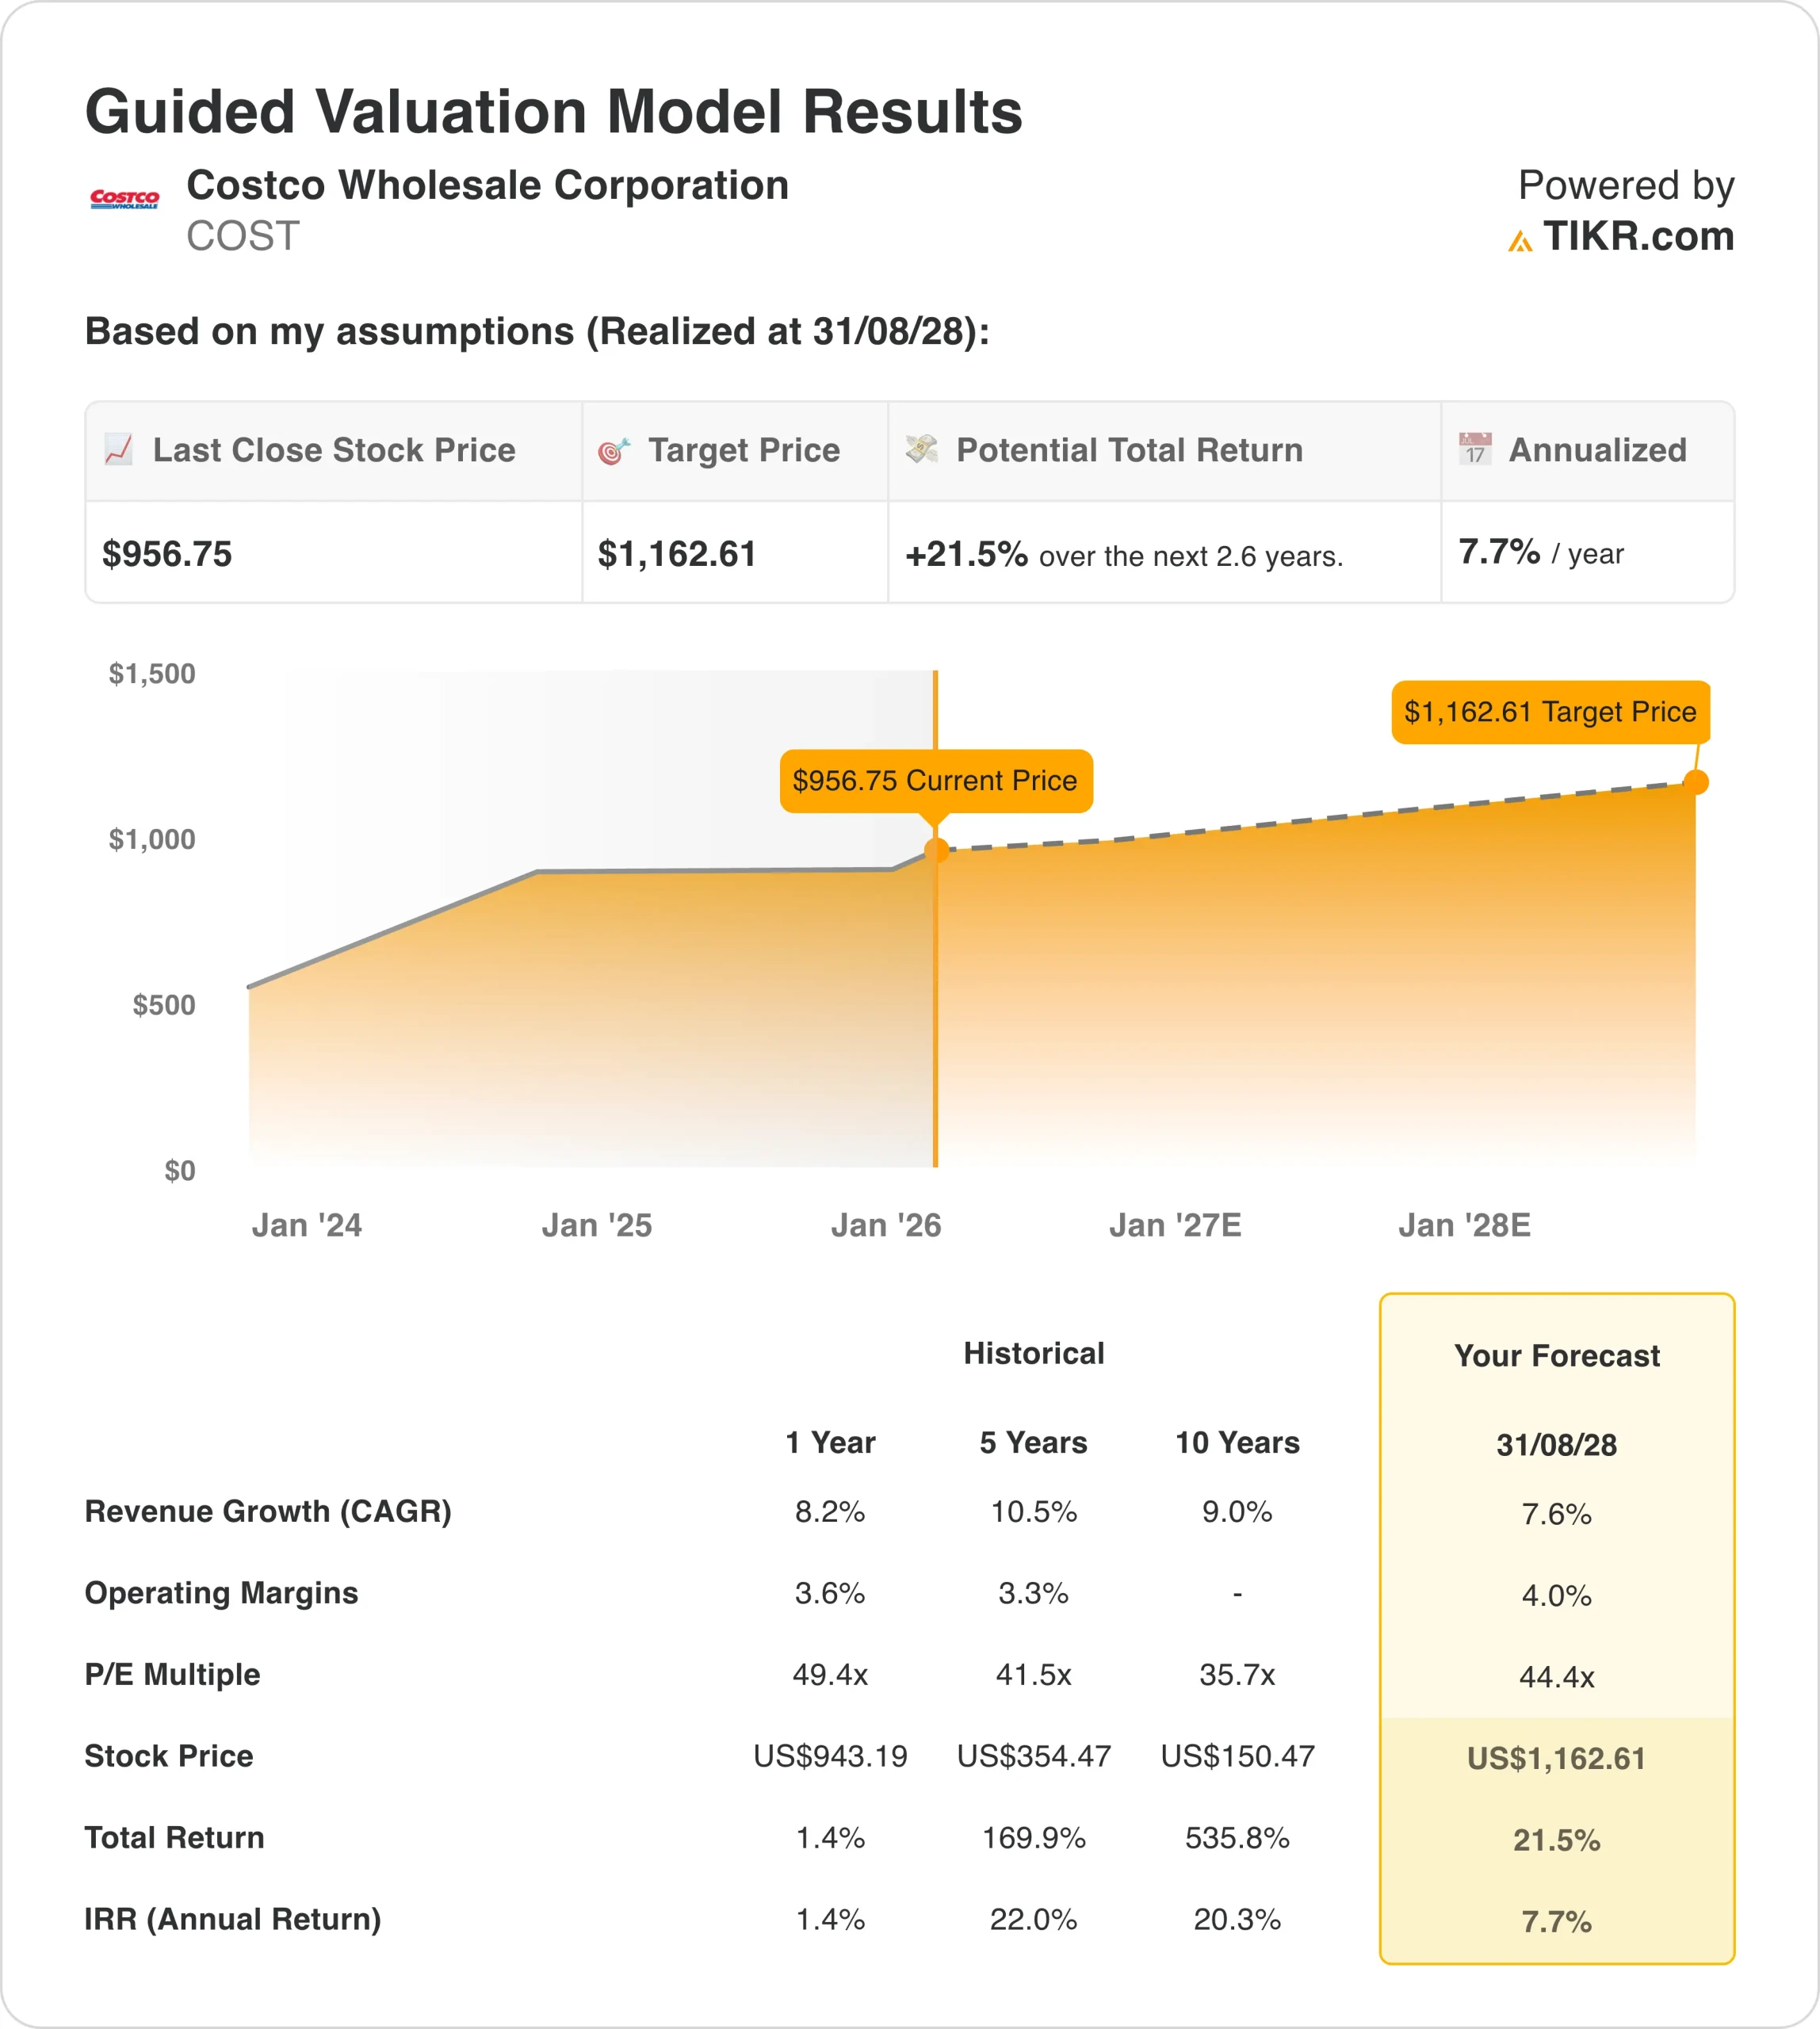
- $COST Share Price as of Jan. 15: $957
- 52-Week High: $1,078
- $COST Share Price Target: $1,030
Now Live: Discover how much upside your favorite stocks could have using TIKR’s new Valuation Model (It’s free)>>>
What Happened?
Bernstein analyst Zhihan Ma doubled down on Costco (COST) stock yesterday, calling the warehouse giant “the ultimate compounder” and reiterating her “overweight” rating with a $1,146 price target. That implies roughly 20% upside from current levels.
Ma’s bullish stance comes on the heels of strong December sales results.
- Costco reported net sales of $29.86 billion for the five-week period ending January 4, up 8.5% year-over-year.
- Comparable sales growth came in at 6.2% when stripping out gas price changes and foreign exchange impacts.
- Traffic increased 2.7% worldwide, showing that more shoppers are walking through the doors.
Valued at a market cap of $425 billion, Costco stock has returned 536% over the past decade.
The company also just wrapped up a solid first quarter for fiscal 2026, beating earnings expectations with $4.50 per share.
Management highlighted major wins across the board:
- Fresh foods up high single digits, digital sales surging 20.5%, and strong performance in pharmacy, jewelry, and tire departments.
- New technology rollouts, such as pre-scanning at checkout and AI-driven inventory management, are driving productivity gains while keeping the member experience smooth.
See analysts’ growth forecasts and price targets for Costco stock (It’s free!) >>>
What the Market Is Telling Us About Costco Stock
Bernstein’s argument is straightforward: Costco stock deserves a premium valuation because it delivers predictable, high-quality growth year after year.
Ma expects the company to sustain 12% to 13% annual earnings-per-share growth with steady returns on equity over the long term. That kind of consistency, she argues, justifies a price-to-earnings multiple in the 45x to 50x range—or potentially even higher.
Right now, Costco stock trades at about 46.5x forward earnings. Ma believes there’s room for that multiple to expand further, especially given the company’s track record of executing at a high level while maintaining strong membership renewal rates (92.2% in the U.S. and Canada).
With 30-plus new warehouses planned annually and digital sales growing at nearly double the rate of in-store comps, the growth story is far from over.
The December sales results back up this thesis.
- Even with gas price deflation as a headwind, Costco posted solid comps across all major categories. Non-foods grew mid-single digits, driven by jewelry, tires, and appliances.
- Fresh foods—always a key driver of traffic—were up in the high single digits.
- And the company’s digital business continues to impress, with online sales up 18.3% for the month.
CEO Ron Vachris emphasized on the recent earnings call that technology investments are paying off. Warehouse productivity is at record levels, and AI tools are improving everything from pharmacy inventory to gas station operations.
The focus remains squarely on delivering value to members, whether that’s through lower prices on Kirkland Signature products or faster checkout times.
For investors, the takeaway is clear: Costco stock may look expensive on a traditional P/E basis, but the company’s ability to compound earnings at a steady double-digit pace makes it a rare find in today’s market.
Bernstein’s $1,146 price target reflects confidence that this growth engine has plenty of fuel left in the tank.
Estimate a company’s fair value instantly (Free with TIKR) >>>
How Much Upside Does Costco Stock Have From Here?
With TIKR’s new Valuation Model tool, you can estimate a stock’s potential share price in under a minute.
All it takes is three simple inputs:
- Revenue Growth
- Operating Margins
- Exit P/E Multiple
If you’re not sure what to enter, TIKR automatically fills in each input using analysts’ consensus estimates, giving you a quick, reliable starting point.
From there, TIKR calculates the potential share price and total returns under Bull, Base, and Bear scenarios so you can quickly see whether a stock looks undervalued or overvalued.
See a stock’s true value in under 60 seconds (Free with TIKR) >>>
Looking for New Opportunities?
- See what stocks billionaire investors are buying so you can follow the smart money.
- Analyze stocks in as little as 5 minutes with TIKR’s all-in-one, easy-to-use platform.
- The more rocks you overturn… the more opportunities you’ll uncover. Search 100K+ global stocks, global top investor holdings, and more with TIKR.
Disclaimer:
Please note that the articles on TIKR are not intended to serve as investment or financial advice from TIKR or our content team, nor are they recommendations to buy or sell any stocks. We create our content based on TIKR Terminal’s investment data and analysts’ estimates. Our analysis might not include recent company news or important updates. TIKR has no position in any stocks mentioned. Thank you for reading, and happy investing!