
Many investors spend most of their time looking at a stock’s past financial statements without giving too much thought to what a company’s future growth will look like.
While history provides essential context, the market is a discounting mechanism that constantly looks six to eighteen months ahead.
By the time a company reports a record-breaking quarter, the market has usually already priced that success into the stock and moved on. To find a true edge, you have to shift your perspective toward forward-looking cash flows and earnings power.
The TIKR platform simplifies grabbing forward estimates for a stock by aggregating professional analyst forecasts for a company.
The “Wisdom of Crowds” Advantage
Before you use the numbers, you need to understand what “Consensus Estimates” actually represent.
They are the average forecast of all institutional analysts covering a stock. While no single analyst is perfect, analysts tend to be directionally accurate, and the outliers tend to cancel each other out when averaged together.
The resulting “Consensus” line on TIKR provides a proxy for market expectations. Your job as an investor is to determine if the market is wrong, but you cannot do that until you know what a company’s consensus estimates are, because this is what the market thinks.
Step 1: Anchor to the Forward Estimates
See up to 5 years of analysts’ estimates for any stock with TIKR >>>
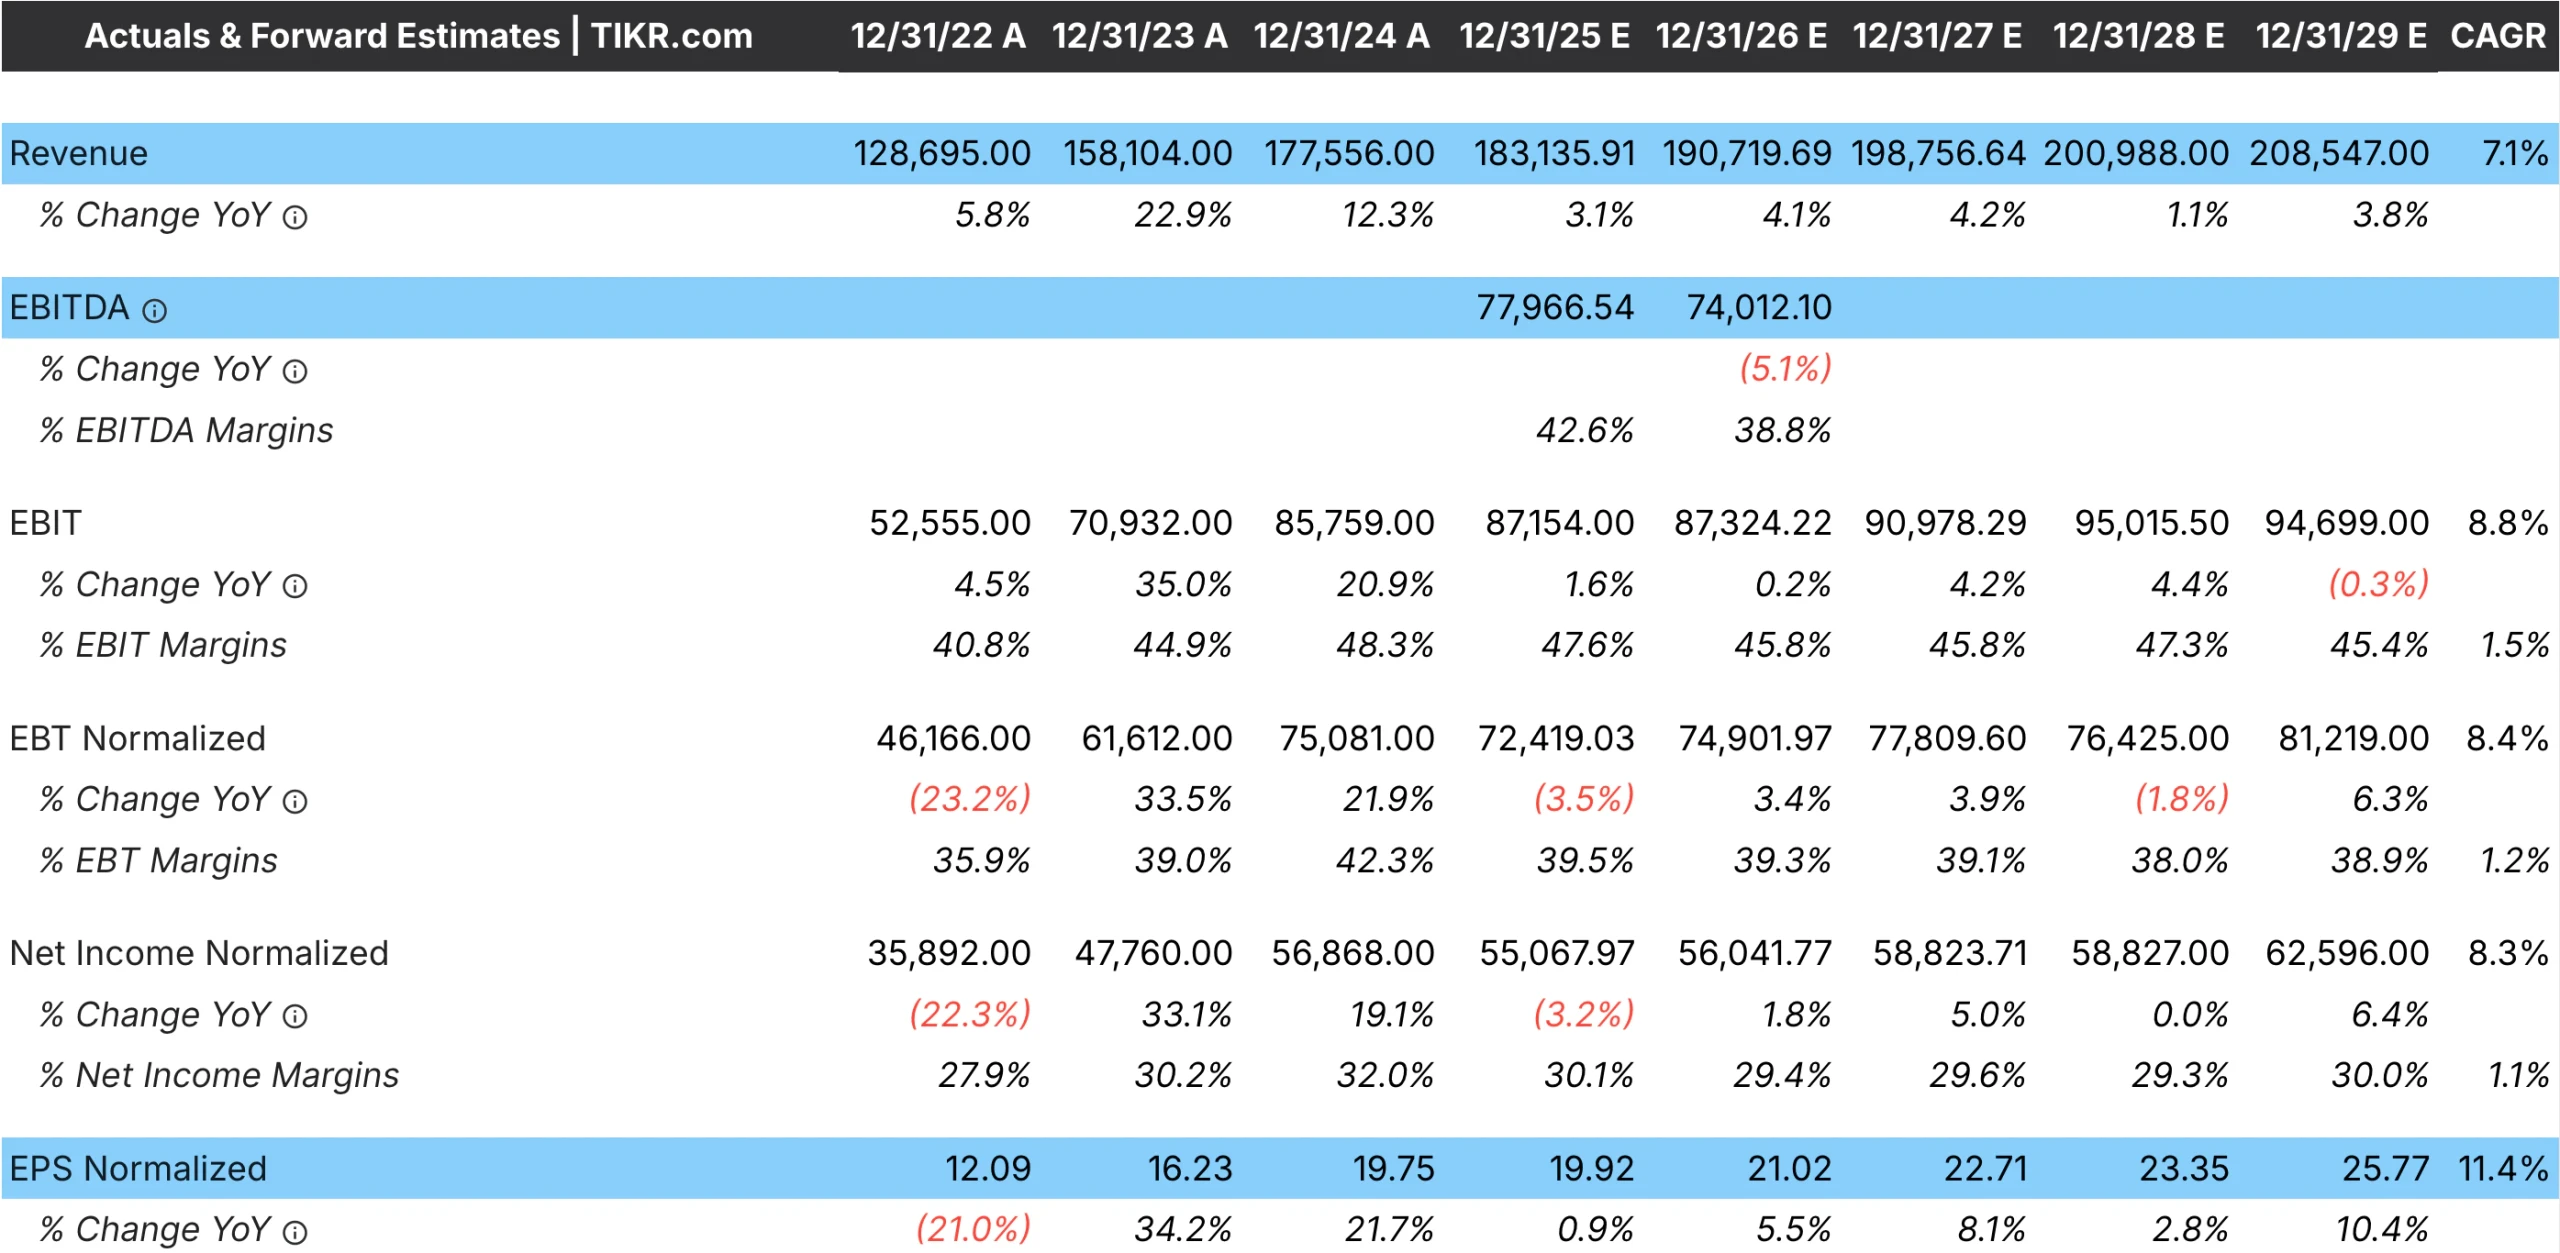
Navigate to the Estimates tab on TIKR. You will see projections for key metrics, including Revenue, EBITDA, and Earnings Per Share (EPS), for the next several years. While most investors focus on the current year, the market is often looking 18 months ahead.
Identify the Consensus EPS estimate for this period. This number is the foundation of your model because it reflects the collective expectation of analysts following the company.
TIKR displays these estimates alongside the number of analysts covering the stock, helping you assess the data’s reliability.
Step 2: Audit the Consensus Change

The absolute earnings number matters less than the direction of movement. Analysts are often slow to react to changing conditions, and their estimates can become stale if not monitored.
In the Estimates section, review the financial figures, like revenue, for different years. If you see these numbers steadily increasing, it suggests the business is growing and, hopefully, outperforming.
If the numbers are trending lower, it is a warning that the “cheap” forward P/E might be an illusion. You should also check the “Number of Analysts” table. A consensus built on twenty analysts is much more robust than one built on two.
Get the most up-to-date financial snapshots of thousands of stocks with TIKR (It’s free) >>>
Step 3: Verify the Margin and Revenue Logic

Revenue growth is the top line, but profit margins determine how much of that growth reaches shareholders. You need to verify whether the analyst assumptions are grounded in the business’s historical reality.
Go to the Financials tab on TIKR and compare the forward margin estimates to the long-term historical average. If the company typically operates at a 15% margin but analysts are modeling 22% for next year, you must ask what has changed.
If there is no clear plan to cut costs or raise prices, the estimates may be too aggressive. In these cases, it is safer to lower your EPS input in your model to match the company’s historical efficiency.
Run a competitor analysis on TIKR for the top stocks in your portfolio (It’s free) >>>
Step 4: Determine the Historical Valuation Baseline

A forward earnings number only matters if you pair it with a reasonable valuation multiple. A common mistake is to apply the same multiple to every stock, even though different businesses have very different growth rates, risk profiles, and business quality.
Instead, go to the Valuation tab on TIKR and look at the company’s historical trading multiples, such as its EV/EBITDA or P/E ratio. This shows you the range of prices the market has historically been willing to pay for this specific business across different market environments.
Using the company’s own valuation history gives you a realistic starting point for your model and helps you avoid picking a multiple at random.
Step 5: Build the Target Price and Range

This is where you turn data into a decision. TIKR’s Valuation Model Builder automates the multi-year forecast by pulling in Wall Street consensus estimates as a baseline.
- Initialize the Model: Name your model and let the platform generate the baseline multi-year forecast.
- Customize Inputs: Edit detailed line items like revenue growth, EBIT margins, and exit multiples based on your research.
- Compare Cases: Professional investors think in ranges. Use the model to create a “Base Case” using consensus, a “Bull Case” using optimistic estimates, and a “Bear Case” using more conservative historical margins.
- Identify Upside: The tool instantly recalculates the potential annualized returns and target prices based on your inputs. If your conservative case still shows a margin of safety, you have a high-conviction opportunity.

Estimate a company’s fair value instantly (Free with TIKR) >>>
Expectations Versus Reality
The primary risk in forward modeling is the “hockey stick” projection. This occurs when analysts model flat growth for two years followed by a sudden explosion in profitability. These outer-year estimates are often placeholders.
Focus your conviction on the numbers closest to the present. Always be skeptical of growth that deviates significantly from a company’s historical capabilities or its competitors.
The TIKR Takeaway
Markets move based on what happens next. You do not need complex spreadsheets to model the future. By using TIKR to access consensus estimates and tracking how those expectations evolve, you can value businesses based on where they are going, giving you a distinct edge over investors who focus solely on the past.
Find undervalued stocks in less than 60 seconds with TIKR’s new Valuation Model (It’s free) >>>
Value Any Stock in Under 60 Seconds with TIKR
With TIKR’s new Valuation Model tool, you can estimate a stock’s potential share price in under a minute.
All it takes is three simple inputs:
- Revenue Growth
- Operating Margins
- Exit P/E Multiple
If you’re not sure what to enter, TIKR automatically fills in each input using analysts’ consensus estimates, giving you a quick, reliable starting point.
From there, TIKR calculates the potential share price and total returns under Bull, Base, and Bear scenarios so you can quickly see whether a stock looks undervalued or overvalued.
Find out what your favorite stocks are really worth (Free with TIKR) >>>
Looking for New Opportunities?
- Discover which stocks billionaire investors are purchasing, so you can follow the smart money.
- Analyze stocks in as little as 5 minutes with TIKR’s all-in-one, easy-to-use platform.
- The more rocks you overturn… the more opportunities you’ll uncover. Search 100K+ global stocks, global top investor holdings, and more with TIKR.
Disclaimer:
Please note that the articles on TIKR are not intended to serve as investment or financial advice from TIKR or our content team, nor are they recommendations to buy or sell any stocks. We create our content based on TIKR Terminal’s investment data and analysts’ estimates. Our analysis might not include recent company news or important updates. TIKR has no position in any stocks mentioned. Thank you for reading, and happy investing!