

Key Takeaways:
- Revenue Trajectory: Revenue growth of 7% supports steady expansion from premium coffee machines and professional channels which reinforces scale benefits in a branded consumer appliances portfolio.
- Margin Profile: Operating margins of 13% reflect improved product mix and pricing discipline, lifting profitability above the 10% historical average.
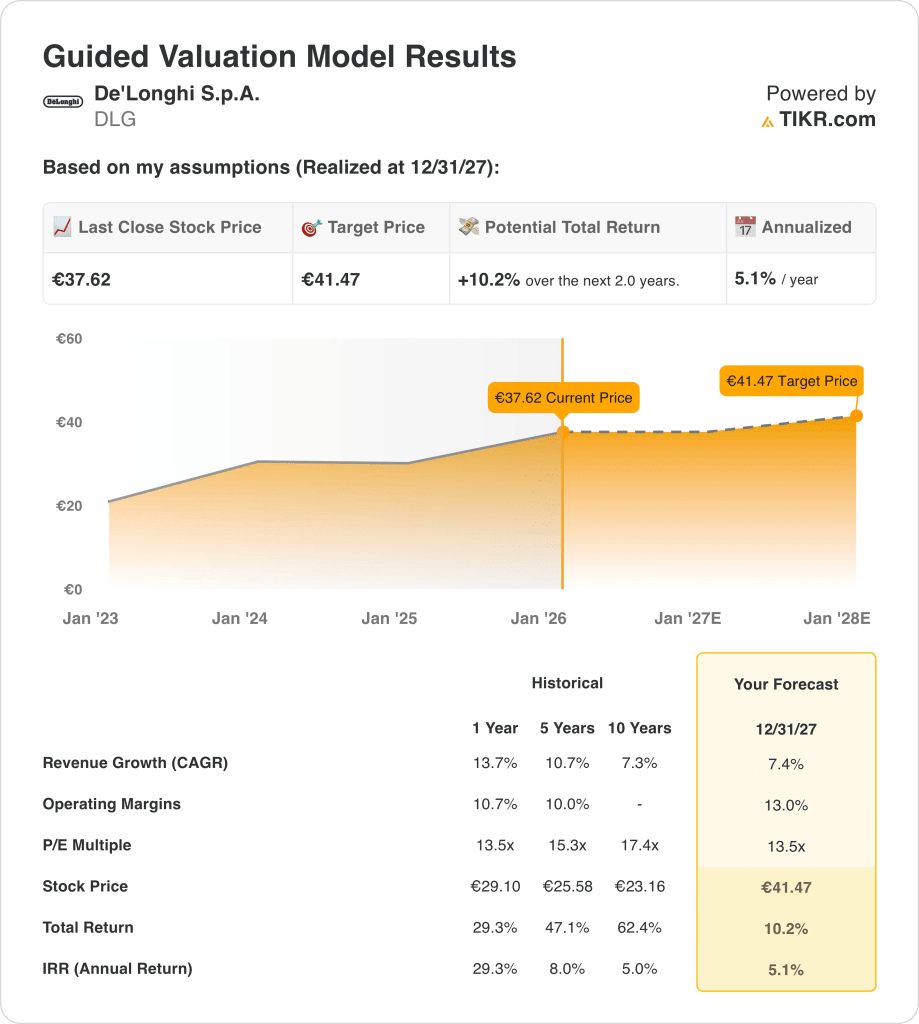
- Price Target: The valuation model points to a €41 price target by 2027, based on earnings growth rather than changes in valuation multiples.
- Return Outlook: From a current price of €38, the model implies 10% total upside or roughly 5% annualized returns over the next two years.
De’Longhi S.p.A. (DLG) designs and sells coffee machines and small domestic appliances and generated €3.5 billion in 2024 revenue across Europe, the Americas, and Asia through globally recognized consumer brands.
De’Longhi gained broader market attention after joining the STOXX Europe 600 in December 2025, which increases trading activity and index fund ownership without changing how the business operates.
Here’s a clearer and more direct version:
In the first nine months of 2025, De’Longhi generated €2.5 billion in revenue, up 10% compared with the same period in 2024, mainly because more customers bought premium coffee machines and professional products.
The company’s adjusted EBITDA reached about €560 million in 2024 which translates into operating margins of roughly 11% as pricing strength and cost discipline held up in a competitive consumer market.
Even as revenue and margins improve, the stock trades near 14x earnings, leaving open whether current valuation fully reflects De’Longhi’s ability to sustain premium positioning and margin expansion.
What the Model Says for DLG Stock
The model links De’Longhi’s results to steady premium appliance demand, cost control, and global brand positioning rather than aggressive expansion or valuation re-rating.
Using 7.4% revenue growth, 13.0% operating margins, and a 13.5× exit multiple, the valuation reflects normalized earnings quality and modest capital appreciation.
The model estimates a €41.47 target price, equal to a 10% total return, or about 5% per year, over the next two years.
Our Valuation Assumptions
TIKR’s Valuation Model lets you plug in your own assumptions for a company’s revenue growth, operating margins, and P/E multiple, and calculates the stock’s expected returns.
Here’s what we used for DLG stock:
1. Revenue Growth: 7.4%
De’Longhi delivered revenue growth of 14% over the past year and 11% over five years, supported by premium coffee machines and broad geographic exposure across Europe and the Americas.
Recent performance shows demand normalizing after strong post-pandemic growth, with nine-month 2025 revenue up 10% year over year to €2.5 billion as volumes stabilized.
Future growth comes mainly from stronger sales of premium home coffee machines and early growth in the professional segment, partly offset by weaker consumer spending cycles.
Analysts expect revenue to grow 7.4%, reflecting steady demand after recent volatility and continued strength in higher-end appliances.
2. Operating Margins: 13%
De’Longhi’s operating margins averaged about 11% over the past year and 10% over five years, reflecting competitive consumer markets and disciplined cost control.
Adjusted EBITDA was about €560 million in 2024, showing margins are improving as better pricing and product mix helped absorb higher logistics and input costs.
Margins are improving because more customers are buying higher-end coffee machines, production is becoming more efficient, and professional products carry higher margins.
Analysts also expect operating margins of 13.0%, which aligns with past efficiency levels without relying on major cost cuts or price increases.
3. Exit P/E Multiple: 13.5x
De’Longhi currently trades near a 13.5x earnings multiple, below its 10-year average of about 17x, reflecting investor caution toward consumer discretionary demand.
Historically, higher valuation periods coincided with stronger volume growth and broader consumer spending tailwinds, which are more muted in the current environment.
A stable earnings profile, consistent dividends, and index inclusion improve visibility, but valuation discipline remains given cyclical exposure to household spending.
Market estimates use a 13.5x earnings multiple, showing expectations for stable performance rather than a return to past peak valuations.
What Happens If Things Go Better or Worse?
De’Longhi’s outcomes depend on demand for premium coffee machines, execution in the professional segment, and cost control, creating a range of possible paths through 2029.
- Low Case: If consumer demand stays soft and professional sales scale slowly, revenue grows around 4.9%, net income margins stay near 8.9%, and valuation remains pressured, leaving returns driven mainly by earnings stability → -0.4% annualized return.
- Mid Case: With core coffee demand holding up and professional products growing steadily, revenue growth near 5.5%, margins improving toward 9.6%, and stable valuation support balanced earnings growth → 5.0% annualized return.
- High Case: If premium coffee demand strengthens and the professional segment scales faster, revenue reaches about 6.0%, margins approach 10.1%, and valuation pressure eases, allowing stronger price appreciation → 9.6% annualized return.
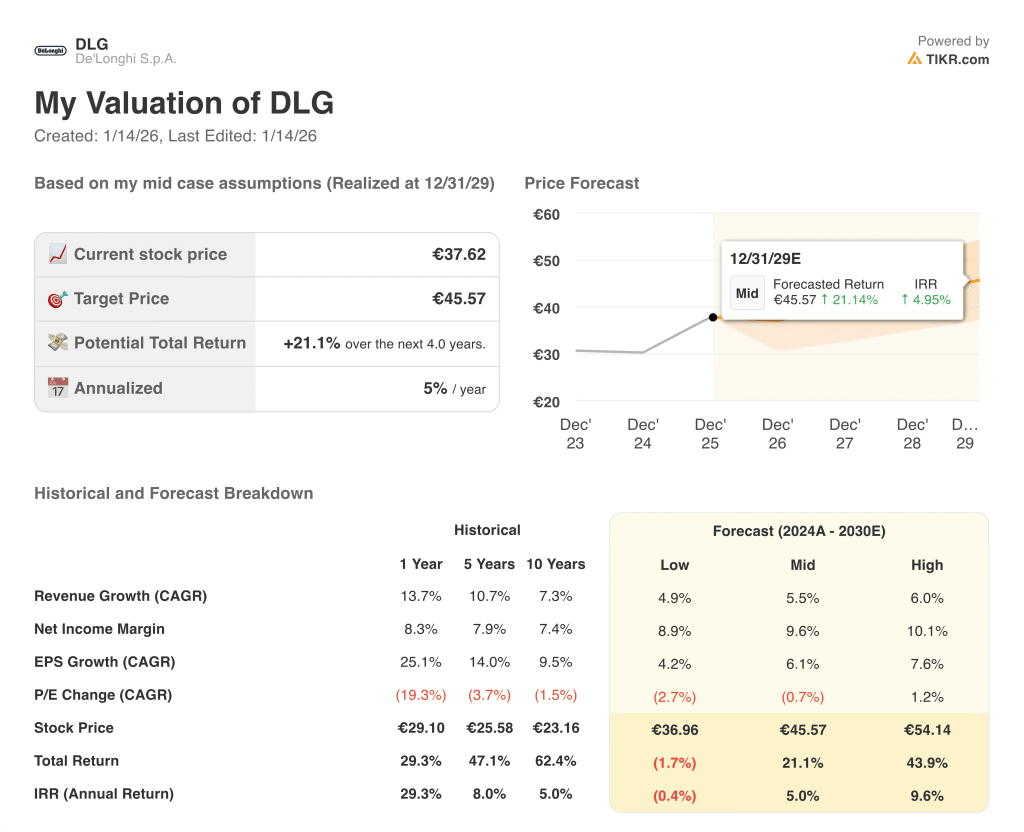
Execution in premium coffee, cost control, and steady growth in the professional segment support the €45.57 target price by 2029 through normal growth and margin improvement, without needing valuation expansion or market hype.
How Much Upside Does It Have From Here?
With TIKR’s new Valuation Model tool, you can estimate a stock’s potential share price in under a minute.
All it takes is three simple inputs:
- Revenue Growth
- Operating Margins
- Exit P/E multiple
If you’re not sure what to enter, TIKR automatically fills in each input using analysts’ consensus estimates, giving you a quick, reliable starting point.
From there, TIKR calculates the potential share price and total returns under Bull, Base, and Bear scenarios so you can quickly see whether a stock looks undervalued or overvalued.
Looking for New Opportunities?
- See what stocks billionaire investors are buying so you can follow the smart money.
- Analyze stocks in as little as 5 minutes with TIKR’s all-in-one, easy-to-use platform.
- The more rocks you overturn… the more opportunities you’ll uncover. Search 100K+ global stocks, global top investor holdings, and more with TIKR.
Disclaimer:
Please note that the articles on TIKR are not intended to serve as investment or financial advice from TIKR or our content team, nor are they recommendations to buy or sell any stocks. We create our content based on TIKR Terminal’s investment data and analysts’ estimates. Our analysis might not include recent company news or important updates. TIKR has no position in any stocks mentioned. Thank you for reading, and happy investing!


