

Key Stats
- Current price: ~$61 (as of April 30, 2026)
- Q1 2026 revenue: $5.1B, up 7% YoY (reported); 2.9% organic growth
- Q1 2026 adjusted EPS: $0.99, including ~$0.16 of tariff impact
- Record backlog: $21.8B, up $1.2B YoY
- Full-year 2026 revenue guidance: 3% to 4% organic growth (maintained)
- Full-year 2026 adjusted EPS guidance: $4.80 to $5.00 (reduced from prior guidance; ~5% to 9% growth YoY)
- Full-year 2026 adjusted EBIT margin guidance: 15.4% to 15.7%
- TIKR model price target: $81
- Implied upside: ~32% from current price
GE HealthCare Stock Earnings Breakdown: Q1 2026
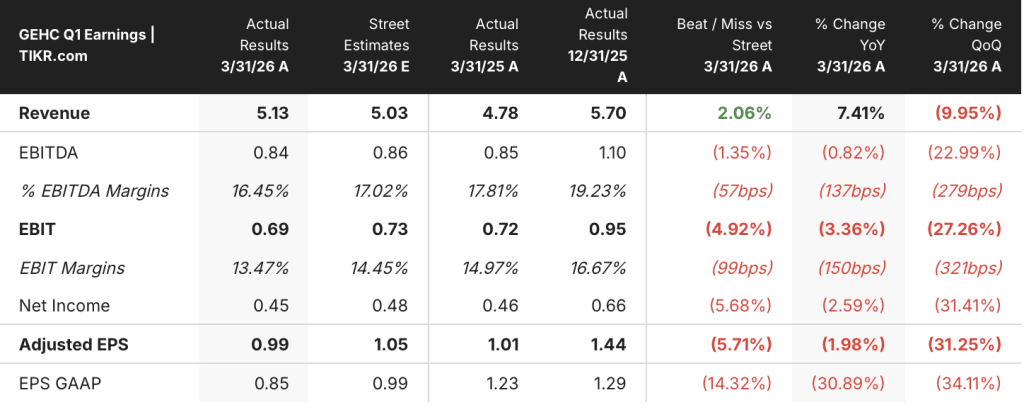
GE HealthCare stock (GEHC) delivered Q1 2026 revenue of $5.1B, representing 2.9% organic growth and coming in at the high end of management’s expectations, while adjusted EPS of $0.99 fell below the prior-year quarter’s $1.01.
Pharmaceutical Diagnostics was the standout segment, posting 9.7% organic revenue growth driven by global strength in contrast media, price execution, and accelerating demand across the radiopharmaceutical portfolio, according to CFO Jay Saccaro on the Q1 2026 earnings call.
Advanced Visualization Solutions delivered 4.4% organic revenue growth with EBIT margin expanding 120 basis points YoY, driven by volume and contract settlements, partially offset by tariff costs, according to Saccaro on the Q1 2026 earnings call.
Imaging grew organic revenue 3.8% YoY with robust performance in CT and x-ray, though EBIT declined year-over-year due to tariff expenses; excluding tariffs, Imaging margins would have been accretive YoY, according to Saccaro on the Q1 2026 earnings call.
Patient Care Solutions was the clear drag, with organic revenue declining 8.1% YoY and segment EBIT margin falling 500 basis points, primarily reflecting lower volumes from large monitoring installations concentrated in the second half of the year and tariff pressure.
GE HealthCare stock’s adjusted EBIT margin came in at 13.5%, down approximately 150 basis points YoY, with the quarter absorbing the largest expected tariff impact of 2026, a PDx supplier quality issue worth approximately $0.05 per share, and early-stage inflation on memory chips, oil, and freight.
The inflation headwind is the more consequential development: management identified approximately $250M in gross inflation exposure for the full year, split roughly between a ~$100M memory chip cost increase, ~$100M in oil and freight, and ~$50M in other commodities including tungsten, according to Arduini and Saccaro on the Q1 2026 earnings call.
GE HealthCare stock’s full-year adjusted EPS guidance was reduced to $4.80 to $5.00, down $0.15 from prior expectations, with management targeting mitigation of more than half the inflation impact through pricing and cost actions; full-year organic revenue guidance of 3% to 4% was maintained.
The company repurchased approximately $100M of shares and repaid $500M of debt in Q1, while closing the Intelerad acquisition and exiting the quarter with a record $21.8B backlog.
GE HealthCare Stock Financials: Margin Compression Deepens in Q1
The Q1 2026 income statement tells a margin compression story that has been building since the company’s gross margin peaked at 42.8% in Q4 2024 and has declined in every quarter since.
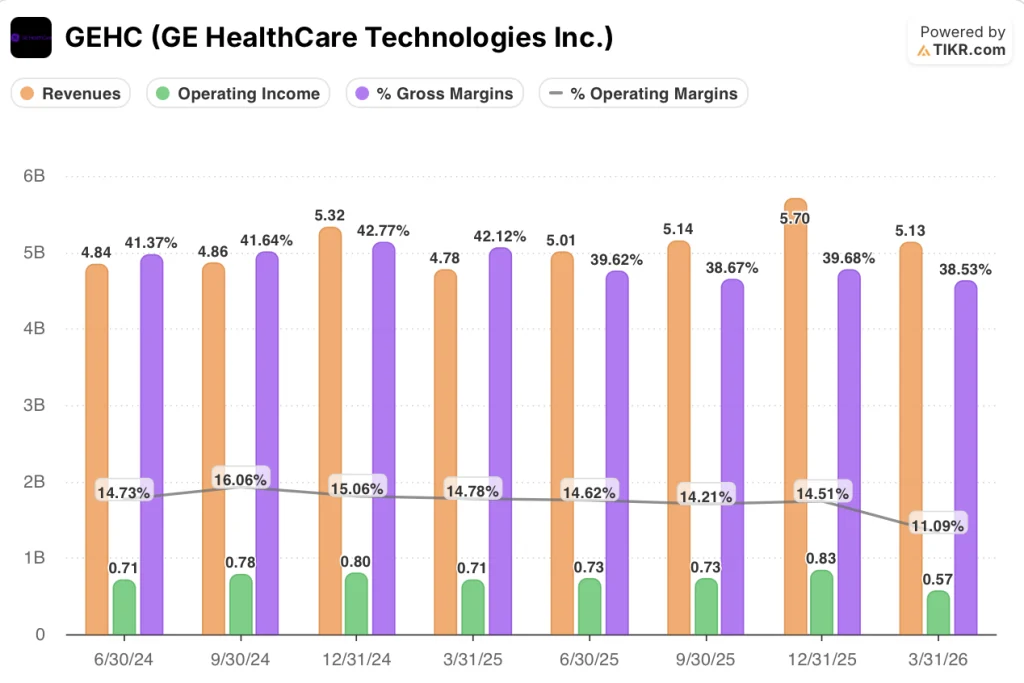
Revenue has followed an accelerating YoY growth trajectory over the past five quarters, rising from 2.7% growth in Q1 2025 to 7.4% in Q1 2026, even as the sequential step-down from $5.7B in Q4 2025 to $5.1B in Q1 2026 reflects typical seasonal softness.
Gross margin came in at 38.5% in Q1 2026, down from 42.1% in Q1 2025, continuing a trend of compression that has now seen gross profit fall for three consecutive quarters on a YoY basis, down 1.7% in Q1 2026 from $2.01B in Q1 2025 to $1.98B.
Operating income was $570M in Q1 2026, down 19% from $710M in Q1 2025, and operating margin fell to 11.1% from 14.8% in the prior-year quarter.
The sequential deterioration is equally notable: operating margin was 14.5% as recently as Q4 2025, meaning GE HealthCare stock has shed more than 300 basis points of operating margin in a single quarter.
Management guided full-year adjusted EBIT margin to 15.4% to 15.7%, representing only 10 to 40 basis points of YoY expansion, with the recovery concentrated in Q3 and Q4 as pricing actions and cost mitigation begin to take effect, according to Saccaro on the Q1 2026 earnings call.
What Does the Valuation Model Say?
The TIKR model prices GE HealthCare stock at a target of $80.52, implying roughly 32% upside from the current ~$61 price over a 4.7-year horizon.
The model assumes a revenue CAGR of 3.7% (mid case) and a net income margin of 11.2%, scenarios that reflect gradual but steady improvement from the current 10.5% trailing net income margin.
The Q1 result complicates the near-term path to those assumptions: a $0.15 EPS guidance cut, a full-year operating margin ceiling of 15.7%, and inflation headwinds that won’t fully clear until 2027 all create a credible drag on the earnings base the model is discounting.
The investment case for GE HealthCare stock is not broken, but it is more back-loaded than it appeared entering the year: the model’s upside depends on execution through an inflationary 2026 and delivery of a new product cycle that management has consistently pushed to first-half 2027.

GE HealthCare stock’s investment case now hinges on whether a 2027 product cycle can justify holding through a year of guided margin pressure and reduced earnings.
What Has to Go Right
- Pricing actions take hold in H2 2026, enabling EBIT margin recovery toward the guided 15.4% to 15.7% range and laying the foundation for the model’s 11.2% net income margin assumption
- Photonova Spectra, GE’s photon-counting CT platform cleared in the U.S. and Japan, converts its $100M+ pipeline into revenue beginning in H1 2027
- Flyrcado ramp accelerates from 390 weekly doses (week ended April 17) toward the $500M annual revenue target by 2028, sustaining PDx as the highest-growth segment
- The $21.8B record backlog converts at plan in H2 2026, supporting the 3% to 4% organic revenue guidance and validating book-to-bill of 1.07x
What Could Still Go Wrong
- Inflation assumptions prove conservative: management modeled $250M gross impact holding at current elevated levels, but any further increase in memory chip or freight costs before H2 pricing actions take effect would compress earnings further
- Patient Care Solutions underperformance persists beyond Q1: organic revenue declined 8.1% YoY with EBIT margin down 500 basis points, and the anesthesia product clearance expected in Q3 carries execution risk
- China revenue remains pressured: management guided China sales down YoY for 2026, and any incremental deterioration in geopolitical conditions or local competition could widen that gap
- NPI revenue contribution delayed past H1 2027: management has consistently emphasized that imaging new product revenue begins in early 2027, and any further timeline slip would extend the duration investors must hold through before the product cycle pays off
Should You Invest in GE HealthCare Technologies Inc.?
The only way to really know is to look at the numbers yourself. TIKR gives you free access to the same institutional-quality financial data that professional analysts use to answer exactly that question.
Pull up GEHC stock and you’ll see years of historical financials, what Wall Street analysts expect for revenue and earnings in the quarters ahead, how valuation multiples have moved over time, and whether price targets are trending up or down.
You can build a free watchlist to track GE HealthCare Technologies Inc. alongside every other stock on your radar. No credit card required. Just the data you need to decide for yourself.
Access Professional Tools to Analyze GEHC stock on TIKR for Free →


