Key Stats: Amazon.com, Inc. (AMZN)
- Current Price: $249
- 52-Week High: $259
- 52-Week Low: $165
- Market Cap: $2.67 trillion
- Analyst Mean Target: $281
- Analyst Consensus: 49 Buys, 14 Outperforms, 5 Holds
- TIKR Mid-Case Target for Dec. 2030: $565
Amazon Stock’s P/E: What the Numbers Finally Mean
Amazon stock (AMZN) currently trades at a trailing P/E of 34.66x and a forward P/E of 32.12x.
The forward multiple sitting below the trailing figure signals that Wall Street expects earnings to grow faster than the stock price, pricing in continued margin expansion from a business that only recently started producing the kind of consistent net income that makes a P/E ratio worth reading.
For most of Amazon’s history as a public company, the P/E was noise. It is not noise anymore.
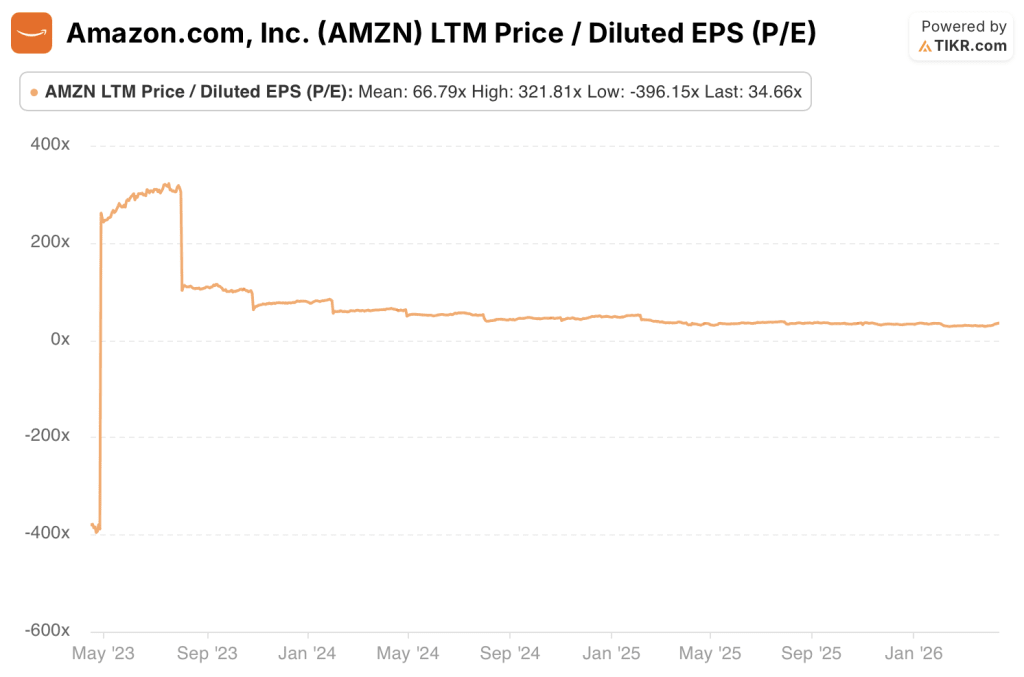
Amazon Stock P/E History: One Year
Over the past year, Amazon stock’s trailing P/E ranged from a low of 27.73x to a high of 37.93x, with a mean of 33.14x.
The current reading of 34.66x sits slightly above the 1-year average, reflecting the stock’s recovery from the February 2026 selloff that briefly pushed the multiple toward the low end of its recent range.

What the 1-year range reveals is a market that has settled into a new valuation regime for Amazon stock: a consumer and cloud business generating consistent earnings at scale, priced like a high-quality compounder rather than the speculative growth vehicle it was for most of the 2010s.
The 10-point range from trough to peak over the past 12 months is remarkably tight by Amazon’s historical standards.
Amazon Stock P/E History: Three Years
The 3-year picture tells a different story. Amazon stock’s trailing P/E ranged from a low of -396.15x to a high of 321.81x over this period, with a mean of 66.79x.
The wild swing is not a data error. It reflects the 2022 net loss, when Amazon reported a GAAP net loss driven in part by its Rivian investment writedown, sending the trailing P/E deeply negative.
What followed was one of the most dramatic earnings recoveries in large-cap history, as operating income exploded from $13.35 billion in 2022 to $80 billion in 2025.
The 3-year chart shows the moment the multiple went from unreadable to rational.
By mid-2023, as the 2022 loss rolled off the trailing twelve-month window and the cost-cutting era’s results flowed through, the P/E collapsed from triple digits to double digits in a matter of months.
The current 34.66x is not a compression from elevated levels. It is a stabilization after a normalization event.
Amazon Stock P/E History: Five Years
Over five years, the trailing P/E ranged from -418.19x to 321.81x, with a mean of 51.27x.
The 5-year window captures the full arc: the elevated but at least positive multiples of 2021 when Amazon was still reinvesting aggressively, the collapse into negative territory in 2022, the violent re-rating in 2023, and the gradual compression to a rational range in 2024 and 2025.
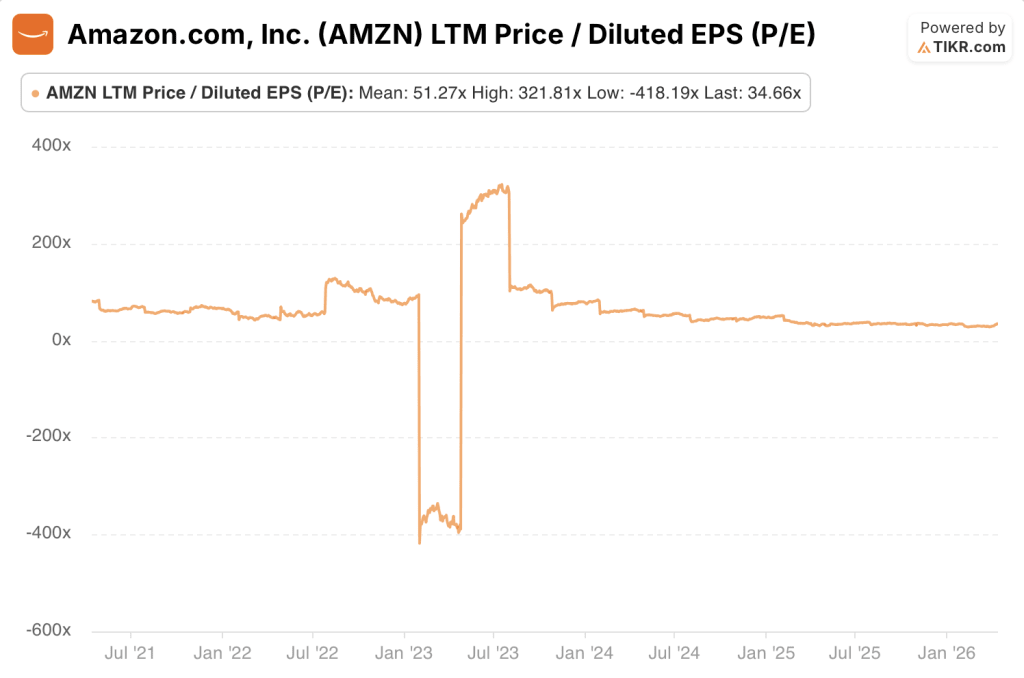
The 5-year mean of 51.27x is essentially meaningless as a benchmark because it blends two completely different versions of Amazon stock: the pre-margin-expansion era and the post-restructuring era.
Any investor using the 5-year average P/E to judge whether the stock is cheap or expensive is comparing today’s Amazon to a company that no longer exists.
Amazon Stock P/E History: Ten Years
The 10-year trailing P/E ranged from a low of -418.19x to a high of 508.28x, with a mean of 105.15x.
A triple-digit 10-year average P/E is the signature of a company that spent a decade deliberately making its earnings unreadable.
Amazon’s management was explicit about this: they would sacrifice near-term profitability to reinvest in fulfillment infrastructure, AWS capacity, advertising technology, and international expansion.
For investors who understood the strategy, the P/E was irrelevant. For those who relied on it, Amazon stock looked perpetually overvalued.
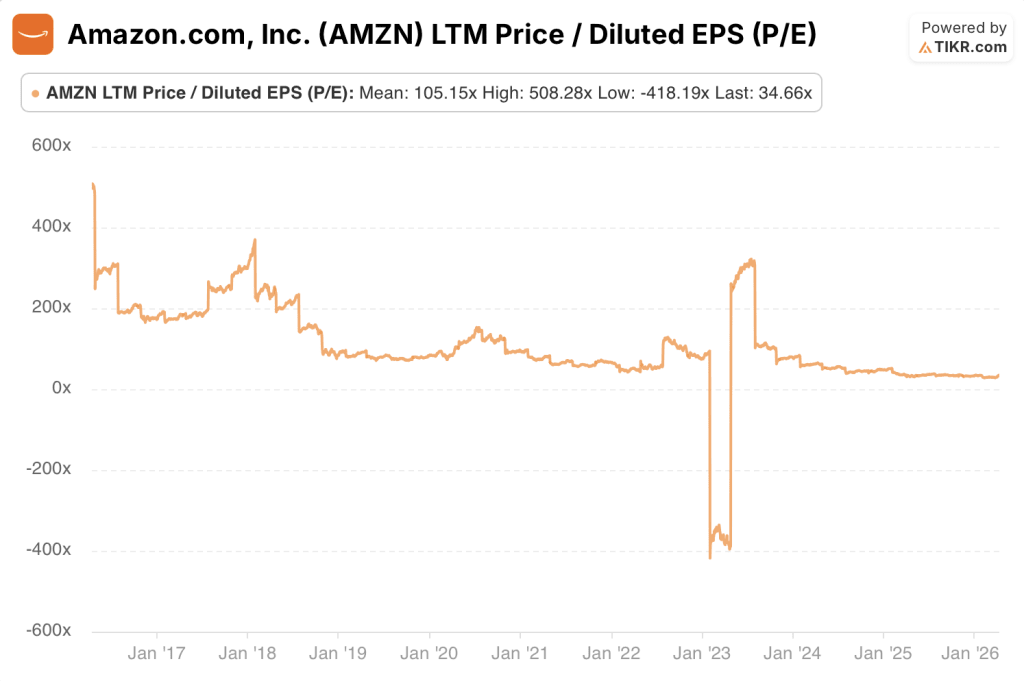
The 10-year chart shows the inflection clearly. From 2016 through 2021, the P/E was elevated but at least positive, generally ranging between 60x and 150x as Amazon generated thin but real earnings while reinvesting at maximum velocity.
Then came 2022, then the normalization. Where the line sits today, compressed against the bottom of the chart’s range, is not weakness. It is maturity.
Why Amazon’s P/E Was Misleading for a Decade (and What It Means Now)
For most of Amazon’s history as a high-growth company, the trailing P/E was the wrong tool for the job.
Amazon’s management made a deliberate and consistent choice to reinvest every dollar of operating cash flow back into the business: building fulfillment centers, subsidizing AWS infrastructure, funding international expansion, and developing advertising technology that would not monetize at scale for years.
The result was an income statement that showed thin or negative net income even as the underlying business was compounding enormously in revenue, market share, and strategic position.
A 10-year mean P/E of 105.15x did not mean the stock was overvalued. It meant the metric was measuring the wrong thing.
The 2022 net loss was the extreme version of this dynamic, but it had a different cause. Amazon over-hired and over-expanded during the pandemic-era demand surge, then faced a demand normalization at exactly the moment its cost base was at peak.
The GAAP net loss that year was amplified by the Rivian investment writedown, a one-time mark that had nothing to do with operating performance.
The P/E going negative was the metric finally breaking under the weight of a business that had never been designed to optimize for reported earnings.
What followed from 2023 onward was a structural shift, not a cyclical rebound.

Amazon’s cost discipline was real: operating income grew from $13.35 billion in 2022 to $36.85 billion in 2023, then $68.59 billion in 2024, then $79.98 billion in 2025. Operating margins expanded from 2.6% to 11.2% over that same window. Gross margins hit 50% in 2025, up from 42% in 2021.
These are not the results of a one-time restructuring. They reflect AWS reaching the scale where its economics dominate the consolidated P&L, advertising becoming a high-margin growth engine, and the fulfillment network finally running at optimized efficiency after years of overcapacity.
The current trailing P/E of 34.66x and forward P/E of 32.12x deserve to be read at face value. Amazon stock is now priced as a business with real, recurring, growing earnings power. The 1-year mean of 33.14x suggests the market has consensus around this range.
The question for investors is not whether the P/E is useful, it now clearly is, but whether 34x earnings is the right price for a business growing EPS at 30% over the past year with a $142 billion annualized AWS run rate accelerating at 24% growth.
TIKR’s Valuation Model Take on Amazon Stock
TIKR’s valuation model prices Amazon stock at a mid-case target of around $565, representing a potential total return of around 128% from the current price of $249 at a 19% annualized IRR over the next 5 years.
The model assumes a revenue growth CAGR of around 11% and net income margins expanding to 15% by 2035.
At those assumptions, Amazon stock appears undervalued at current levels, with the market pricing in a significantly more conservative earnings trajectory than the model’s mid-case implies.

The range of outcomes is wide. The low-case target of around $614 implies a 147% total return at an 11% IRR, still a meaningful premium to today’s price.
The high-case target of around $1,060 implies a 327% total return at an 18% IRR, anchored to a 12% revenue CAGR and net income margins reaching around 16%.
The fact that even the low-case scenario implies more than a double from current levels reflects how much earnings power the model sees flowing through the P&L over the next decade as AWS and advertising scale.
The central tension the model surfaces is not whether Amazon grows, but whether the $200 billion capex cycle translates into the margin profile the mid-case assumes.
A 15% net income margin by 2035 requires AWS to sustain growth above 20%, advertising to continue taking share of total revenue, and the fulfillment network to hold its cost efficiency gains.
If any of those three legs wobbles, the mid-case compresses toward the low-case.
The IRR gap between low and high, 11% versus 18%, captures exactly that range of execution risk.
Bull Case: Amazon Stock
AWS re-acceleration at scale makes the current multiple look understated. AWS grew 24% year-over-year in Q4 2025 to $35.6 billion in quarterly revenue, its fastest growth rate in 13 quarters, on an annualized run rate of $142 billion.
AWS operating income was $12.5 billion in Q4 at a 35% margin and the business carries a committed backlog of $244 billion, up 40% year-over-year.
If AWS sustains even 20% growth through 2026 and 2027 while maintaining margins above 30%, AWS alone justifies the current enterprise valuation, with retail and advertising as additional upside.
Advertising is a high-margin growth engine that the market is still underpricing.
Amazon’s advertising segment generated $21.3 billion in Q4 2025 revenue, up 22% year-over-year, adding over $12 billion of incremental revenue in 2025 alone.
Advertising carries structurally higher margins than retail and sits on a base of 315 million average monthly Prime Video ad-supported viewers globally, up from 200 million in early 2024. As advertising grows as a share of total revenue, it pulls consolidated operating margins higher, compressing the P/E further even if the stock price holds flat.

Margin expansion has structural runway and the forward estimates confirm it.
Operating margins expanded from 2.6% in 2022 to 11.2% in 2025, and EBITDA margins are estimated to expand further from ~24% in 2025 to 26% in 2026 and around 29% in 2027.

EPS is estimated to grow from $7.17 in 2025 to $7.73 in 2026 and $9.4 in 2027, a 31% two-year step-up that means the forward P/E compresses to roughly 26x on 2027 estimates at the current stock price.
If earnings continue growing faster than the stock price, the P/E reaches a level where Amazon stock looks unambiguously cheap relative to its growth rate, without requiring any multiple expansion at all.
Custom silicon gives Amazon a structural cost advantage compounding in the income statement.
Trainium2 is 30% to 40% more price-performant than comparable GPUs, and the combined Graviton and Trainium chips business has crossed $10 billion in annualized revenue run rate growing triple digits year-over-year.
Graviton is used by over 90% of AWS’ top 1,000 customers. Lower inference costs from proprietary silicon protect AWS operating margins as AI competition intensifies, and those economics are not reflected in a trailing P/E multiple.
Bear Case: Amazon Stock
The $200 billion capex commitment is the central risk and the P/E does not show it.
Amazon guided approximately $200 billion in capital expenditures, predominantly in AWS, as it builds out AI infrastructure at unprecedented scale.

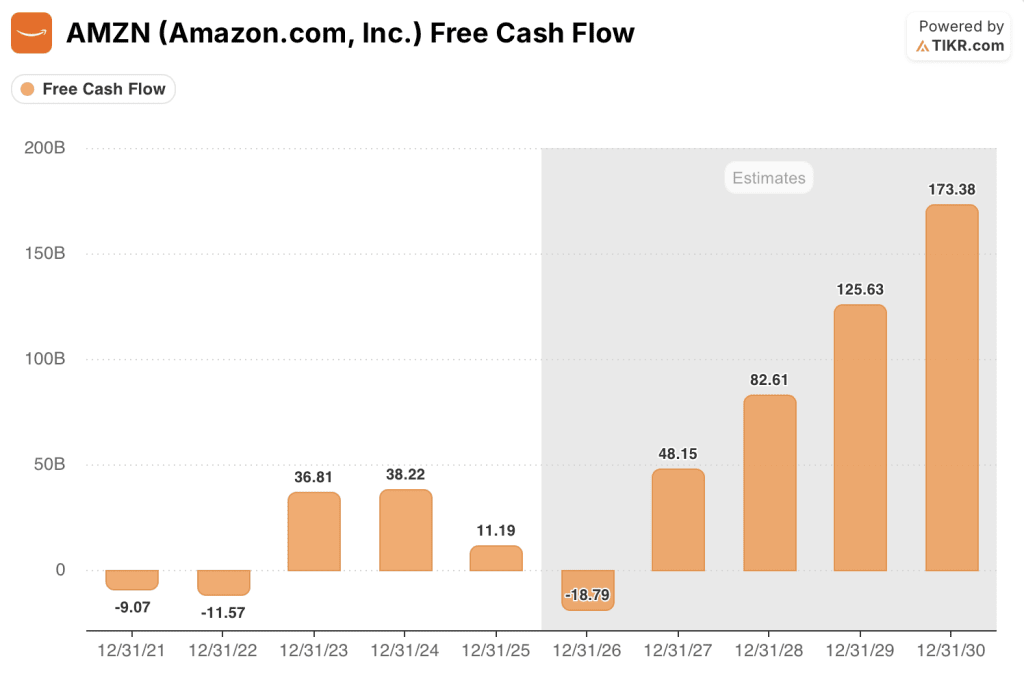
Free cash flow of $11.19 billion in 2025 is estimated to swing to -$18.79 billion in 2026 before recovering to $48.15 billion in 2027, a trajectory that reflects peak capex consumption hitting the cash flow statement in real time.
If AI demand does not materialize at the speed required to justify that spending, the 2027 recovery does not arrive on schedule, and the P/E of 34.66x is being supported by earnings that cost far more to generate than the multiple suggests.
Retail margins are structurally capped and limit consolidated upside.
North America segment operating margin was 9% in Q4 2025.
International segment operating margin was ~2%. Amazon competes explicitly on price, confirming it is America’s lowest-priced retailer for the ninth consecutive year at 14% cheaper than major online competitors on average.
A business that structurally competes on price has a ceiling on margin expansion, and the Amazon stock valuation depends on AWS and advertising pulling increasingly more of the earnings weight over time.
AWS growth could slow as hyperscaler competition intensifies.
AWS grew 24% in Q4 2025, but that acceleration followed several quarters of deceleration as enterprises optimized cloud spending.
Microsoft Azure and Google Cloud are investing aggressively in AI infrastructure and enterprise relationships. Amazon’s $244 billion backlog converts to revenue over multiple years, and enterprises retain the ability to shift workloads.
Any sustained deceleration in AWS growth below 20% would materially change the earnings trajectory that makes the current Amazon stock multiple defensible.
The margin expansion cycle may be closer to completion than continuation.
Operating margins expanded 860 basis points from 2022 to 2025. The easy gains from workforce rightsizing and fulfillment network optimization are largely realized.
The next leg requires AI monetization, advertising scale, and AWS efficiency gains to compound simultaneously and without interruption.
The 10-year average P/E of 105.15x reflects a market that rewarded Amazon’s growth story for years without demanding earnings. If earnings growth slows materially, investor patience with a 34x multiple is not guaranteed.
Why P/E Alone Is Not Enough for Amazon Stock
The P/E ratio is finally a useful tool for Amazon stock after years of being structurally broken by intentional reinvestment. But using it as the sole valuation metric still carries significant risk for one specific reason: Amazon’s reported earnings are being generated alongside one of the largest corporate investment cycles in modern history, and the P/E captures none of that.
The $200 billion capital expenditure commitment flows through the balance sheet as depreciation over time, not as an immediate income statement charge.
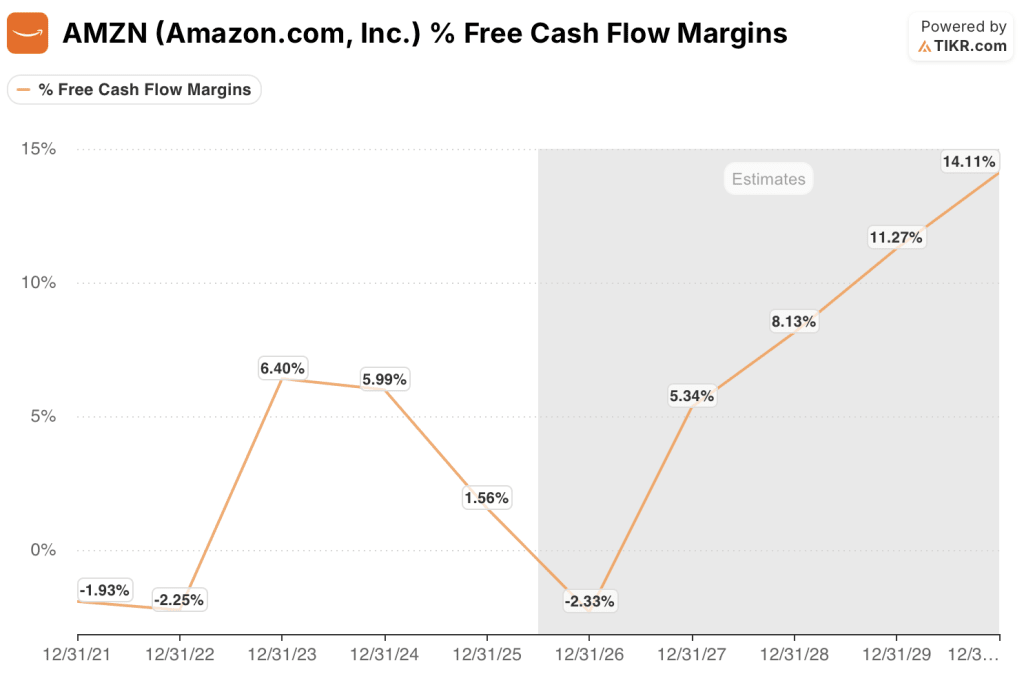
This means the trailing P/E of 34.66x looks stable even as Amazon’s free cash flow margin is estimated to go from 1.6% in 2025 to -2.3% in 2026 before recovering to 5.3% in 2027. The P/E shows stable earnings. The FCF margin shows a business in the middle of peak investment.
An investor relying only on the P/E has no visibility into that gap.
Two metrics belong alongside the P/E for any serious analysis of Amazon stock.

First, EV/EBITDA: Amazon’s LTM EV/EBITDA is 18.72x as of the most recent period, which captures the depreciation load from capex in a way the P/E does not and provides a cleaner comparison against Amazon’s own historical range and against cloud and e-commerce peers.
Second, free cash flow yield: NTM levered free cash flow is estimated at -$18.79 billion for 2026, a direct signal that the capex cycle is actively consuming cash even as reported earnings grow.
An investor tracking only the P/E would miss this entirely. TIKR’s valuation tab shows all three metrics side by side across any timeframe so investors can see the complete picture before making a decision.
Should You Invest in Amazon.com, Inc.?
The only way to really know is to look at the numbers yourself. TIKR gives you free access to the same institutional-quality financial data that professional analysts use to answer exactly that question.
Pull up Amazon stock and you’ll see years of historical valuation multiples, what Wall Street analysts expect for earnings and revenue in the quarters ahead, how P/E, EV/EBITDA, and FCF yield have moved over time, and whether the current multiple is elevated or compressed relative to history.
You can build a free watchlist to track Amazon alongside every other stock on your radar. No credit card required. Just the data you need to decide for yourself.
Access Professional Tools to Analyze AMZN stock on TIKR for Free →