
Valuation multiples are the most common shorthand investors use to assess whether a stock is cheap or expensive. A company trading at 15x earnings looks cheaper than one at 30x earnings. But that comparison means nothing without context.
Growth changes everything. A company growing earnings at 25% annually might deserve a 30x multiple. A company with flat earnings might be overvalued at 15x. The relationship between price, earnings, and growth is what separates intelligent valuation from superficial number crunching.
This approach to valuation is practical because it does not require building complex discounted cash flow models or making assumptions about terminal values decades into the future. Instead, you estimate how much a company will earn over the next few years, determine what multiple those earnings deserve, and compare the result to the current price. The math is simple. The judgment lies in making reasonable assumptions.
The challenge is that most investors skip the judgment part entirely. They see a low P/E and assume value. They see a high P/E and assume overvaluation. This shortcut ignores the fundamental question: what growth rate is the market pricing in, and is that expectation realistic? Answering that question is what transforms multiples from a screening tool into a valuation framework.
This guide explains how to use multiples and growth assumptions together to estimate a stock’s actual value, and how to pressure-test those estimates with free tools.
Why Multiples Alone Are Not Enough
A valuation multiple expresses price relative to a financial metric. The price-to-earnings ratio is the ratio of a stock’s price to its earnings per share. EV-to-EBITDA divides enterprise value by operating cash flow before depreciation. Price-to-sales compares the market cap to revenue.
These ratios are useful because they allow quick comparisons. You can instantly see that one company trades at 20x earnings while a competitor trades at 12x. But the multiple itself does not tell you which is the better investment.
The missing variable is growth. A stock trading at 25x earnings with 20% annual growth is fundamentally different from one at 25x with 5% growth. The first might be undervalued. The second might be expensive. Without factoring in how fast earnings will compound, multiples provide only a partial picture.
The goal is to connect today’s multiple to future earnings power. That requires making explicit assumptions about growth and understanding how those assumptions affect fair value.
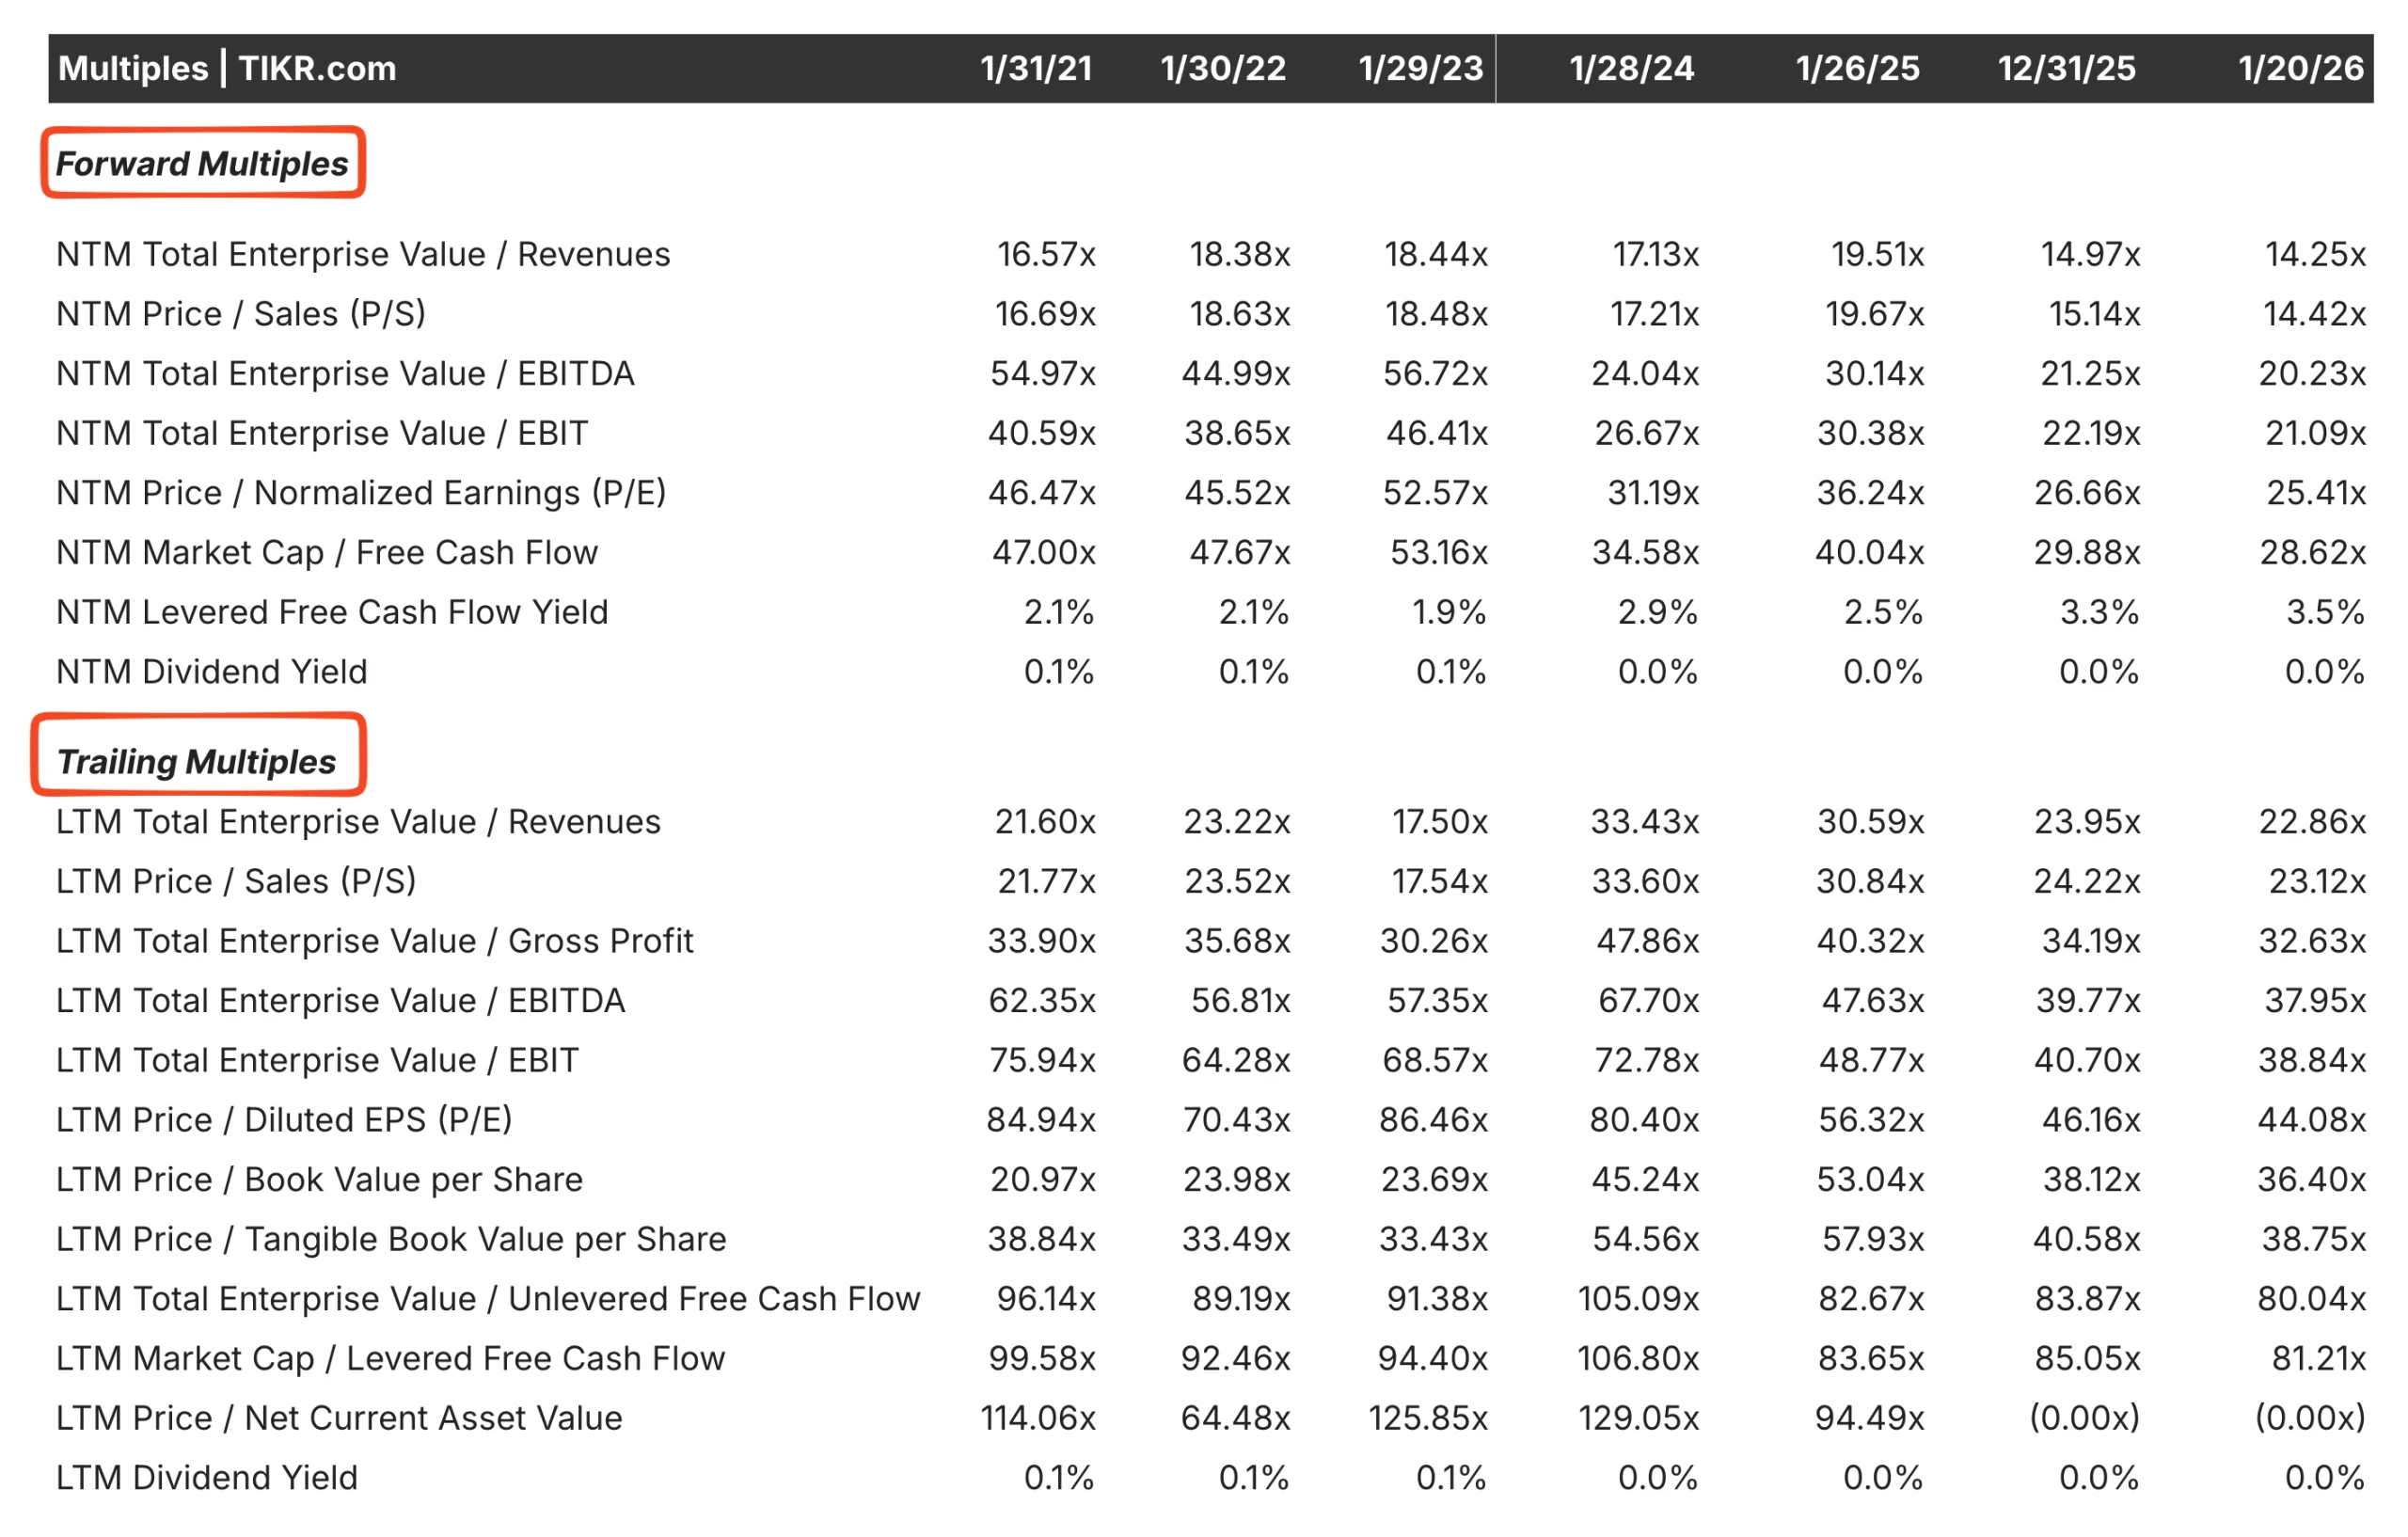
TIKR tip: Use TIKR’s Valuation tab to view both trailing and forward multiples. Forward multiples incorporate analyst growth estimates, giving you a starting point for understanding how the market prices future earnings.
The Core Multiples for Stock Valuation
Different multiples suit different situations. Understanding when to use each one improves the accuracy of your analysis.
Price-to-Earnings (P/E) is the most widely used multiple. It works well for profitable companies with stable earnings. A forward P/E based on next year’s estimated earnings is generally more useful than a trailing P/E because it reflects where the business is heading.
EV-to-EBITDA is often preferred for comparing companies with different capital structures. Because it uses enterprise value rather than market cap, it accounts for debt levels. This makes it particularly useful for capital-intensive industries or when evaluating acquisition targets.
Price-to-Sales (P/S) matters for companies that are not yet profitable or have volatile earnings. High-growth software companies often trade on revenue multiples because their earnings are suppressed by heavy investment. The risk is that revenue without profits can be misleading.
Price-to-Free-Cash-Flow focuses on actual cash generation rather than accounting earnings. This multiple is useful for mature businesses where cash flow is more stable and predictive than reported profits.
Each multiple has limitations. P/E can be distorted by one-time charges or accounting choices. EV/EBITDA ignores capital expenditure requirements. P/S ignores profitability entirely. Using multiple metrics together provides a more complete picture.
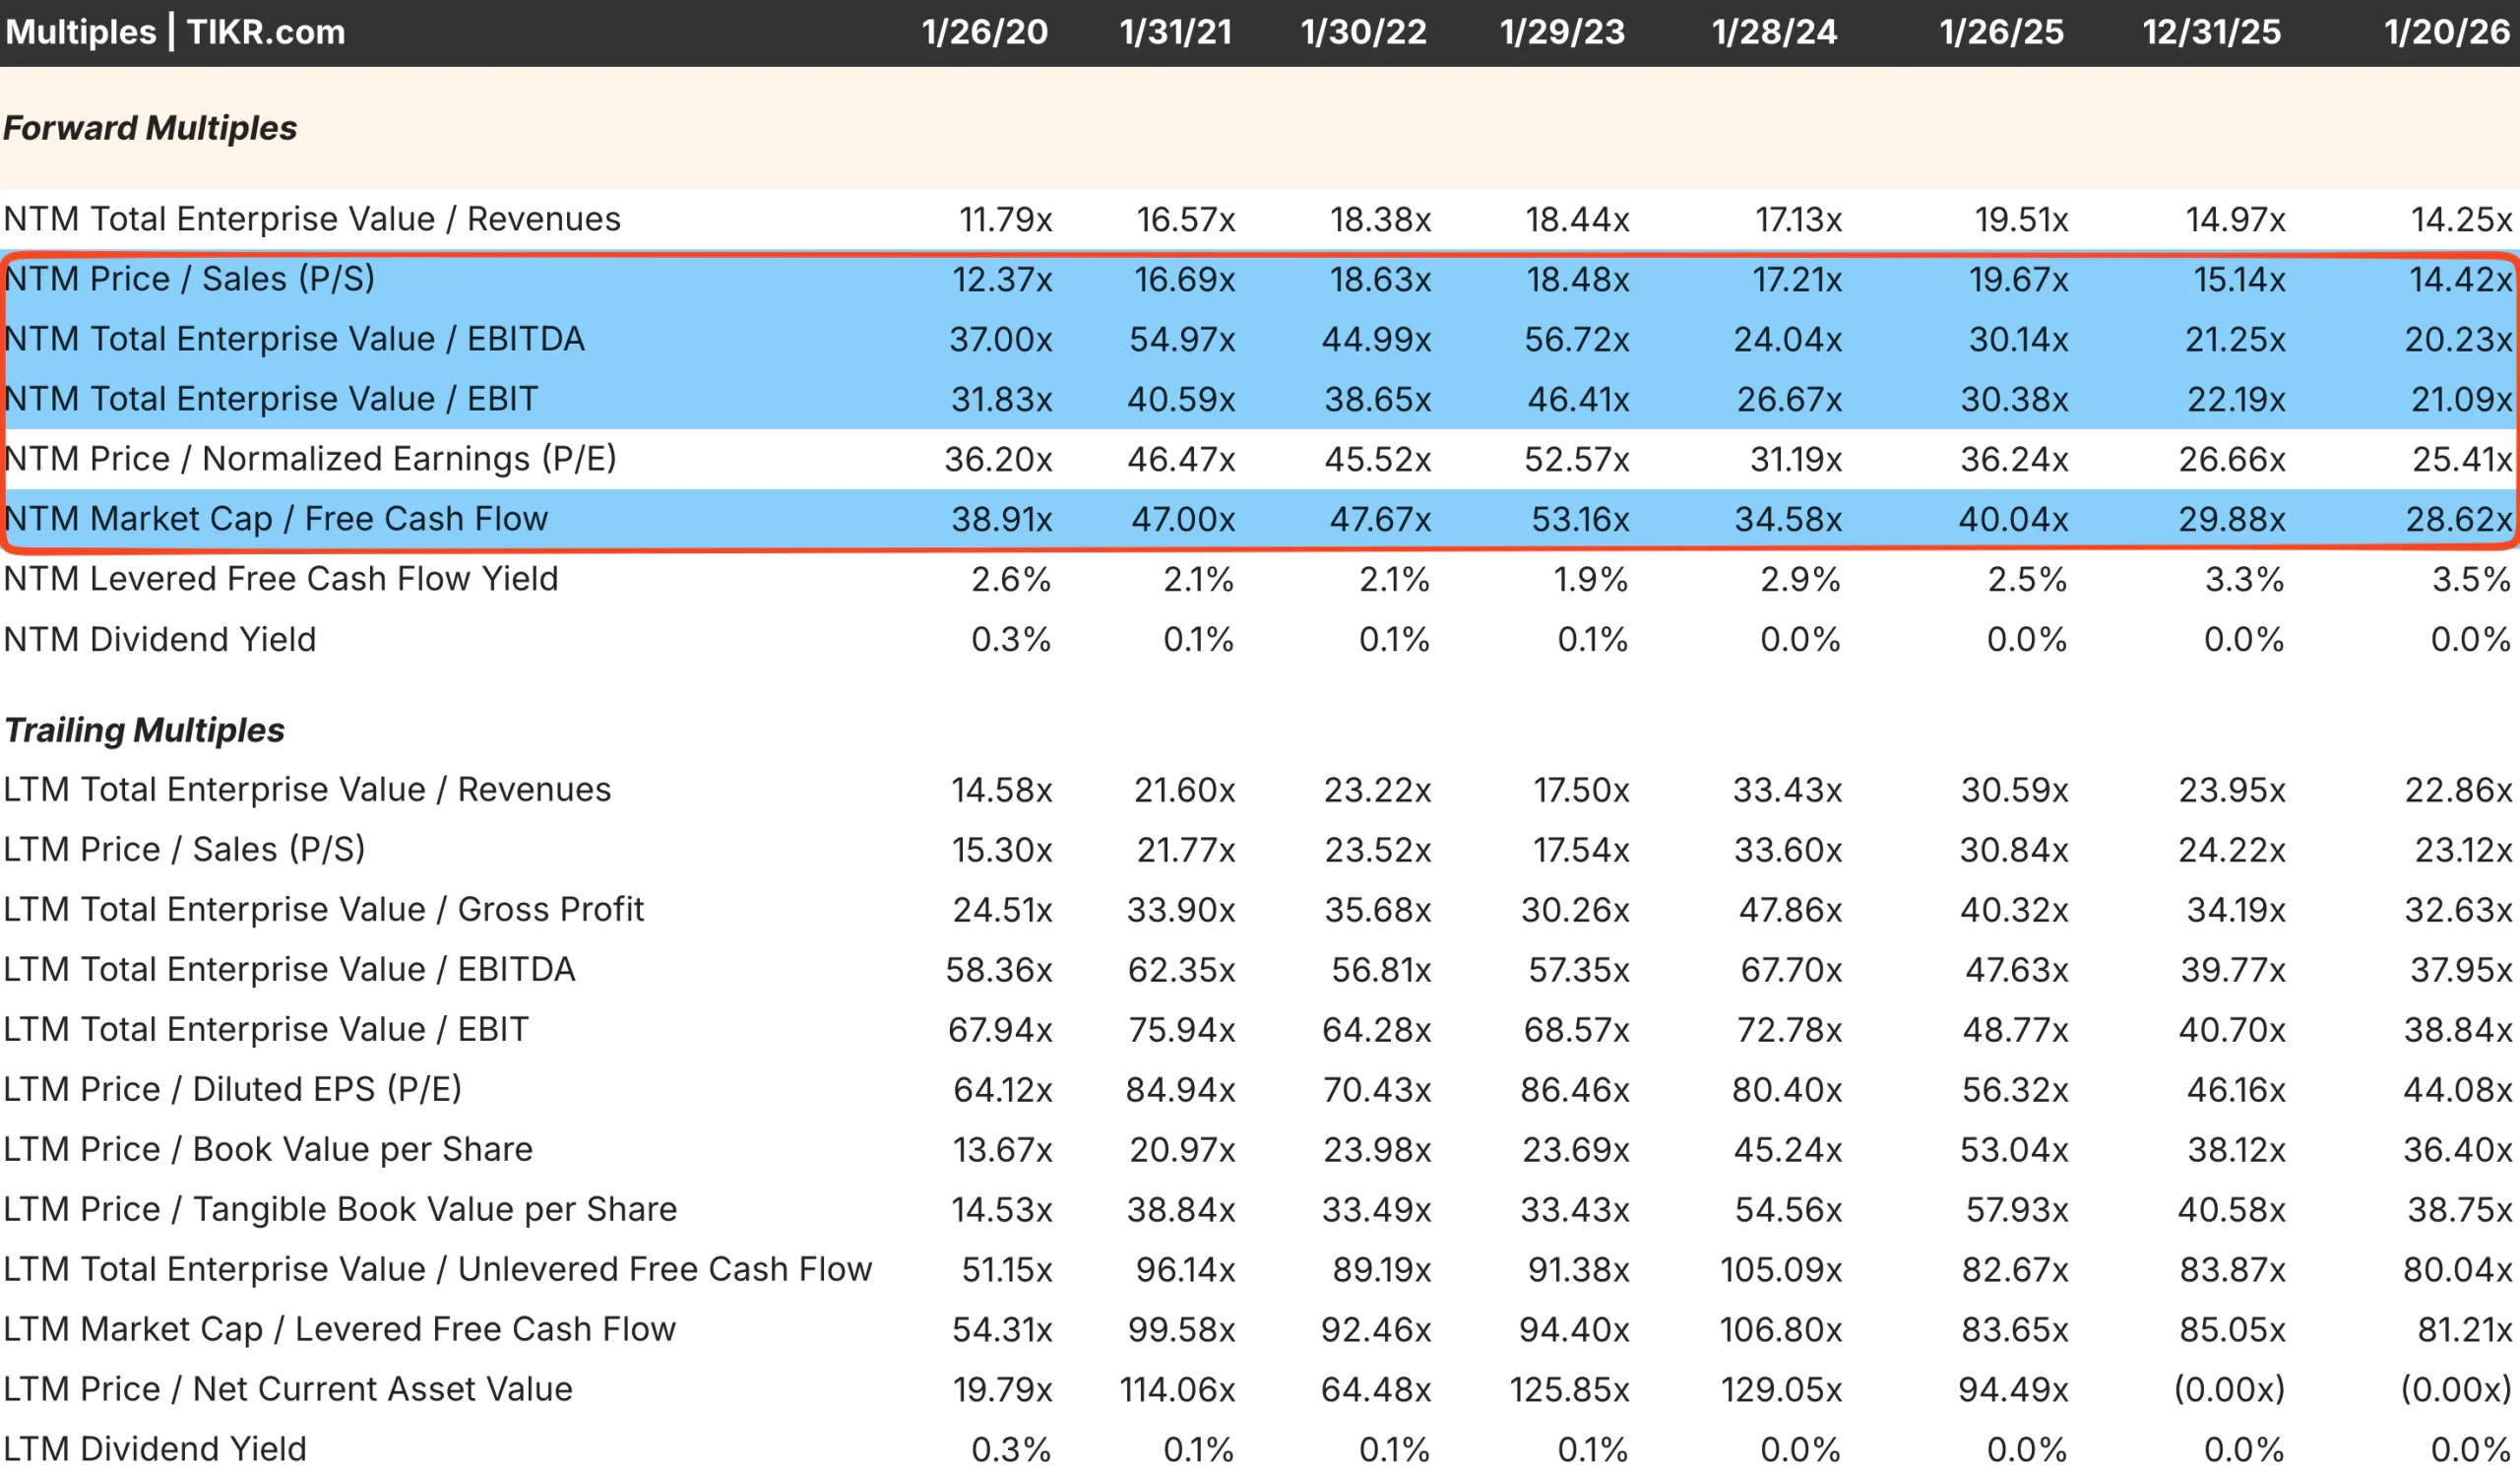
TIKR tip: TIKR displays a full range of valuation multiples in one view, including P/E, EV/EBITDA, EV/EBIT, P/S, and free cash flow yield. You can compare current multiples to five-year and ten-year averages to see whether the stock is trading above or below historical norms.
Track the hedge fund ownership level of each stock with TIKR (It’s free) >>>
How Growth Affects What You Should Pay
The value of any asset is the present value of its future cash flows. A company that grows earnings faster generates more future cash, which justifies a higher price today.
This relationship is intuitive but often ignored. Investors fixate on whether a P/E of 20 is “high” or “low” without asking what growth rate supports that multiple.
A simple framework helps clarify the relationship. If you expect a company to grow earnings at 15% annually and you require a 10% return, you can pay a higher multiple than if growth is only 5%. The math varies based on assumptions, but the principle holds: faster growth justifies higher multiples.
The PEG ratio formalizes this idea by dividing the P/E multiple by the expected earnings growth rate. A stock with a P/E of 20 and 20% growth has a PEG of 1.0. A stock with a P/E of 20 and 10% growth has a PEG of 2.0. Lower PEG ratios suggest better value relative to growth, though the metric is less useful for companies with very high or very low growth.
The key is making your growth assumptions explicit. If you believe a company will grow earnings at 12% annually for the next five years, you can work backward to determine what multiple that growth supports. If the current multiple is lower, the stock may be undervalued. If the multiple is higher, the market is pricing in even faster growth than you expect.
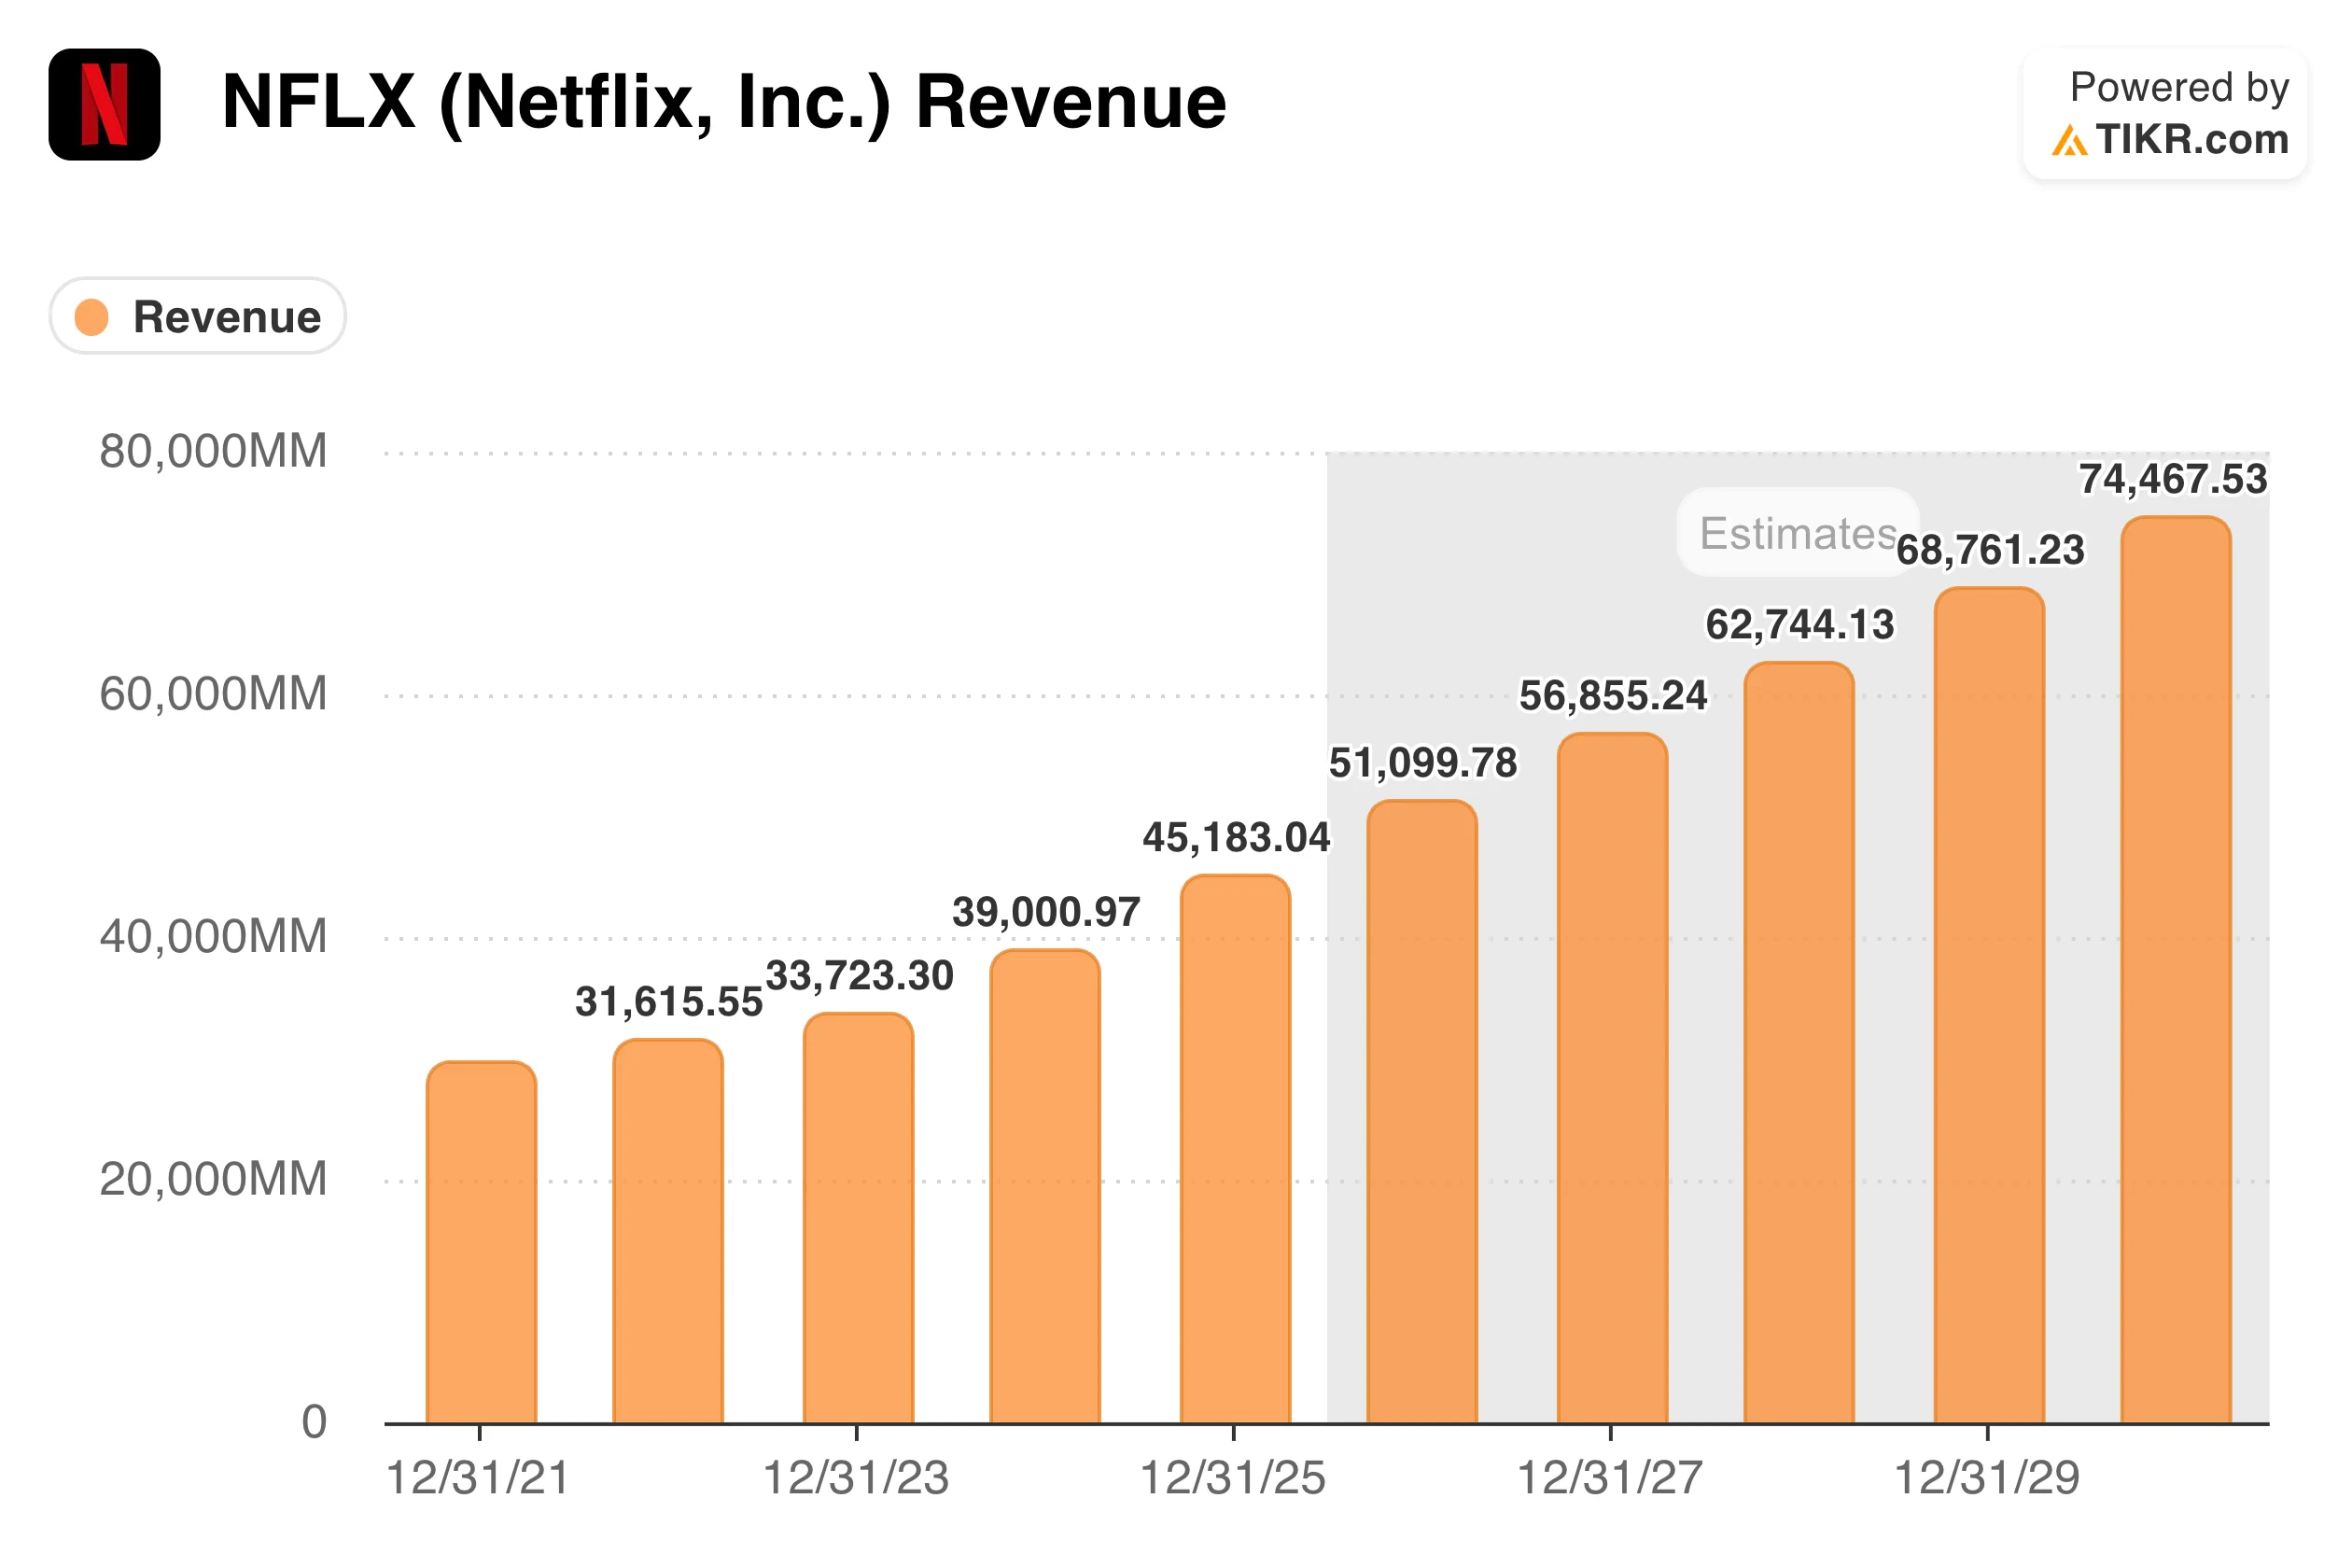
TIKR tip: TIKR’s Estimates tab shows analyst projections for earnings growth over the next several years. Compare these estimates to historical growth rates in the Financials tab to assess whether forward expectations are reasonable or overly optimistic.
Review stock fundamentals in less than 60 seconds with TIKR (It’s free) >>>
A Practical Valuation Framework
Combining multiples with growth assumptions requires a structured approach. The following framework provides a repeatable process for estimating fair value.
Start with current earnings. Use the most recent trailing twelve months of earnings per share or the current year estimate if results are nearly complete. Normalize for any one-time items that distort the baseline.
Project earnings growth. Estimate how fast earnings will grow over your investment horizon, typically three to five years. Use historical growth rates, analyst estimates, and your own assessment of the business to inform the projection. Be realistic. Most companies do not sustain 20% growth for extended periods.
Select an exit multiple. Determine what P/E or EV/EBITDA multiple the stock should trade at when your holding period ends. Historical averages provide a starting point. If the company is growing faster than it will in the future, the exit multiple should be lower than the current multiple. If growth is accelerating, a higher exit multiple might be justified.
Calculate future value. Multiply projected earnings by your exit multiple to estimate the stock price at the end of your holding period.
Discount to present value. Apply a discount rate that reflects your required return, typically 10% to 12% for equities. This gives you a fair value estimate for today.
Compare to current price. If the current stock price is meaningfully below your fair value estimate, the stock may be undervalued. If it is above, the market is pricing in more optimistic assumptions than yours.
This approach forces you to be explicit about every assumption. When the estimate turns out wrong, you can identify which input was off and refine your process.

TIKR tip: TIKR’s Valuation Model tool simplifies this process by letting you input revenue growth, operating margins, and exit multiples. The platform calculates potential share price and returns under different scenarios, helping you stress-test your assumptions quickly.
Comparing Against History and Peers
Context determines whether a multiple is reasonable. A stock at 25x earnings might be cheap relative to its own history or expensive relative to competitors.
A historical comparison shows how the market has valued the company under different conditions. If a stock typically trades between 15x and 25x earnings and currently sits at 16x, it may represent value. If it usually trades between 10x and 15x and now sits at 20x, the premium requires justification.
Peer comparison reveals whether the company’s multiple reflects company-specific factors or broader industry trends. If an entire sector trades at elevated multiples, a single stock’s high valuation may simply reflect investor enthusiasm for the industry. If one company trades at a significant premium to peers, that gap should be explained by superior growth, margins, or returns on capital.
Both comparisons require nuance. A company’s historical multiple may not apply if the business has fundamentally changed. Peer comparisons fail if the companies have meaningfully different growth profiles or risk characteristics.
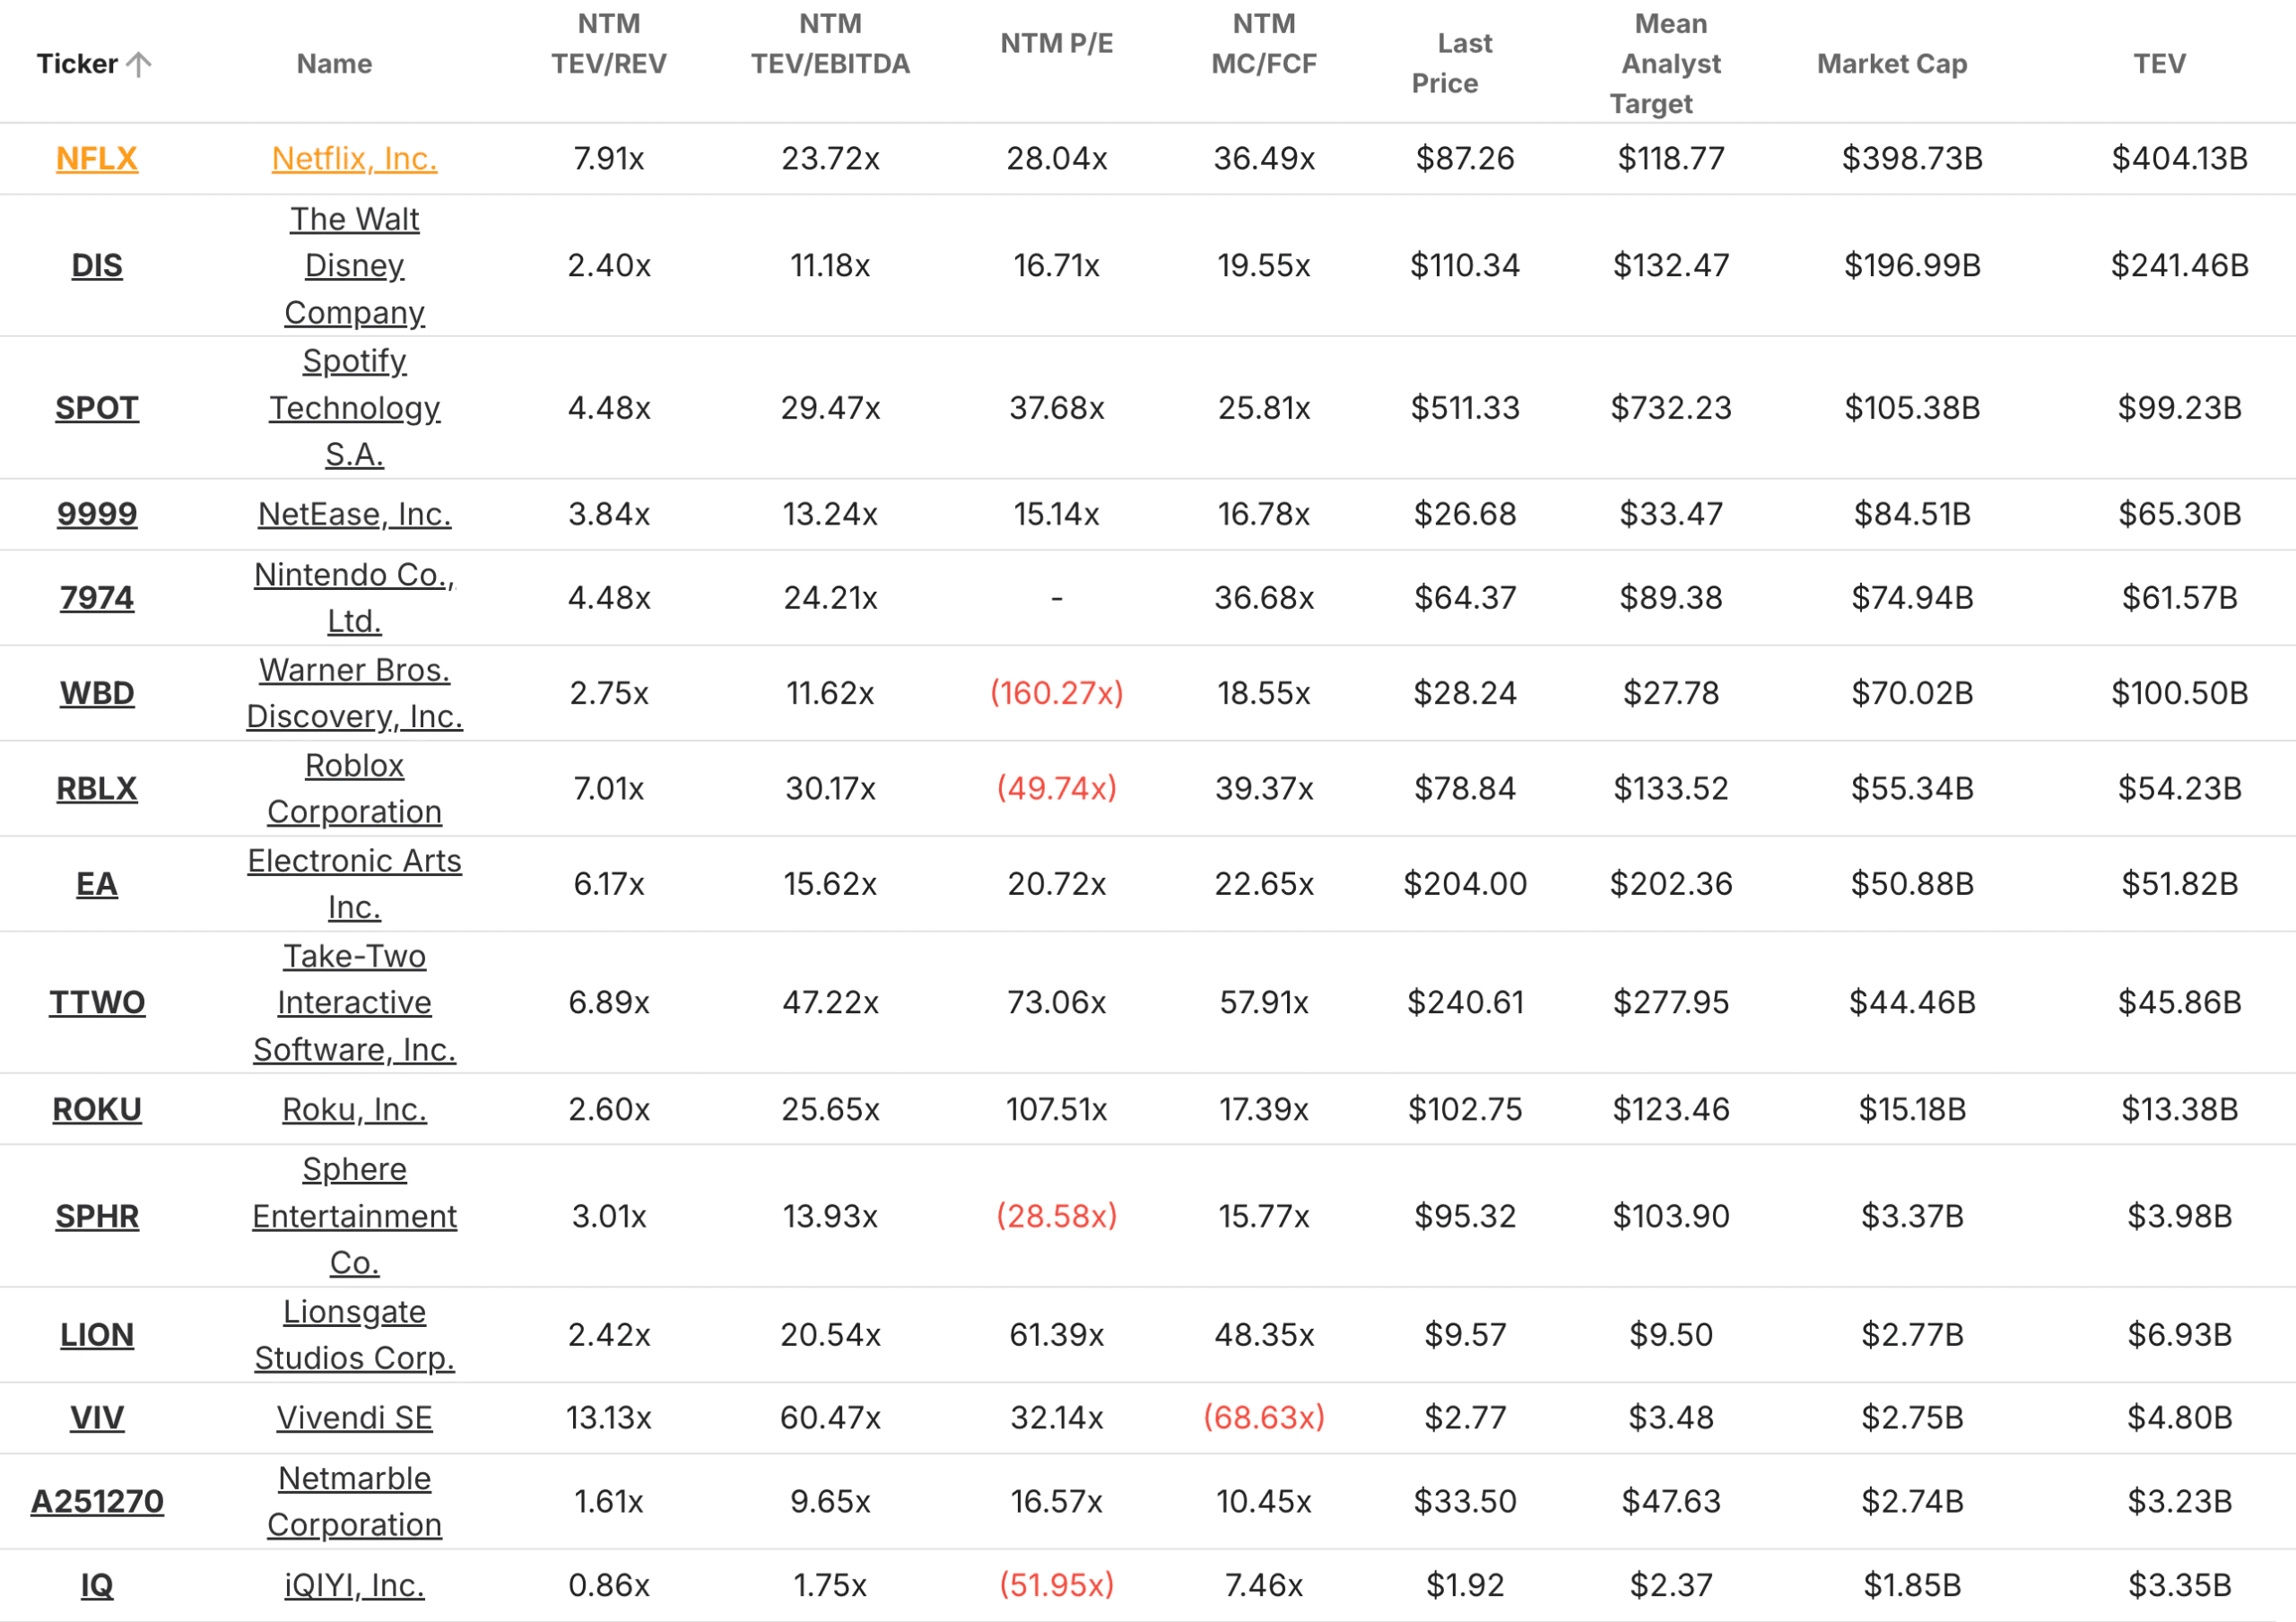
TIKR tip: TIKR’s Competitors tab displays valuation multiples for peer companies side-by-side. You can quickly see whether a stock’s premium or discount to the group is justified by its financial performance.
Now Live: Discover how much upside your favorite stocks could have using TIKR’s new Valuation Model (It’s free) >>>
Common Mistakes to Avoid
Valuation using multiples and growth is straightforward in concept but easy to misapply. Several common errors undermine the analysis.
Extrapolating growth too far. Assuming a company will grow at 20% annually for a decade is almost always wrong. Growth rates naturally decelerate as businesses mature. Use conservative estimates, especially for years beyond the near term.
Ignoring quality differences. A company with 20% ROIC and stable margins deserves a higher multiple than one with 10% ROIC and volatile results, even if both are growing at similar rates. Multiples should reflect business quality, not just growth.
Anchoring to current multiples. Just because a stock trades at 30x today does not mean 30x is the right exit multiple. Multiples expand and contract based on sentiment, interest rates, and growth expectations. Reversion to historical averages is more common than sustained premium valuations.
Using the wrong multiple for the business. P/E works poorly for companies with negative or erratic earnings. EV/EBITDA misleads for businesses with heavy capital requirements. Match the multiple to what actually drives value in the specific industry.
TIKR tip: Review multiple years of financial history in TIKR before locking in growth assumptions. Companies that have sustained high growth and margins for a decade have demonstrated durability. Companies with erratic results require more conservative projections.
TIKR Takeaway
Valuation multiples provide a starting point, but growth assumptions determine whether a stock is truly cheap or expensive. The relationship between price and future earnings is what matters.
TIKR makes this analysis practical by presenting historical multiples, peer comparisons, analyst estimates, and financial trends in a single platform. You can see how the market has valued a company over time, compare it to competitors, and build scenarios based on different growth assumptions.
The goal is not precision. It is developing a reasonable range of fair value based on explicit assumptions. When the current price sits meaningfully below that range, you have identified a potential opportunity. When it sits above, you know exactly what optimistic assumptions would need to prove true.
Valuation is ultimately about understanding what you are paying for and whether the price makes sense given realistic expectations for the future.
Accurately Value a Stock in Under 30 Seconds
With TIKR’s new Valuation Model tool, you can accurately estimate a stock’s potential share price in 30 seconds or less.
All it takes are three simple inputs:
- Revenue Growth
- Operating Margins
- Exit P/E Multiple
If you’re not sure what to enter, TIKR will enter analysts’ consensus estimates for you.
From there, TIKR calculates the potential share price and total returns under Bull, Base, and Bear scenarios so you can quickly see whether a stock looks undervalued or overvalued today.
See a stock’s true value in under 30 seconds (Free with TIKR) >>>
Looking for New Opportunities?
- Discover which stocks billionaire investors are purchasing, so you can follow the smart money.
- Analyze stocks in as little as 5 minutes with TIKR’s all-in-one, easy-to-use platform.
- The more rocks you overturn… the more opportunities you’ll uncover. Search 100K+ global stocks, global top investor holdings, and more with TIKR.
Disclaimer:
Please note that the articles on TIKR are not intended to serve as investment or financial advice from TIKR or our content team, nor are they recommendations to buy or sell any stocks. We create our content based on TIKR Terminal’s investment data and analysts’ estimates. Our analysis might not include recent company news or important updates. TIKR has no position in any stocks mentioned. Thank you for reading, and happy investing!