Most investors approach stock screening backward. They start with price movements, headlines, or social media tips, then work backward to determine whether a stock is worth buying. That process is unreliable because it introduces bias from the start. You are not evaluating the business objectively. You are looking for reasons to confirm what you already want to believe.
A better approach starts with quality. Instead of asking which stocks are moving today, ask which businesses have the fundamentals to compound over time. Then use screening tools to filter thousands of companies down to the handful that meet your criteria. This method removes emotion and focuses your attention on companies with durable advantages, strong cash generation, and reasonable valuations.
The challenge is that most free screening tools are either too basic or too cluttered. They give you surface-level data without the context needed to make informed decisions. The good news is that several free platforms now provide enough functionality to build meaningful screens, and if you know how to use them together, you can construct a research process that rivals what professionals use.
This guide walks through the best free screening tools available today, what each does well, and how to use TIKR to take your analysis deeper once you have identified candidates worth researching.
What Defines a High-Quality Stock
Quality means different things depending on your strategy, but most definitions share common elements. High-quality stocks generate strong cash flow, maintain healthy margins, deploy capital intelligently, and sustain performance through different economic environments. They are not necessarily the fastest-growing companies or the cheapest stocks. They are businesses built to last.
Here are the key characteristics to look for.
Strong and Stable Margins. Gross margin and operating margin indicate how much profit a company retains after covering costs. High margins usually indicate pricing power, operational efficiency, or both. Companies that maintain stable or expanding margins over time tend to have competitive advantages that protect them from pricing pressure.
Consistent Free Cash Flow. Free cash flow measures the cash a business generates after capital expenditures are paid. It is a cleaner measure of profitability than net income because it reflects actual cash the company can use to pay dividends, buy back shares, or reinvest in growth. Companies with consistent free cash flow generation are less dependent on external financing and better positioned to weather downturns.
High Returns on Capital. Return on invested capital (ROIC) shows how efficiently a company uses its capital to generate profits. A high ROIC suggests the business has a sustainable edge, whether through brand strength, network effects, or operational excellence. When ROIC consistently exceeds the cost of capital, the company is creating value for shareholders.
Moderate Leverage. Debt is not inherently bad, but excessive leverage limits flexibility and increases risk. Companies with manageable debt levels relative to earnings or equity have more room to invest, return capital to shareholders, or navigate challenging periods without financial distress.
Revenue and Earnings Growth. Quality businesses grow, but explosive growth is not required. Steady, predictable growth over multiple years often matters more than a few quarters of rapid expansion. Look for companies that consistently grow revenue and earnings without relying on unsustainable practices such as heavy discounting or aggressive accounting.
These characteristics work together. A company with high margins but no cash flow might be reinvesting heavily or facing collection issues. A company with strong revenue growth but poor returns on capital might be chasing unprofitable expansion. The goal is to find businesses where multiple quality indicators align.
FINVIZ: Fast Filtering with Limited Depth
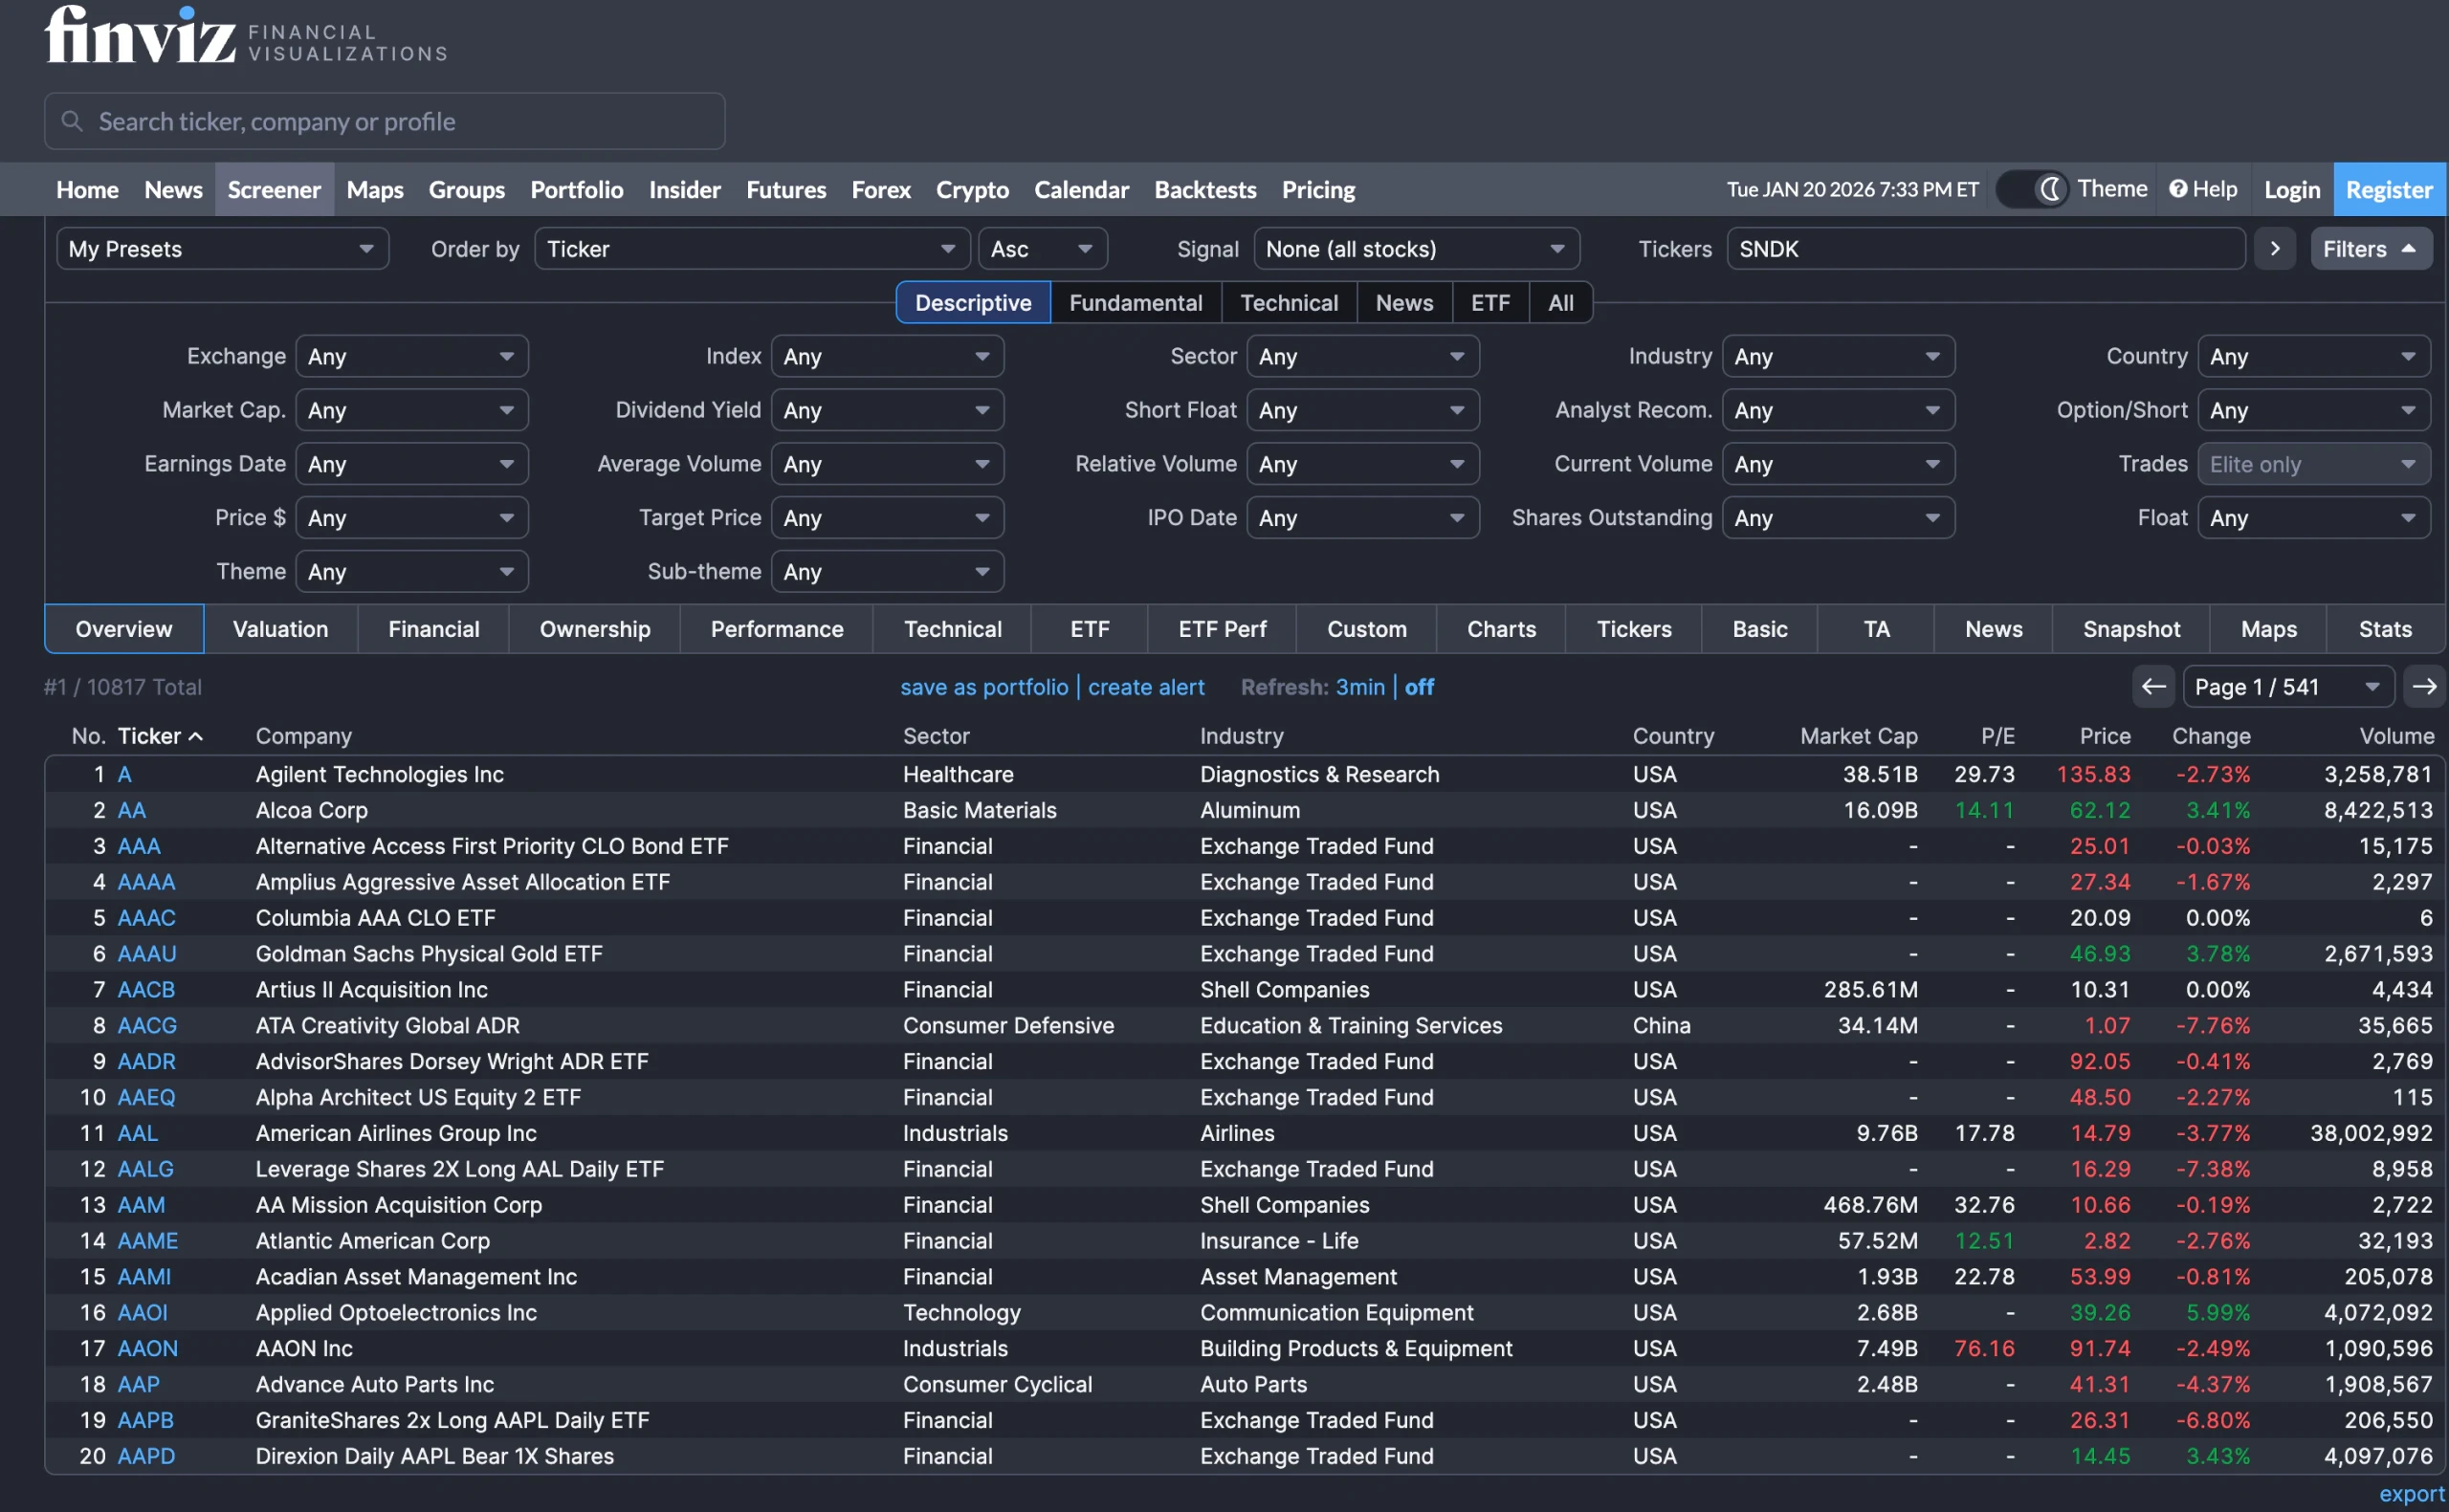
FINVIZ is probably the most widely used free stock screener, and for good reason. The interface is clean, the filters load quickly, and you can build a basic quality screen in under a minute. It gives you access to fundamental filters like P/E ratio, market cap, dividend yield, profit margin, and debt-to-equity, along with technical indicators if you want to layer those in.
The strength of FINVIZ is speed. You can quickly filter for profitable companies with reasonable valuations and low debt, then export the results or click through to individual stock pages for more detail. The screener also includes pre-built screens like “High Dividend Yield” or “Undervalued Growth Stocks” that give beginners a starting point before they build custom filters.
The limitation is depth. FINVIZ pulls data from a single point in time, so you cannot see trends over multiple years or compare historical performance. The filters are also relatively basic compared to institutional-grade tools. You can screen for profit margins above a certain level, but you cannot filter for companies with expanding year-over-year margins. You can sort by P/E ratio, but you cannot easily compare a stock’s current valuation to its five-year average. For a first pass at narrowing the universe, FINVIZ works well. To validate that the companies you find actually have improving fundamentals, you need something deeper.
Yahoo Finance Screener: Accessible but Basic
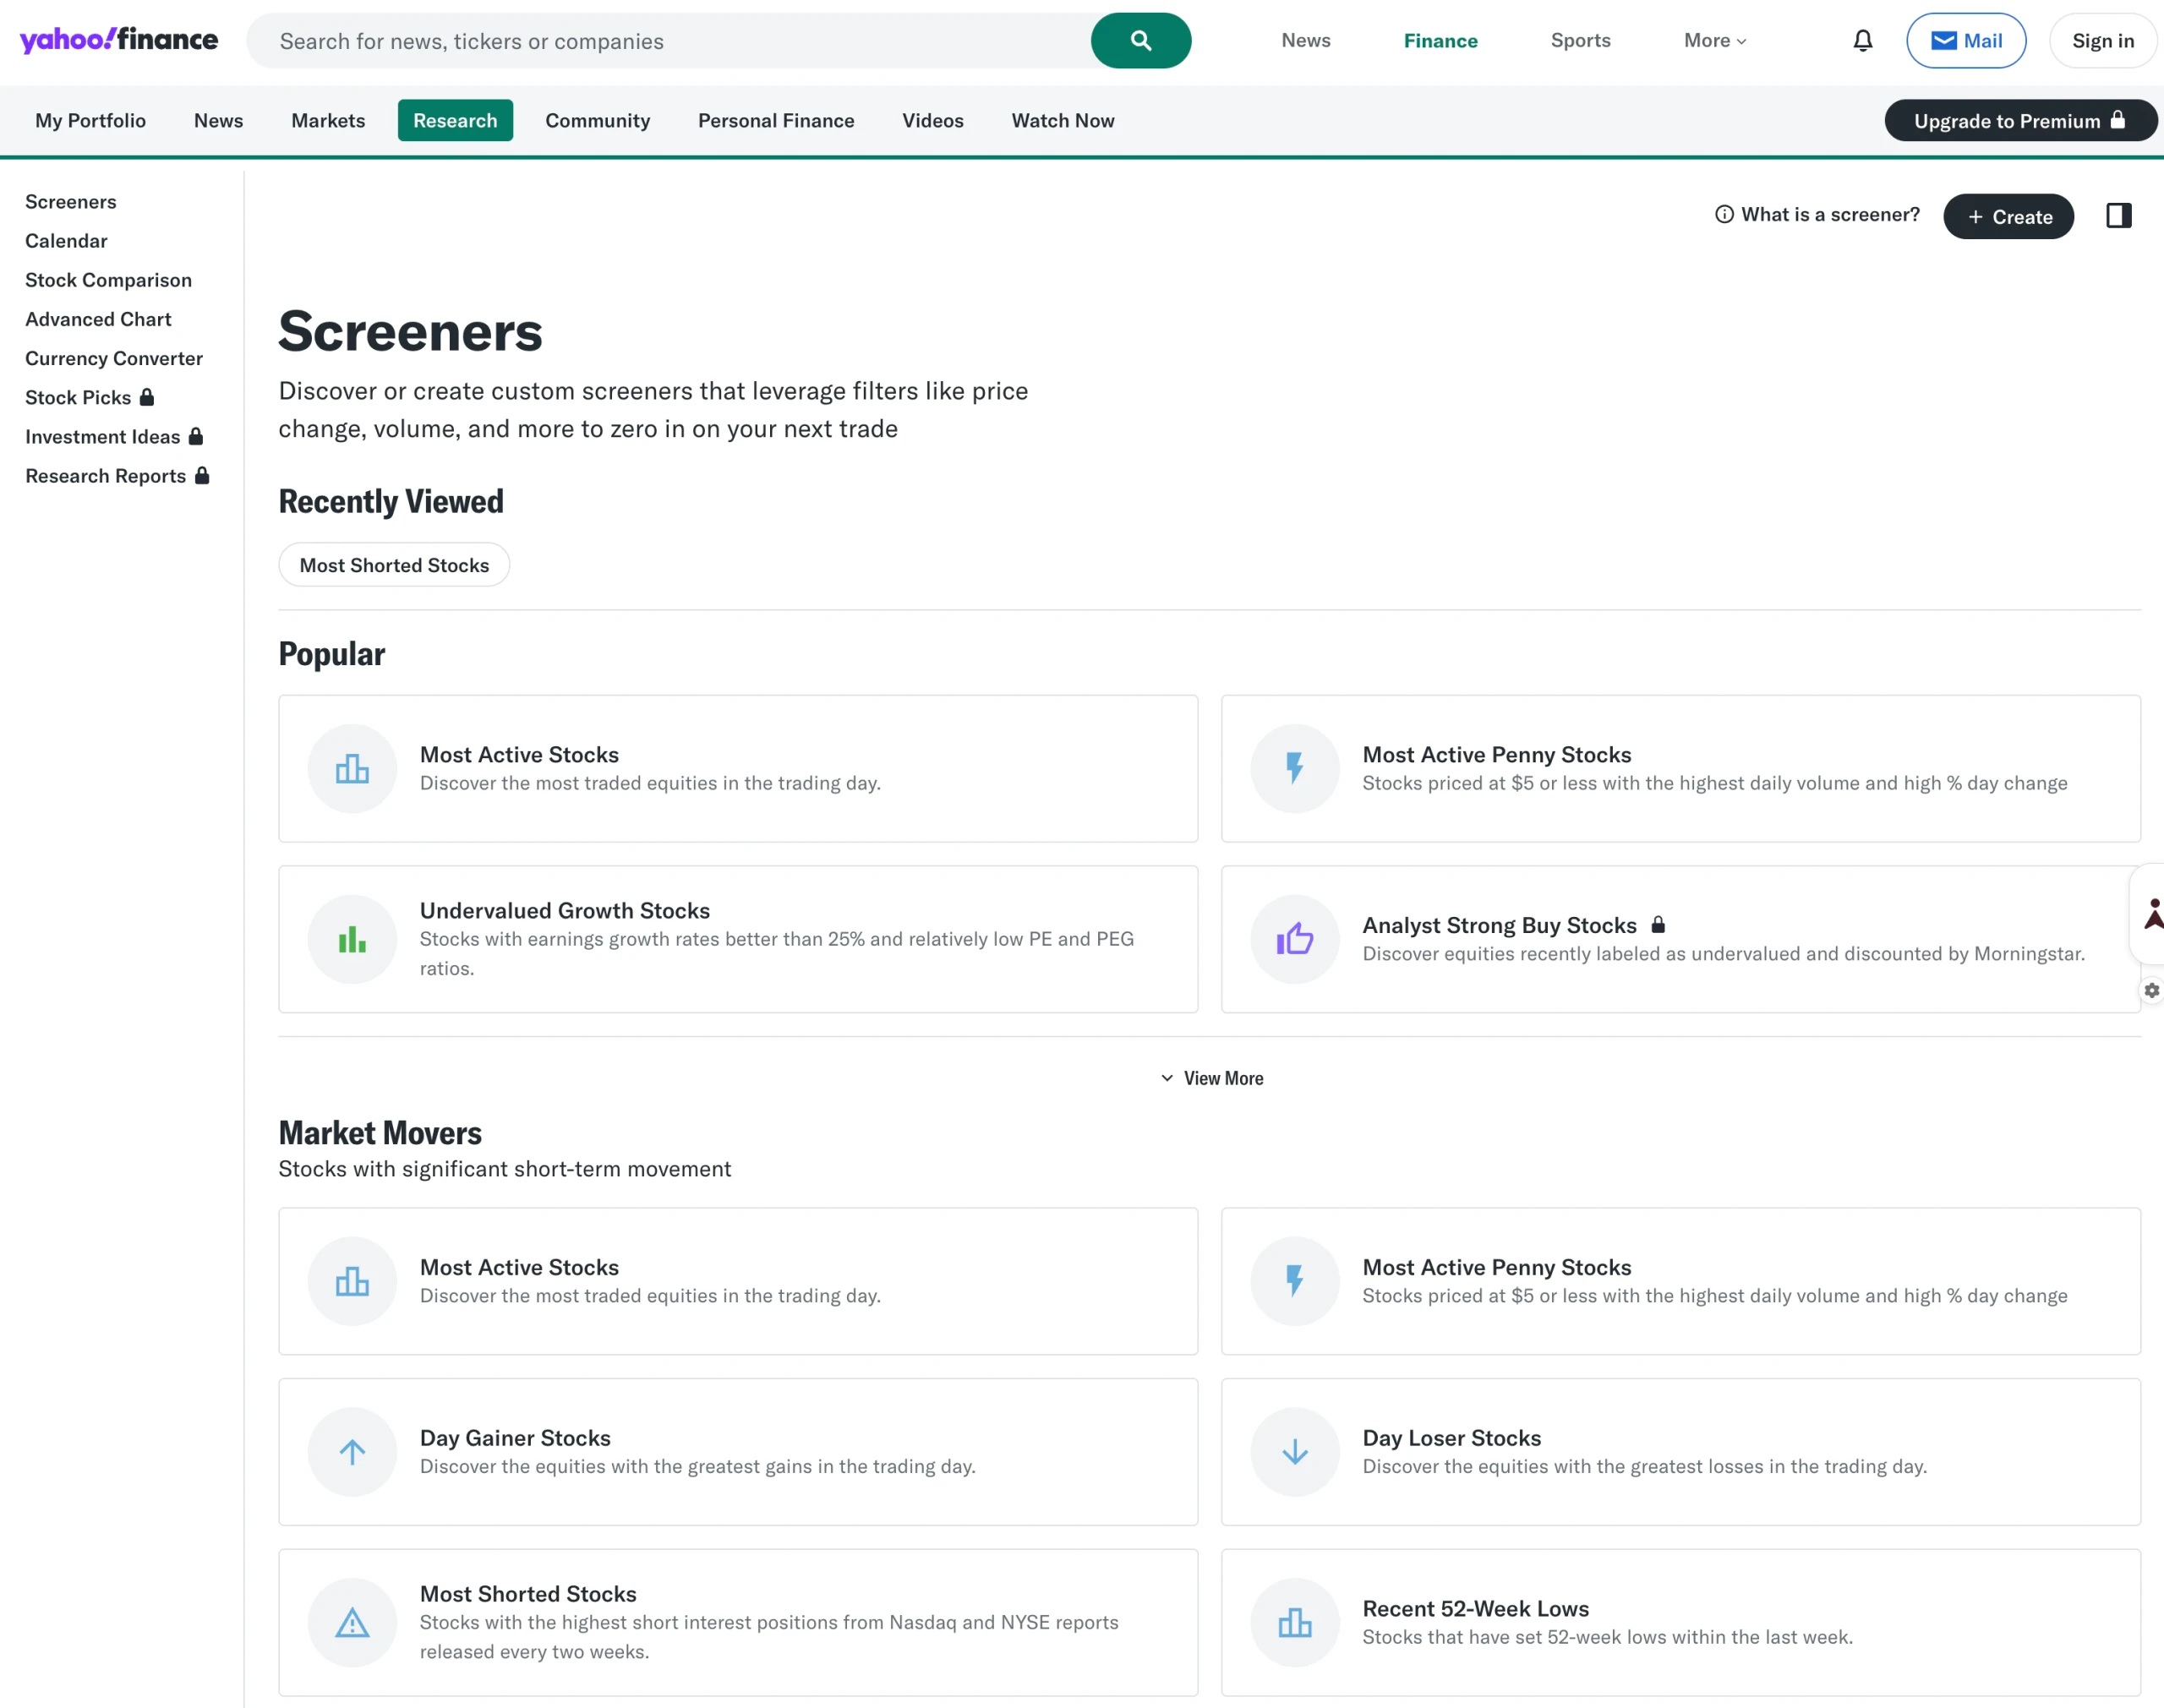
Yahoo Finance has offered a free stock screener for years, and while it is not as visually polished as FINVIZ, it covers similar ground. You can filter by market cap, sector, price, P/E ratio, dividend yield, and a handful of growth and profitability metrics. The screener integrates directly with Yahoo Finance’s stock pages, so once you run a screen, you can click into individual companies and see charts, news, and basic financials without leaving the platform.
The advantage of Yahoo Finance is familiarity. Most investors already use it to check stock prices or read headlines, so adding the screener to that workflow feels natural. The filters are straightforward enough that beginners can figure them out without a tutorial, and the results update in real time as you adjust criteria.
The downside is that the screener lacks sophistication. You cannot build multi-layered screens that combine growth, profitability, and valuation in nuanced ways. The data itself is often delayed or inconsistent, particularly for smaller or international stocks. And like FINVIZ, Yahoo Finance does not give you historical context. You see where a company stands today, but not whether its margins are improving, its returns on capital are rising, or its balance sheet is getting stronger. That makes it useful for quick ideas but insufficient for serious research.
Google Finance Screener: Simple and Limited
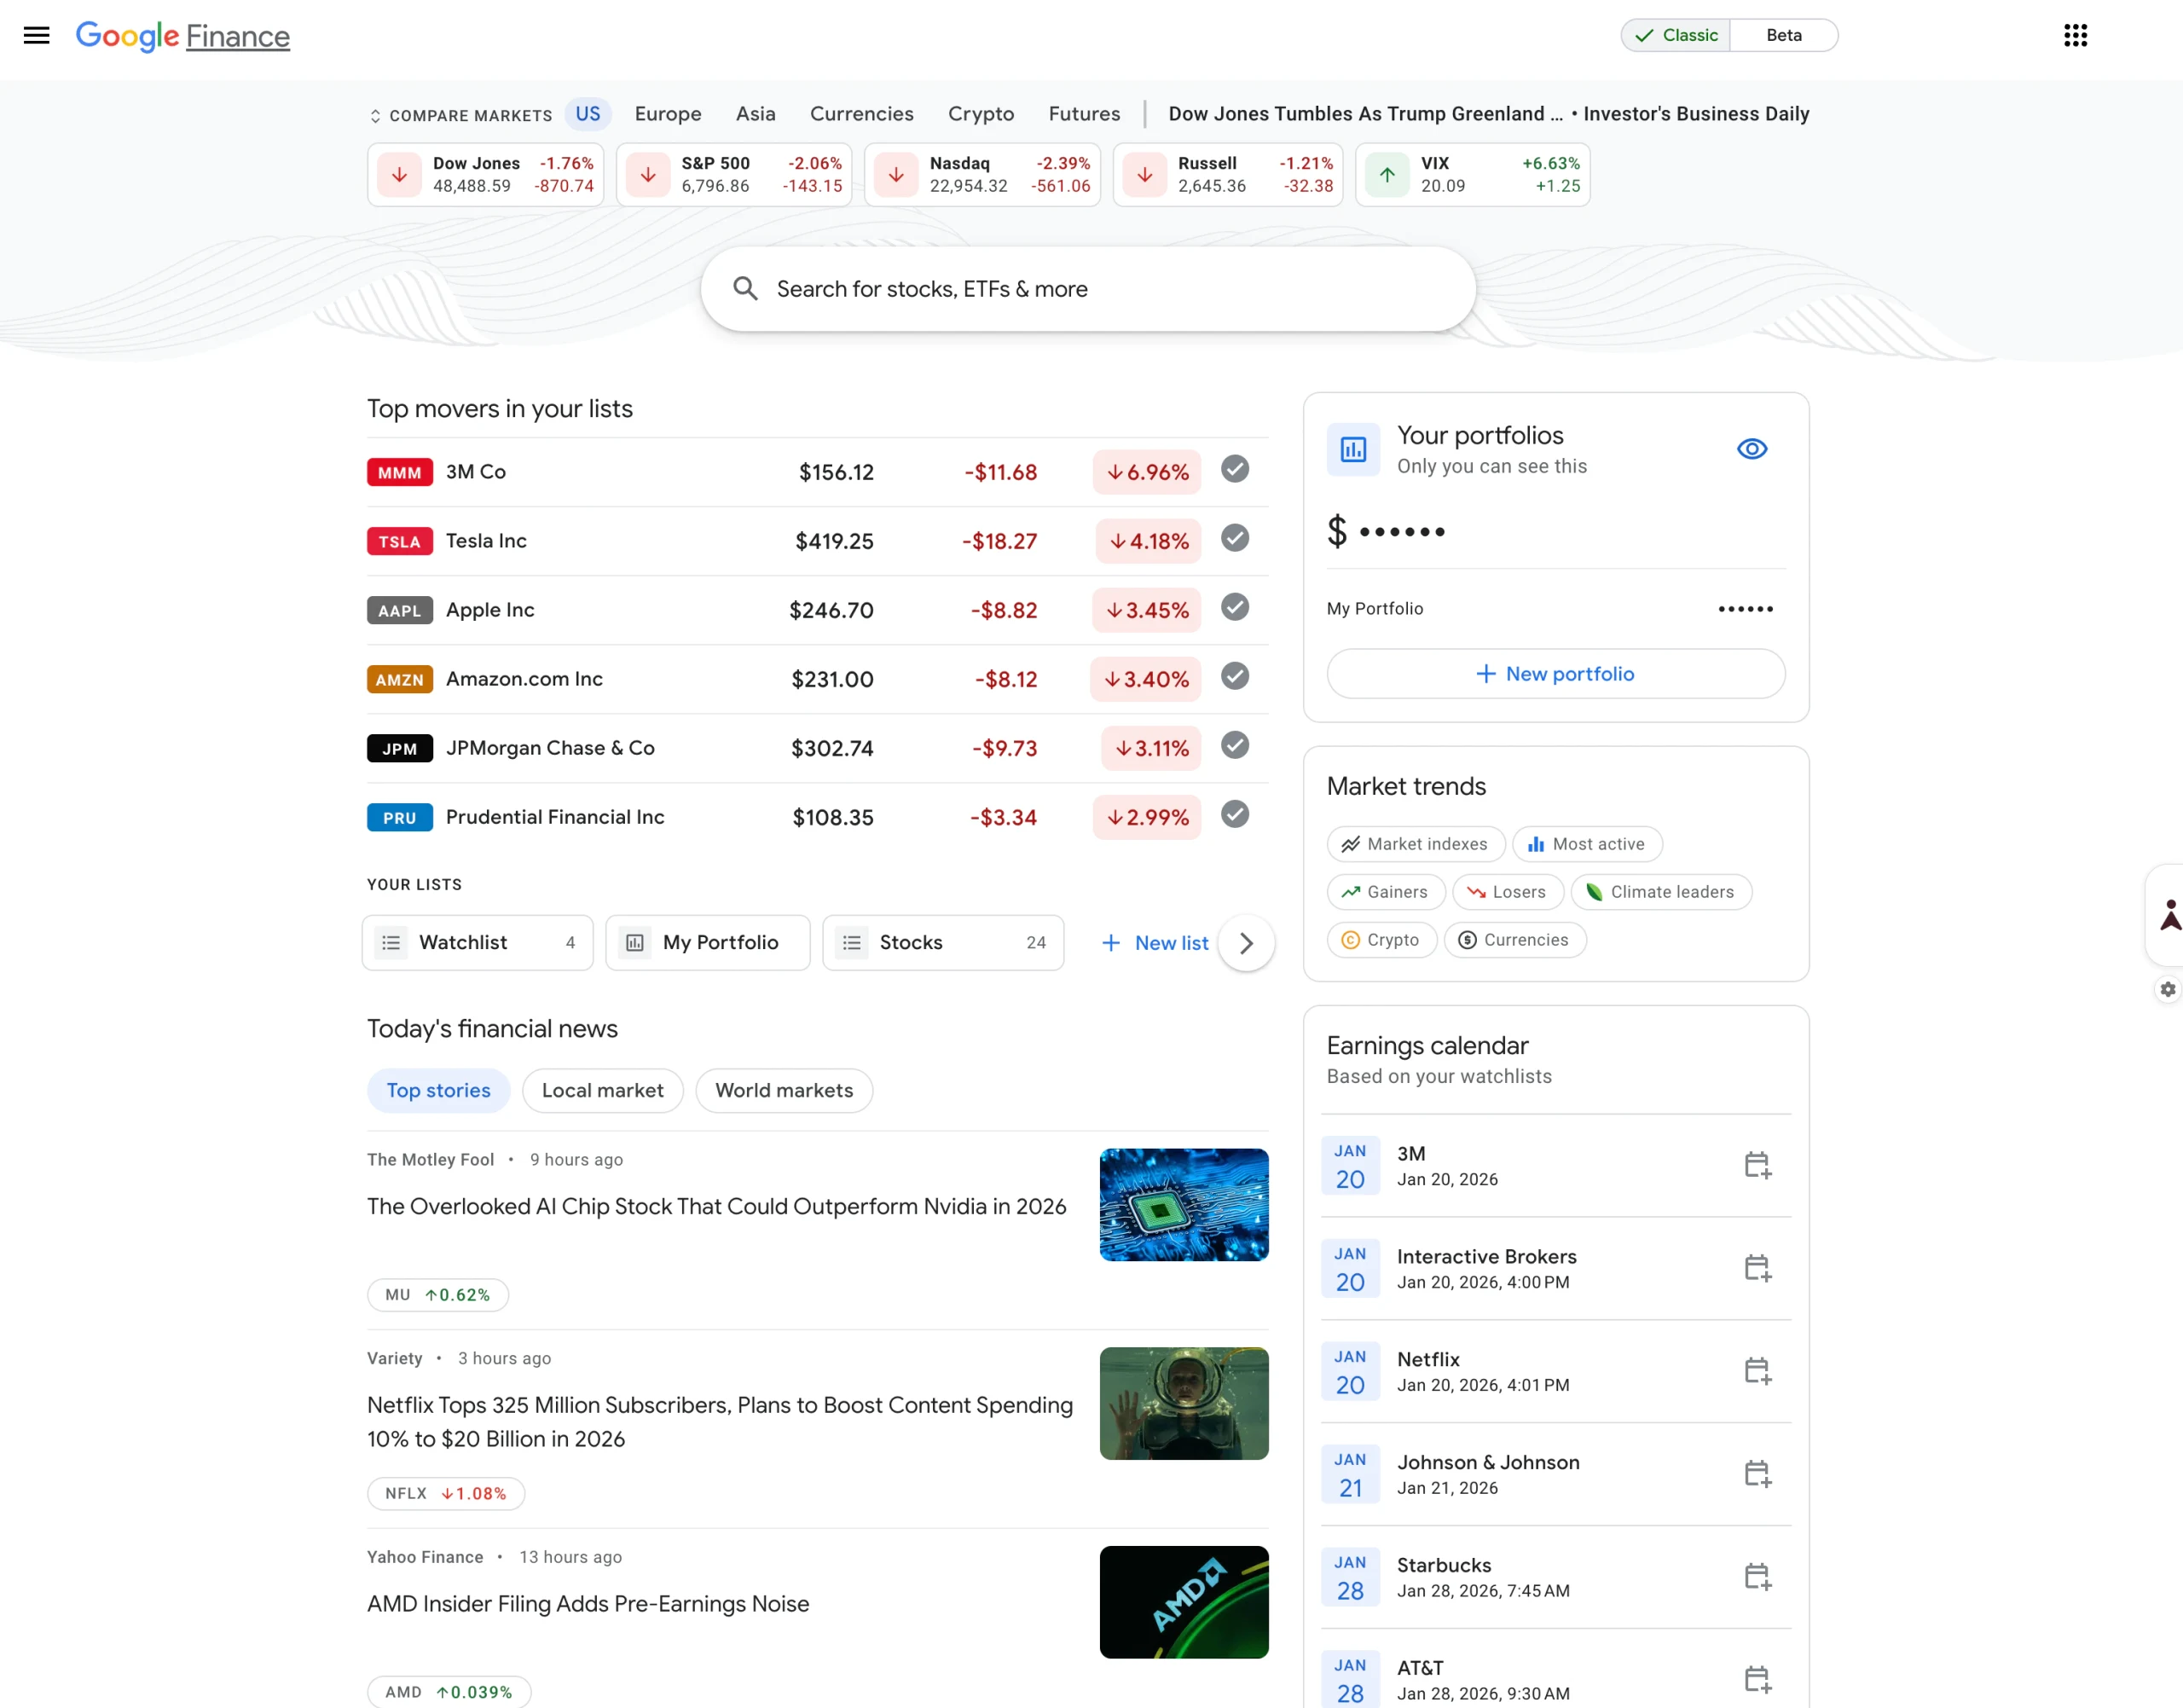
Google Finance used to have a more robust screener, but the current version is bare-bones. You can filter by market cap, P/E ratio, dividend yield, and a few other basic metrics, but the functionality is limited compared to FINVIZ or Yahoo Finance. The interface is clean, and if you are already using Google Finance to track a portfolio, the screener is convenient. But it does not offer enough flexibility or data to serve as a primary screening tool.
The one area where Google Finance still adds value is its integration with Google search and news. Once you identify a stock, you can quickly pull up recent headlines, analyst ratings, and related companies without switching platforms. For investors who prioritize speed and simplicity over depth, Google Finance works as a starting point. For anyone who wants to dig into financials or track trends over time, it falls short.
Where Free Screeners Fall Short
The common limitation across FINVIZ, Yahoo Finance, and Google Finance is that they give you snapshots, not stories. They show you where a company stands today based on trailing data, but they do not help you understand whether the business is improving, deteriorating, or holding steady. You can filter for companies with 15% profit margins, but you cannot easily identify which are expanding margins and which are seeing them compress.
You also cannot compare companies to their own history. A stock trading at 20x earnings might look expensive in isolation, but if it has historically traded at 30x and the business fundamentals are unchanged, that could represent value. Without access to historical valuation ranges, peer comparisons over time, or forward estimates, you are making decisions with incomplete information.
This is where TIKR changes the equation. It is built specifically to give individual investors the kind of depth and context that used to require expensive institutional tools.
Track company financials, stock value, and competitor information with TIKR (It’s free) >>>
How TIKR Takes Screening to the Next Level
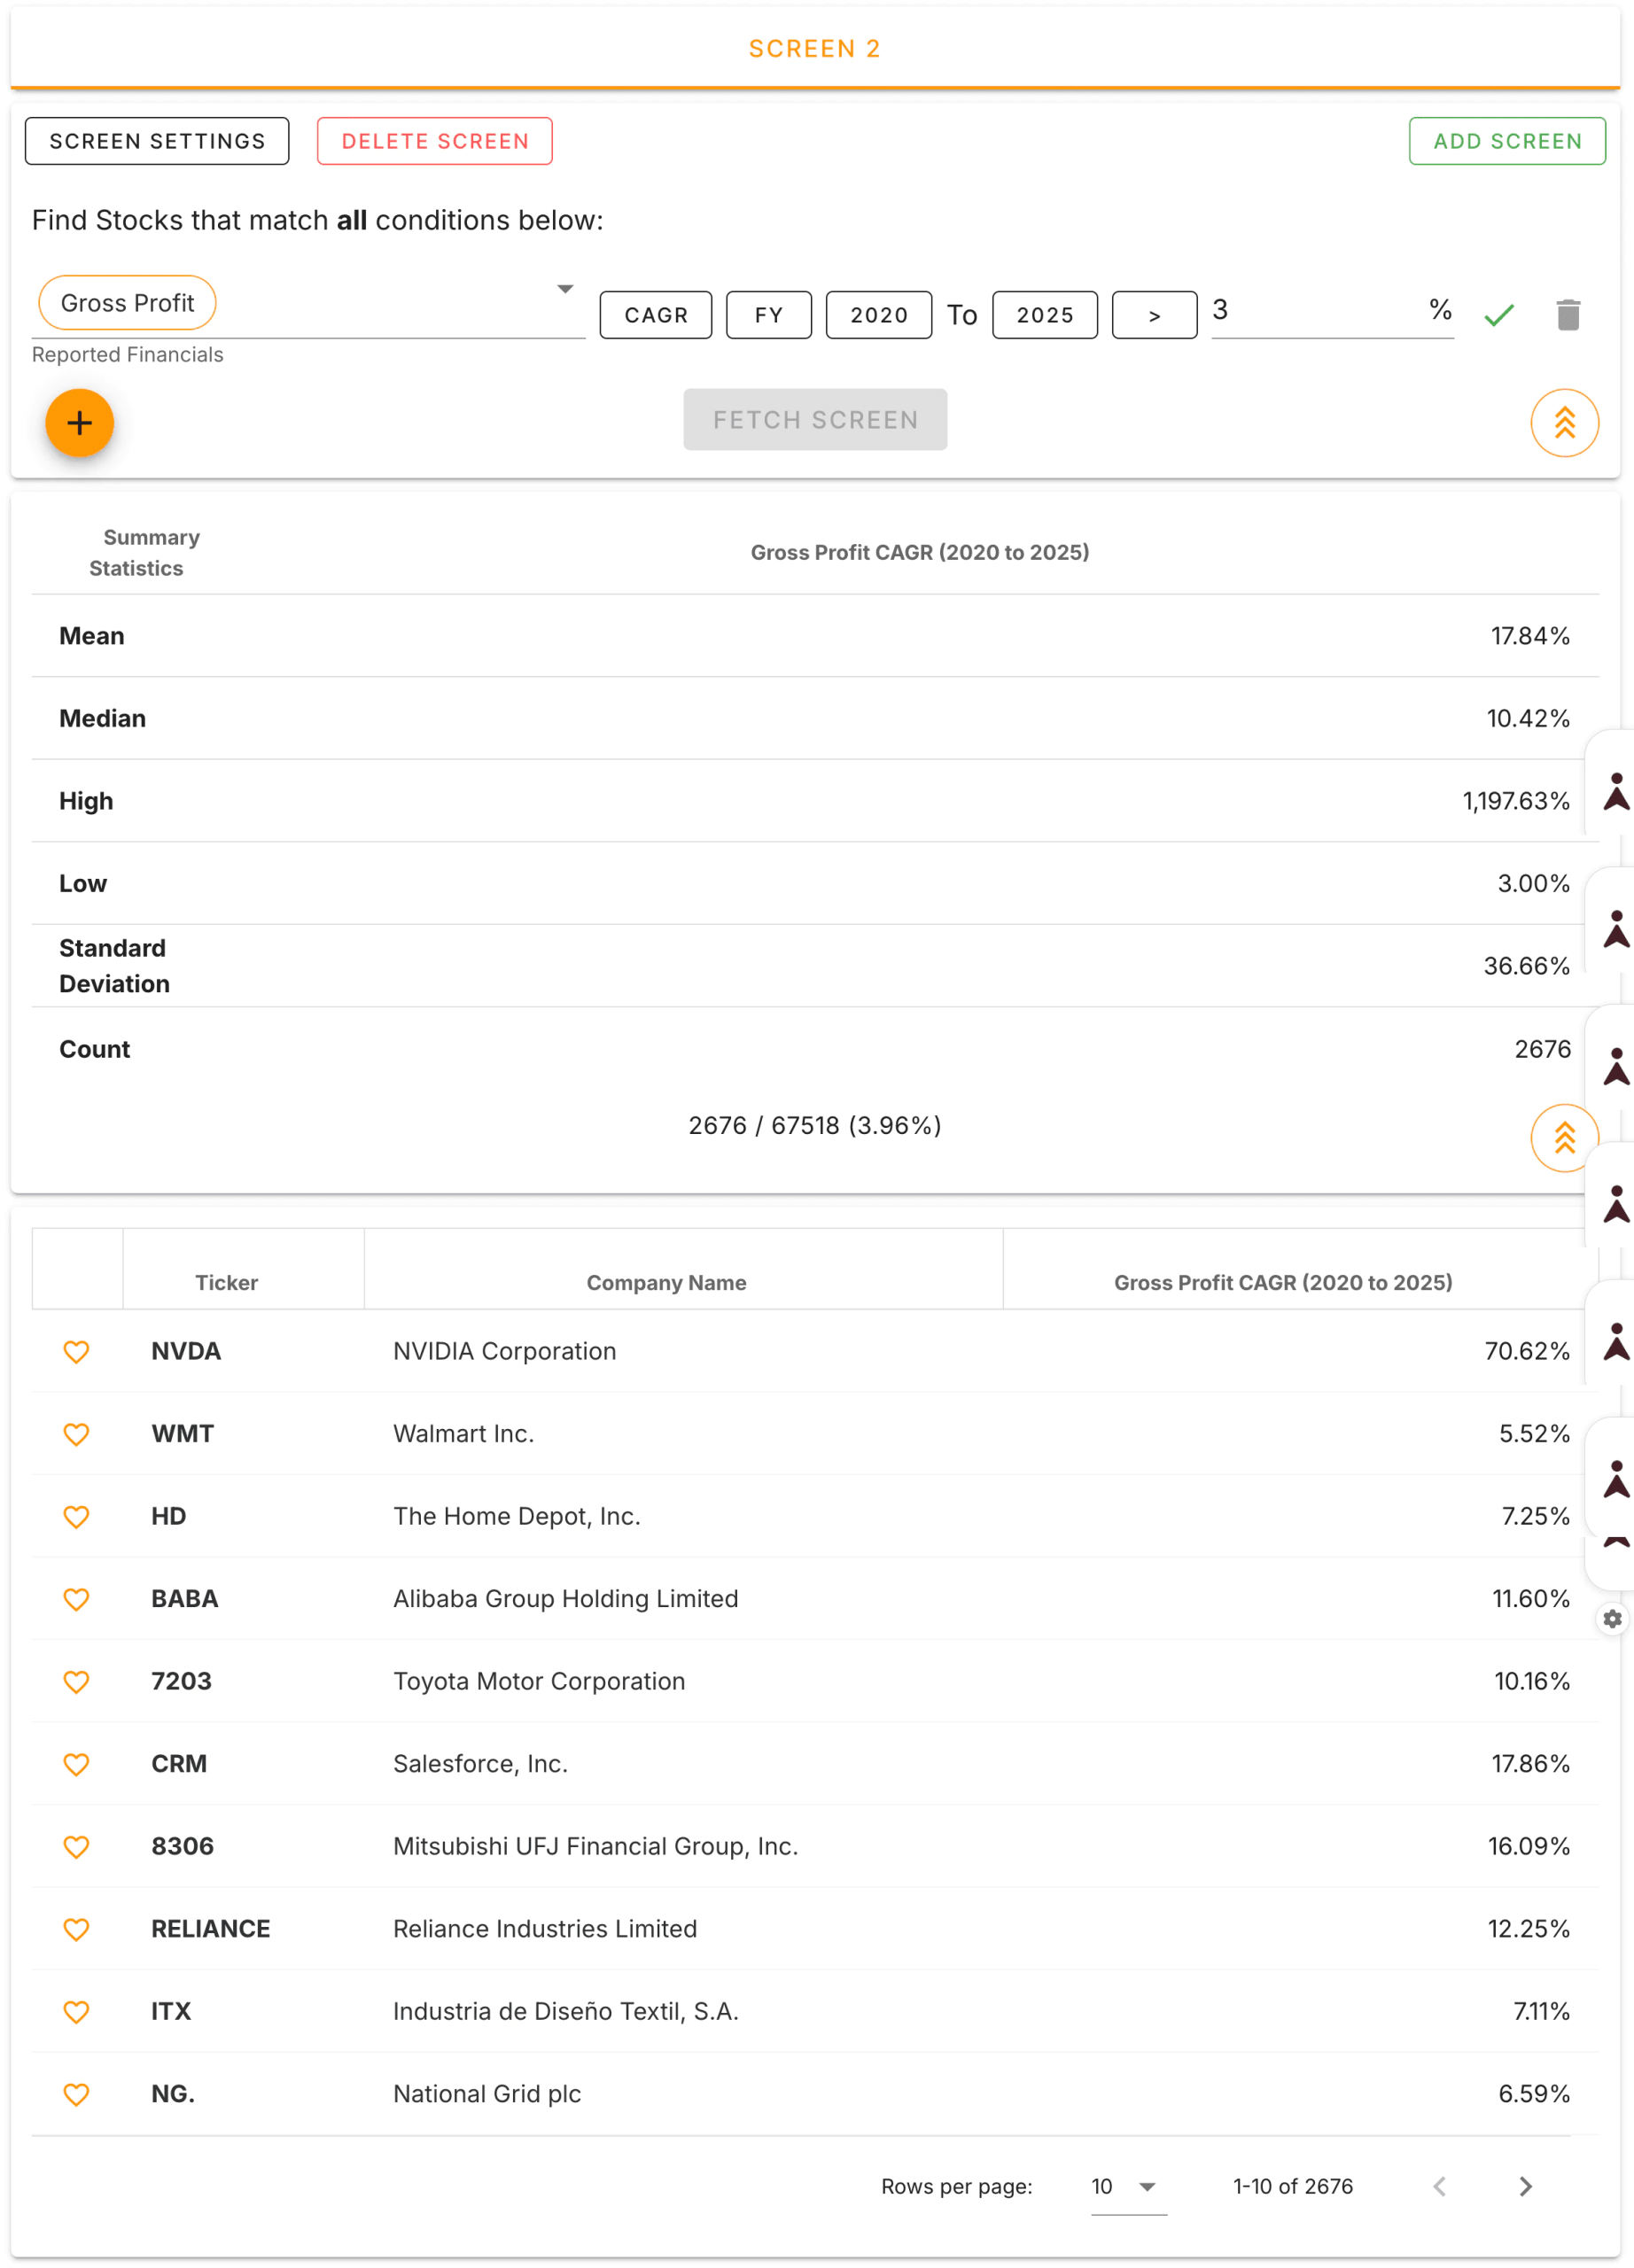
TIKR’s Global Screener is designed to overcome the limitations of other free tools. It combines FINVIZ’s filtering speed with the depth and historical context that professionals rely on, covering more than 100,000 global stocks with continuously updated data. You can build screens based on trailing financials, forward estimates, multi-year trends, and peer comparisons, all within a single interface.
Filtering for Quality with Depth

Start by navigating to the Global Screener in TIKR. Unlike basic screeners that limit you to a handful of filters, TIKR gives you access to dozens of financial metrics across income statement, balance sheet, cash flow, and ratio categories. You can layer these filters to build sophisticated screens that reflect actual investment theses. For example, you might want companies with operating margins above 15%, ROIC above 12%, revenue growth above 5%, and debt-to-equity below 1x. In FINVIZ or Yahoo Finance, building a screen that specific would be difficult or impossible. In TIKR, it takes a few clicks.
You can also filter based on forward estimates, not just trailing data. If you want to find companies where analysts expect margin expansion or accelerating revenue growth, TIKR lets you add those criteria directly. This forward-looking dimension helps you identify improving businesses before the improvements fully show up in historical financials.
Screening for Trends, Not Just Levels

One of TIKR’s most powerful features is the ability to screen for year-over-year changes or multi-year trends. Instead of just filtering for companies with 10% ROIC, you can filter for companies where ROIC has increased over the past three years. Instead of just looking for high margins, you can find companies where the operating margin is expanding relative to last year. This capability transforms screening from a static to a dynamic process. You are identifying companies that are getting better, which is often a stronger signal of future performance.
Validating Screens with Integrated Financials
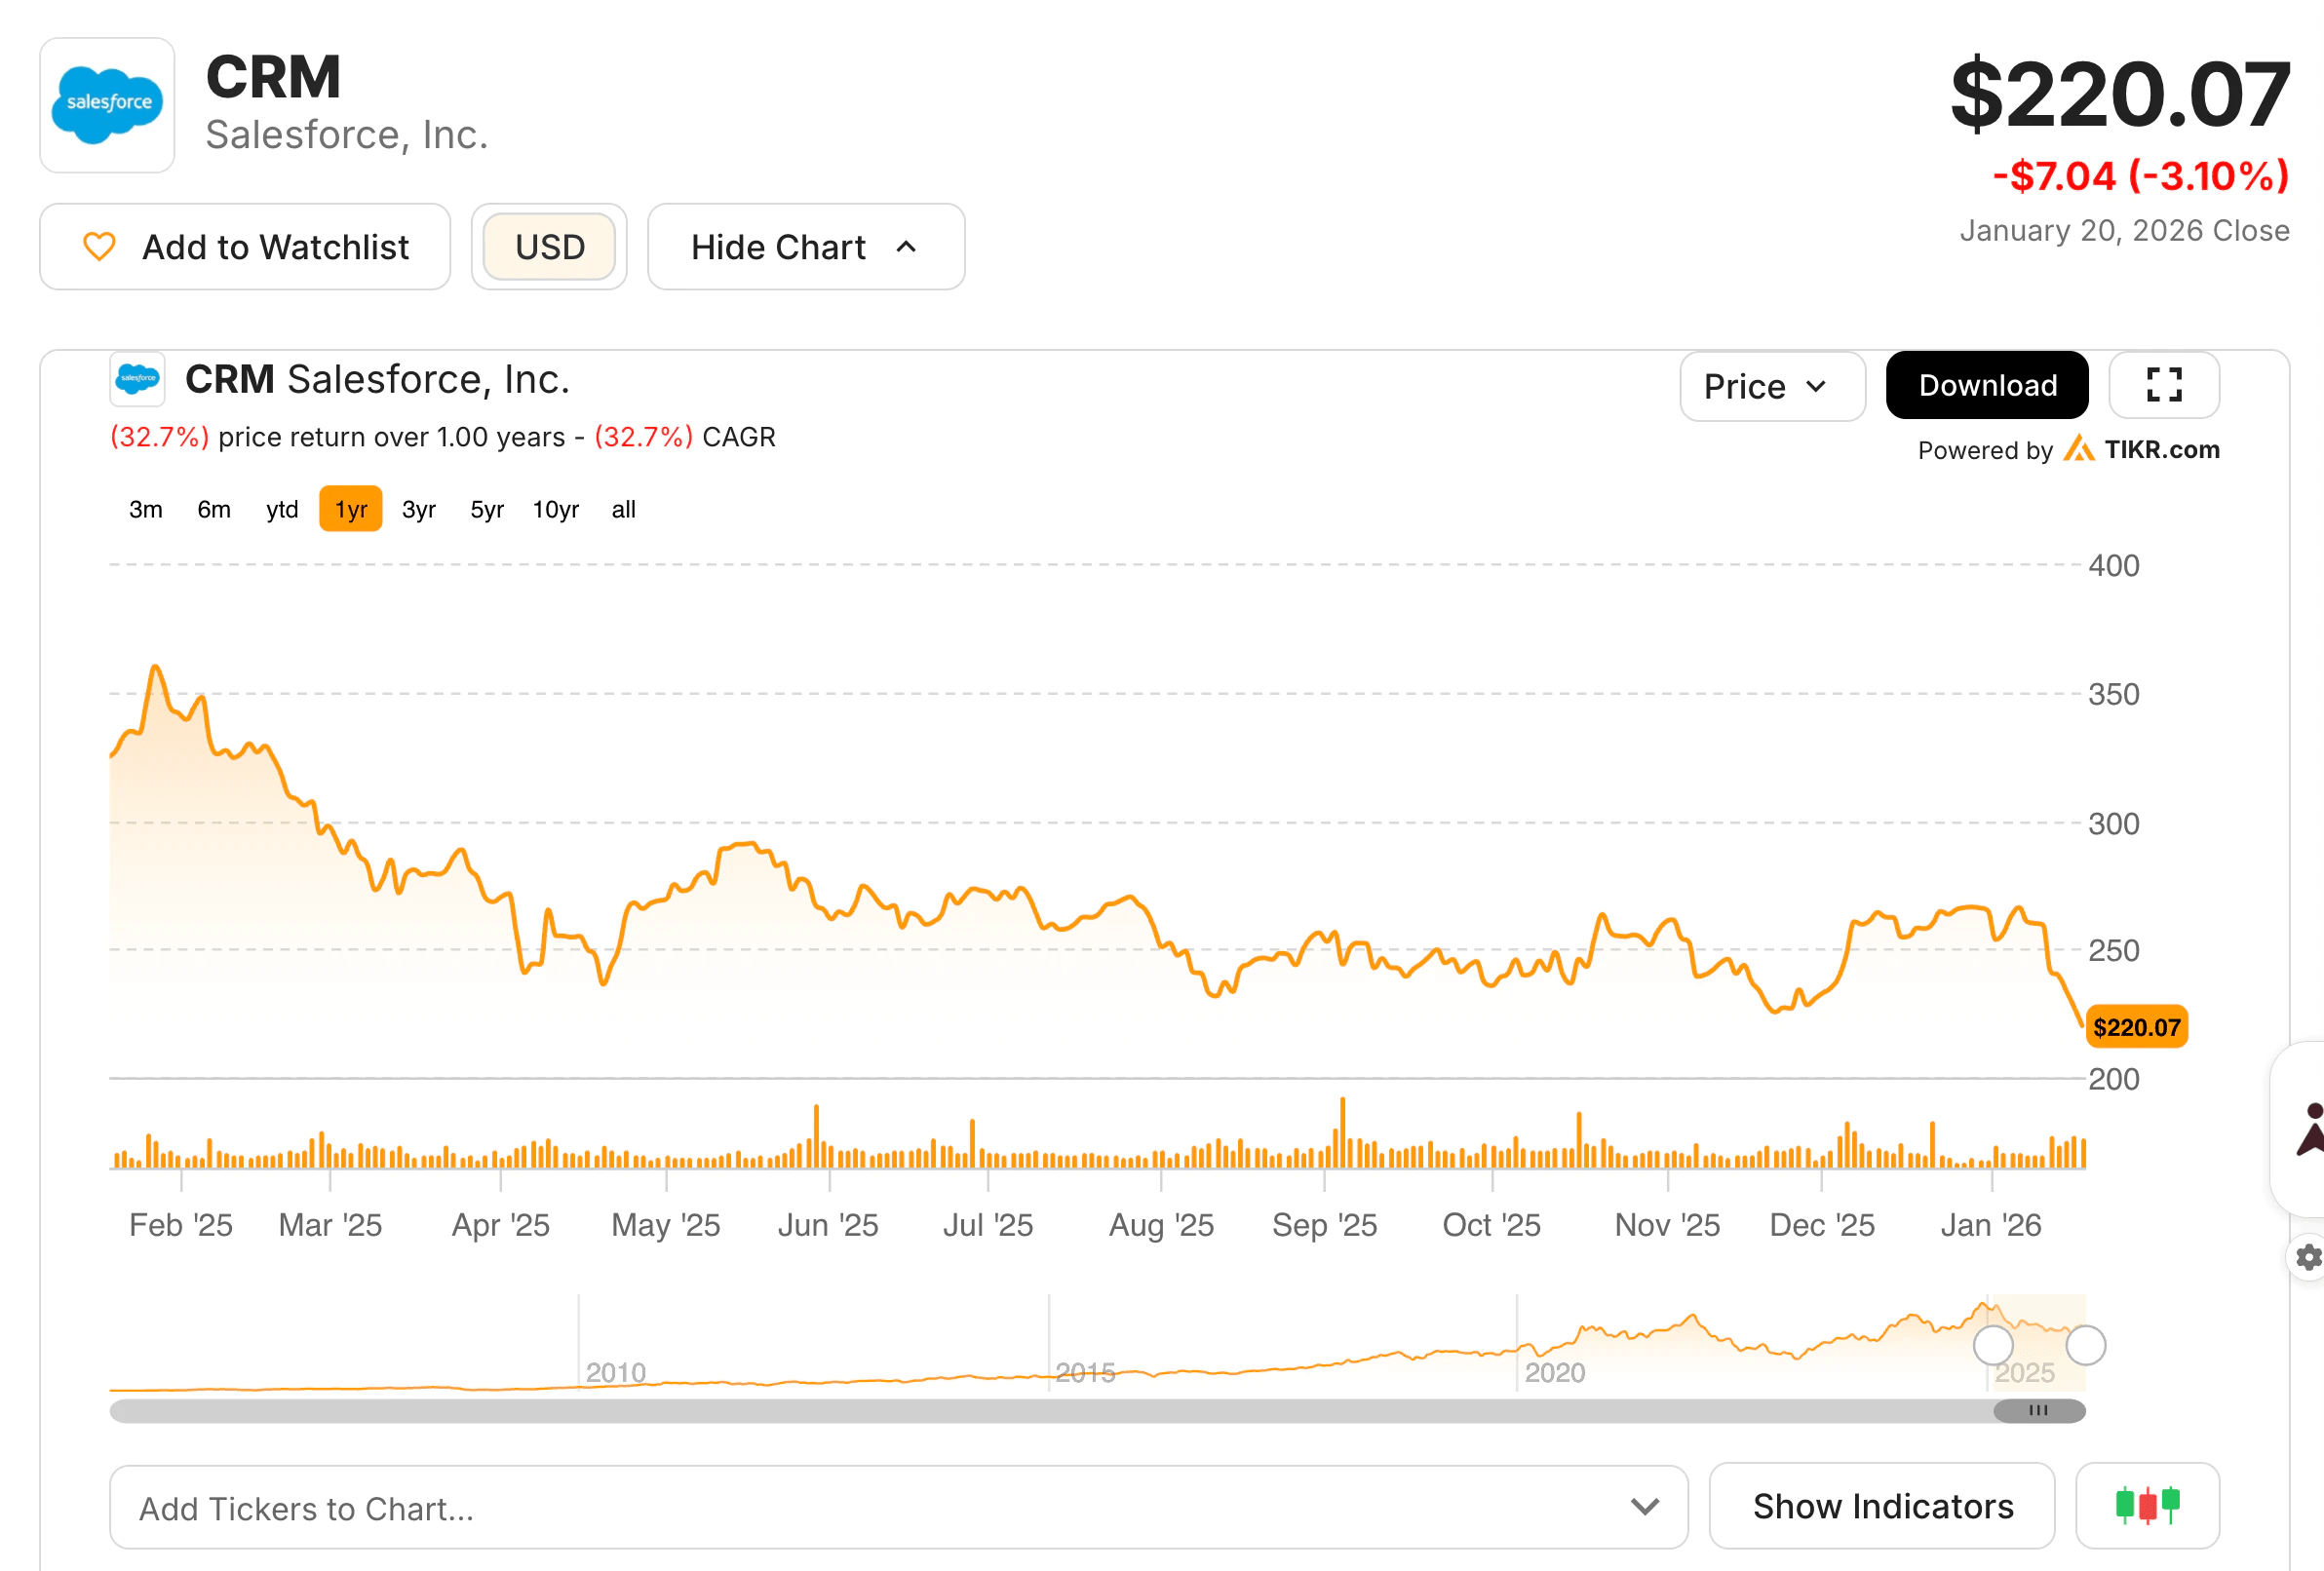
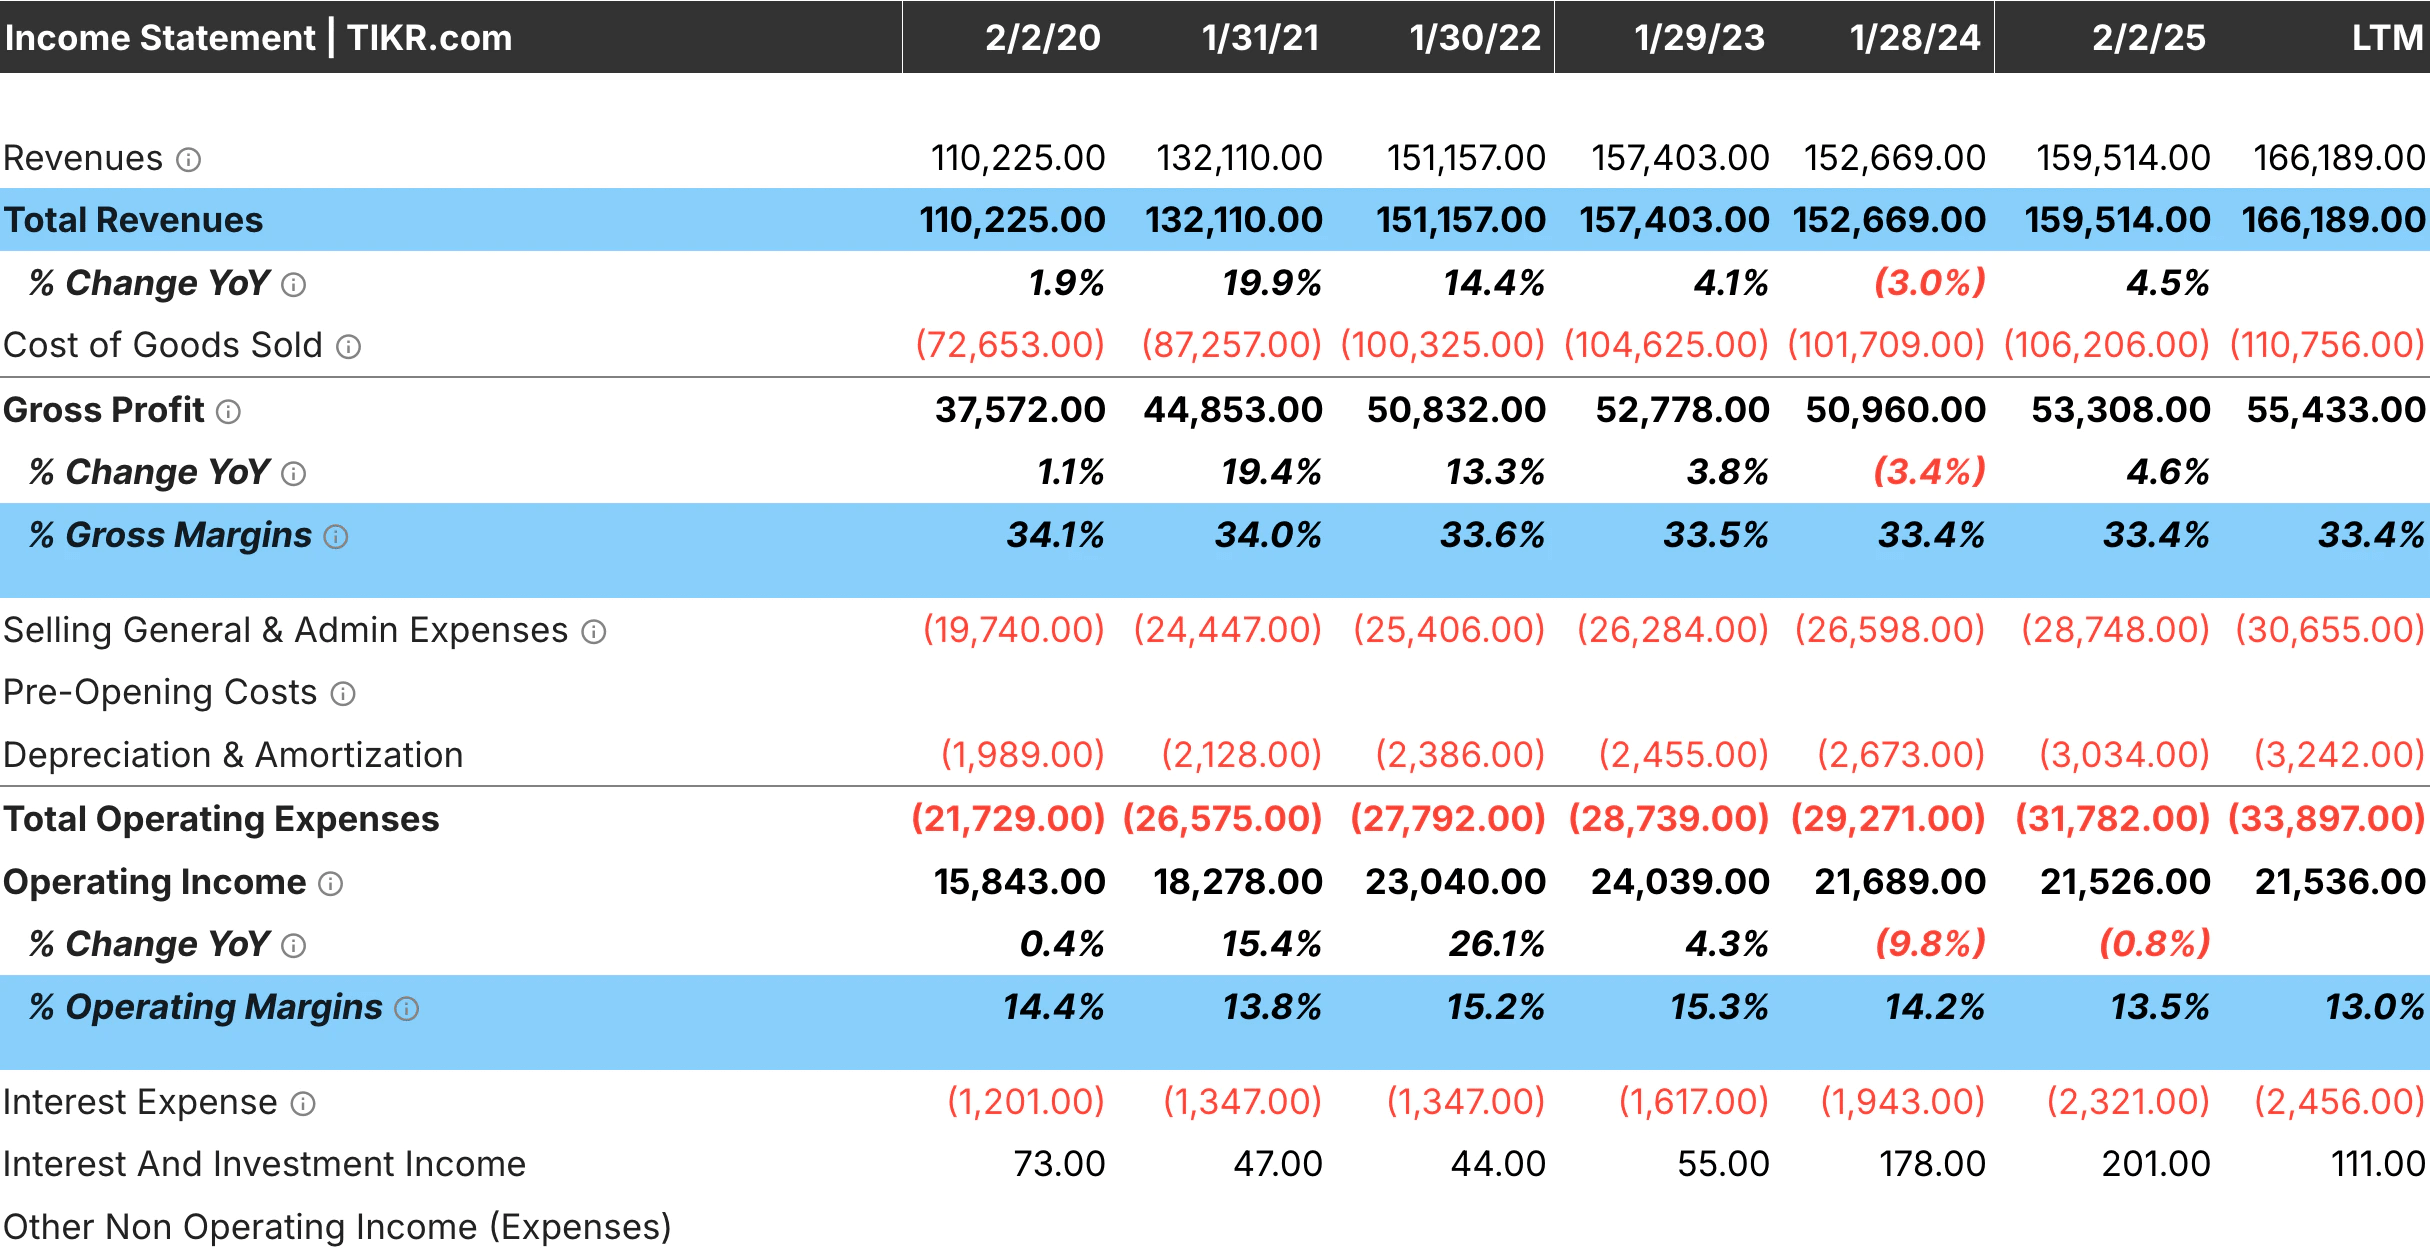
Once you run a screen in TIKR, you see a table of results with the metrics you filtered for displayed in columns. Click into any company from the results, and you land directly on that stock’s overview page with full access to detailed financials, valuation history, peer comparisons, ownership data, and transcripts. This integration means you can move from screening to validation without switching tools. You run a screen, identify a few candidates, then immediately check whether revenue growth is accelerating, whether margins are expanding across all segments, and whether the balance sheet is strengthening.
TIKR’s Competitors tab shows you how each company stacks up against its closest peers across the same metrics you used in your screen. This peer context prevents you from overvaluing companies that look strong in isolation but are merely keeping pace with competitors. It also helps you identify the companies that are genuinely outperforming.
TIKR also lets you save your screens so you can return to them each quarter and see which new companies meet your criteria as data updates. As companies report earnings and analysts update their forecasts, the results refresh automatically. Over time, this feature helps you refine your screening criteria and develop a process that consistently identifies the types of businesses you want to own.
Putting It All Together: A Practical Workflow
Here is how to use free screening tools effectively in combination.
Step 1: Start Broad with FINVIZ or Yahoo Finance. If you want a quick sense of what is available in a particular sector or market cap range, run a basic screen on FINVIZ or Yahoo Finance. These tools are fast and provide a rough starting point without much setup.

Step 2: Move to TIKR for Depth. Once you have a general sense of the space you want to focus on, build a more sophisticated screen in TIKR. Add filters for profitability, growth, capital efficiency, and valuation. Layer in forward estimates if you want to focus on companies where analysts expect improvement. Screen for year-over-year margin expansion or rising ROIC to find businesses with positive momentum.
Step 3: Validate with TIKR’s Financials and Peers. Click into the companies that pass your screen and examine their detailed financials. Check whether the trends are consistent across multiple years. Compare them against peers to see whether their performance is company-specific or industry-wide. Read recent transcripts to understand how management explains the drivers of performance.
Step 4: Build a Shortlist. After reviewing the financials and peer comparisons, narrow your list to the handful of companies that meet all your criteria and show improving fundamentals. These are the stocks worth deeper research and potential inclusion in your portfolio.

This workflow combines the accessibility of FINVIZ and Yahoo Finance with the depth of TIKR, giving you the best of both worlds without paying for expensive institutional tools.
TIKR Takeaway
Free screening tools have come a long way, but most still operate at a surface level. They help you filter the market quickly, but they do not provide the historical context, forward-looking data, or peer comparisons needed to validate that the companies you find are actually high quality.
TIKR fills that gap by combining the speed of a modern screener with the depth of institutional-grade financial data. You can build sophisticated screens based on trends, not just static levels. You can compare companies to their own history and their peers. And you can move seamlessly from screening to validation without leaving the platform.
When you start with clear criteria for what quality looks like, use the right tools to find it, and validate your findings with comprehensive data, you build a research process grounded in evidence rather than guesswork. That process, repeated consistently over time, is what separates investors who find durable compounders from those who chase headlines.
How to Accurately Value a Stock in Under 30 Seconds
All it takes to value a stock with TIKR is three simple inputs:
- Revenue Growth
- Operating Margins
- Exit P/E Multiple
If you’re not sure what assumptions to use, TIKR automatically fills in each input using analysts’ consensus estimates, giving you a quick, reliable starting point.
From there, TIKR calculates the potential share price and total returns under Bull, Base, and Bear scenarios so you can quickly see whether a stock looks undervalued or overvalued.
See a stock’s true value in under 60 seconds (Free with TIKR) >>>
Looking for New Opportunities?
- Discover which stocks billionaire investors are purchasing, so you can follow the smart money.
- Analyze stocks in as little as 5 minutes with TIKR’s all-in-one, easy-to-use platform.
- The more rocks you overturn… the more opportunities you’ll uncover. Search 100K+ global stocks, global top investor holdings, and more with TIKR.
Disclaimer:
Please note that the articles on TIKR are not intended to serve as investment or financial advice from TIKR or our content team, nor are they recommendations to buy or sell any stocks. We create our content based on TIKR Terminal’s investment data and analysts’ estimates. Our analysis might not include recent company news or important updates. TIKR has no position in any stocks mentioned. Thank you for reading, and happy investing!