

Key Takeaways:
- Growth Engine: Eli Lilly delivered about $59 billion in LTM revenue, reflecting strong demand across diabetes, obesity, and oncology franchises.
- Margin Expansion: Operating margins reached roughly 44%, highlighting scale benefits from high-margin GLP-1 therapies and disciplined expense growth.
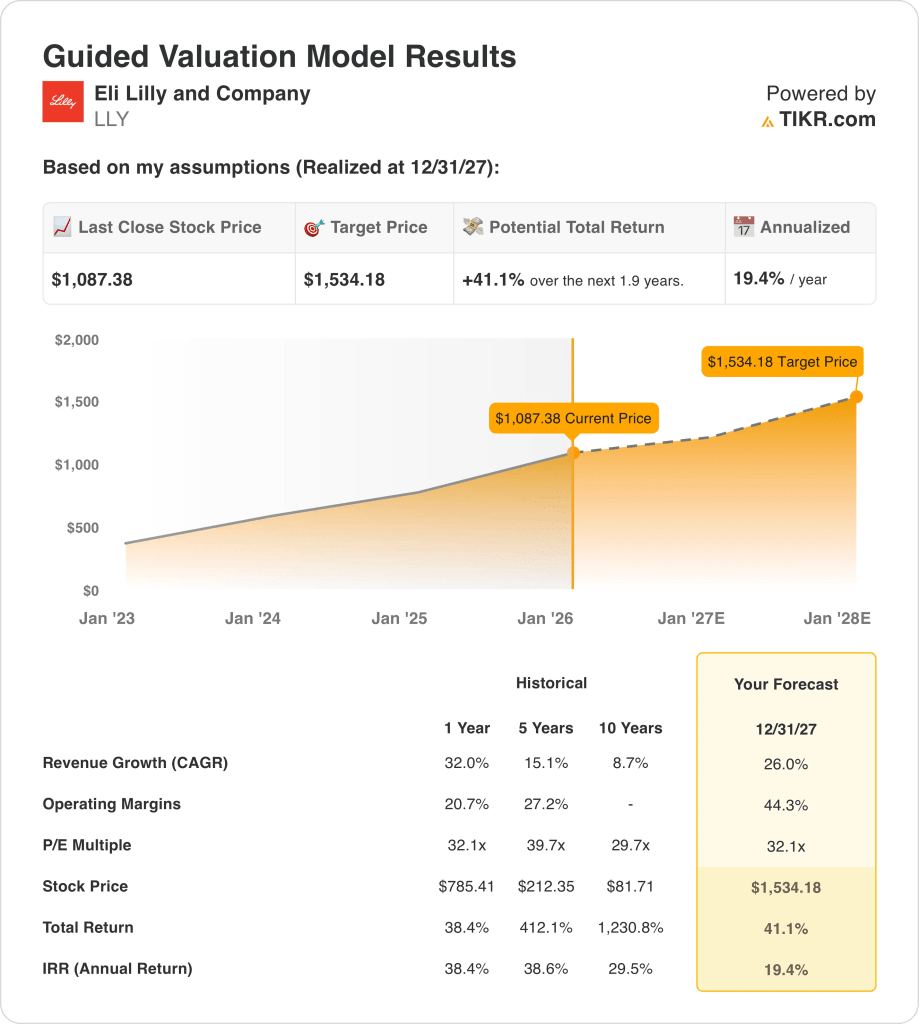
- Price Target: Based on current growth and profitability assumptions, Eli Lilly stock could reach $1,534 by the end of 2027.
- Return Profile: This target implies a 41% total return from $1,087, translating to about 19% annualized returns over roughly two years.
Eli Lilly and Company (LLY) develops branded pharmaceuticals, generating about $59 billion in LTM revenue from diabetes, obesity, oncology, and immunology treatments.
Recent progress in obesity and AI-driven drug discovery partnerships strengthens LLY stock’s pipeline, reinforcing long-term positioning across large therapeutic markets.
Eli Lilly stock posted roughly $6 billion in quarterly net income, showing how rapid revenue growth is translating into accelerating profitability.
LLY stock’s operating margins near 44% and a market capitalization above $1 trillion reflect premium pricing power and manufacturing scale across high-demand therapies.
Even as revenue and margins expand rapidly, the current valuation raises questions about how much future pipeline success is already priced in.
What the Model Says for LLY Stock
We evaluated Eli Lilly stock using assumptions tied to GLP-1 scale economics, expanding pipelines, and sustained global pharmaceutical demand.
Using 26.0% revenue growth, 44.3% operating margins, and a 32.1x exit multiple, the model projects shares rising to $1,534.18.
That implies a 41.1% total return, or 19.4% annualized, over roughly 1.9 years to the $1,534.18 target.
Our Valuation Assumptions
TIKR’s Valuation Model lets you plug in your own assumptions for a company’s revenue growth, operating margins, and P/E multiple, and calculates the stock’s expected returns.
Here’s what we used for LLY stock:
1. Revenue Growth: 26%
Eli Lilly stock generated rapid revenue expansion over recent years, supported by diabetes and obesity therapies that materially reshaped its sales base.
Recent quarterly revenue reached $18 billion, up 54% year over year, confirming sustained demand momentum across GLP-1 and oncology portfolios.
Forward growth remains supported by Mounjaro, Zepbound, and pipeline submissions like orforglipron, balanced against pricing scrutiny and manufacturing scale risks.
A 26% revenue growth assumption reflects continued volume expansion tempered by normalization after exceptional launch-driven growth.
2. Operating Margins: 44.3%
LLY stock’s operating margins expanded sharply as gross margins exceeded 80%, reflecting scale benefits from high-value specialty drugs and biologics.
Recent quarterly EBIT margins reached roughly 45%, demonstrating improved cost absorption despite elevated R&D investment and capacity expansion.
Margin durability depends on maintaining premium pricing and supply discipline as obesity volumes scale across global markets.
A 44.3% operating margins balance strong product mix against ongoing investment in manufacturing and clinical development.
3. Exit P/E Multiple: 32.1x
LLY stock has historically traded at earnings multiples between roughly 30× and 40× during periods of sustained innovation-led growth.
Current valuation reflects investor confidence in long-duration GLP-1 cash flows, offset by caution around competition, pricing reform, and pipeline execution.
Sustaining this multiple requires continued trial success, regulatory approvals, and disciplined capital deployment rather than incremental expansion.
A 32.1× exit multiple reflects balanced expectations for durable earnings growth without assuming further valuation inflation.
What Happens If Things Go Better or Worse?
Eli Lilly stock’s outcomes depend on obesity demand durability, pipeline execution, and manufacturing scale discipline, setting up varied paths through 2029.
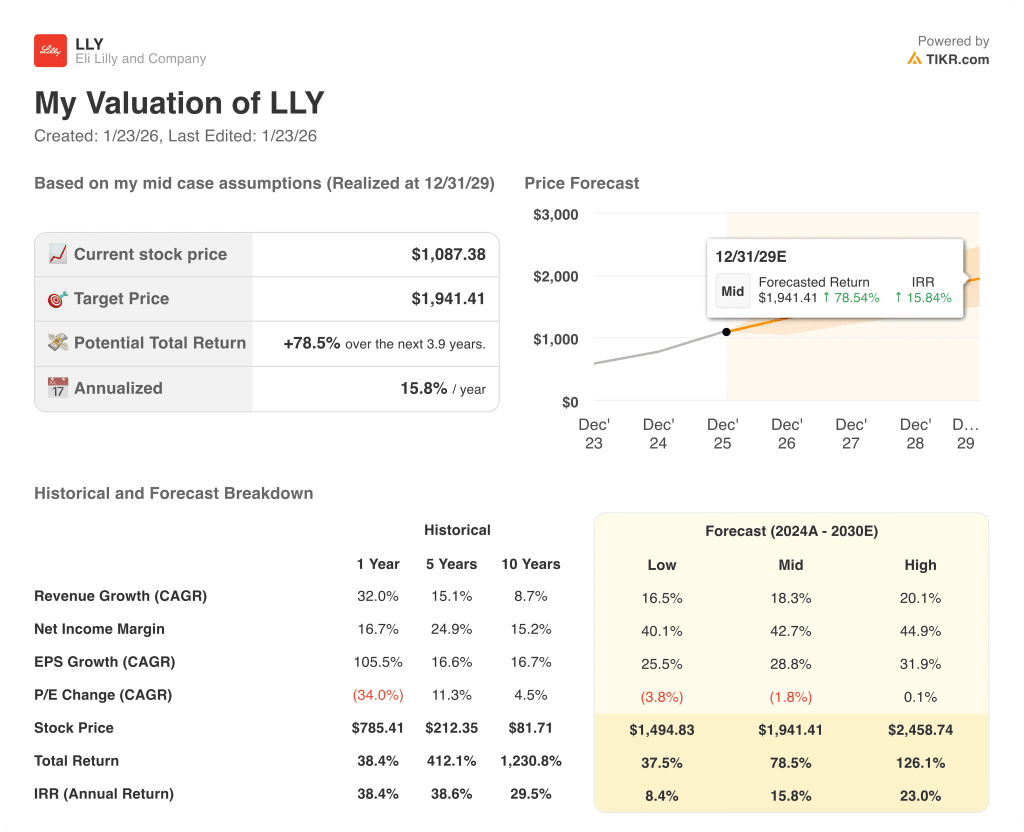
- Low Case: If supply expansion slows and pricing pressure rises, revenue grows around 16.5% with margins near 40.1% → 8.4% annualized return.
- Mid Case: With GLP-1 demand holding and execution steady, revenue growth near 18.3% and margins improving toward 42.7% → 15.8% annualized return.
- High Case: If capacity ramps smoothly and pipeline wins continue, revenue reaches about 20.1% and margins approach 44.9% → 23.0% annualized return.
The $1,941 mid-case target price is achievable through volume growth and margin discipline, without relying on multiple expansion or market hype.
How Much Upside Does It Have From Here?
With TIKR’s new Valuation Model tool, you can estimate a stock’s potential share price in under a minute.
All it takes is three simple inputs:
- Revenue Growth
- Operating Margins
- Exit P/E multiple
If you’re not sure what to enter, TIKR automatically fills in each input using analysts’ consensus estimates, giving you a quick, reliable starting point.
From there, TIKR calculates the potential share price and total returns under Bull, Base, and Bear scenarios so you can quickly see whether a stock looks undervalued or overvalued.
Looking for New Opportunities?
- See what stocks billionaire investors are buying so you can follow the smart money.
- Analyze stocks in as little as 5 minutes with TIKR’s all-in-one, easy-to-use platform.
- The more rocks you overturn… the more opportunities you’ll uncover. Search 100K+ global stocks, global top investor holdings, and more with TIKR.
Disclaimer:
Please note that the articles on TIKR are not intended to serve as investment or financial advice from TIKR or our content team, nor are they recommendations to buy or sell any stocks. We create our content based on TIKR Terminal’s investment data and analysts’ estimates. Our analysis might not include recent company news or important updates. TIKR has no position in any stocks mentioned. Thank you for reading, and happy investing!


