Key Takeaways:
- Arkema is repositioning around higher‑margin specialty materials, and its three core segments give it diversified exposure across construction, industrial, and advanced technology end markets.
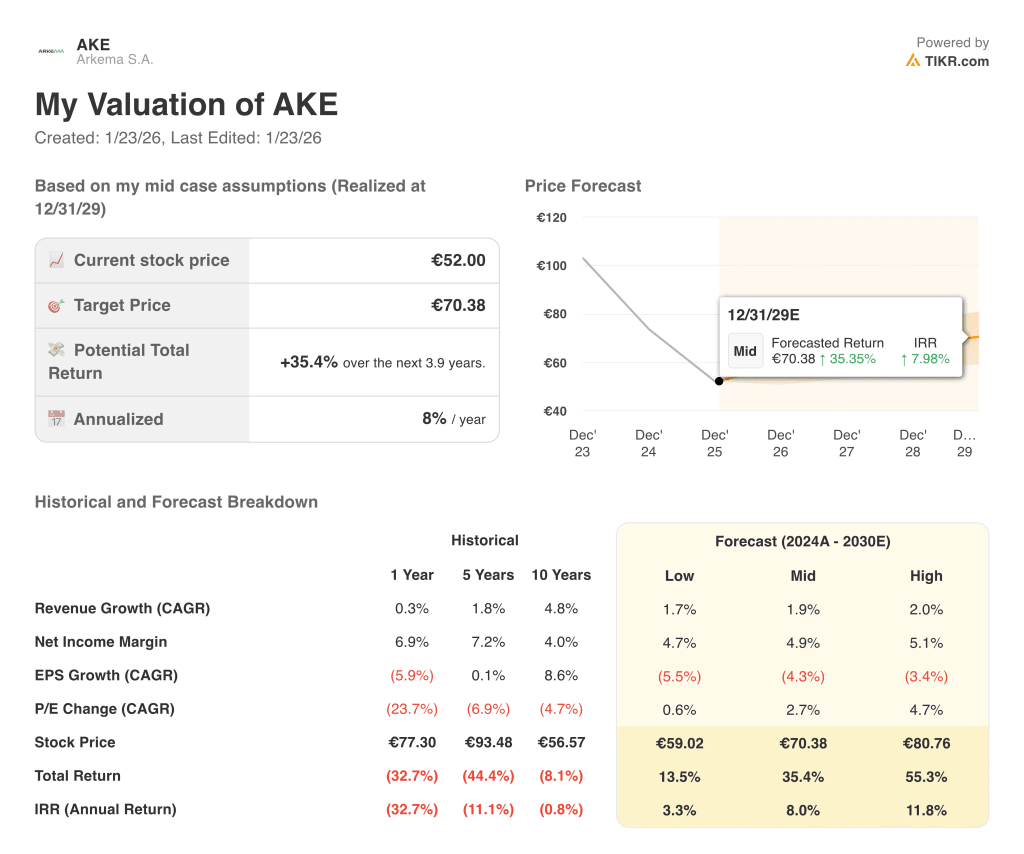
- AKE stock could reasonably reach €70 per share by December 2029, based on our valuation assumptions.
- This implies a total return of 35.4% from today’s price of €52, with an annualized return of 8.0% over the next 4.0 years.
Arkema S.A. (AKE) is reshaping its portfolio toward specialty materials that serve fast‑growing applications in batteries, lightweight mobility, construction solutions, and advanced coatings.
The company operates through Adhesive Solutions, Advanced Materials and Coating Solutions, and Intermediates, so it can balance cyclical industrial volumes with higher‑value technologies such as specialty polymers and performance additives.
The Adhesive Solutions segment provides solutions for construction, renovation, DIY, durable goods, and packaging, and it supplies technologies used in building activities such as sealants, tile adhesives, flooring adhesives, and waterproofing systems.
Advanced Materials and Coating Solutions adds exposure to EU/US acrylics, coating resins, photocure resins, and rheology additives, which support decorative paints, industrial coatings, and water treatment and 3D printing markets.
Here’s why Arkema stock could continue to reward shareholders through 2029, driven by its ties to global manufacturing and construction cycles.
What the Model Says for Arkema Stock
We analyzed the upside potential for Arkema stock using valuation assumptions based on its focus on specialty materials while navigating soft industrial demand and input‑cost volatility.
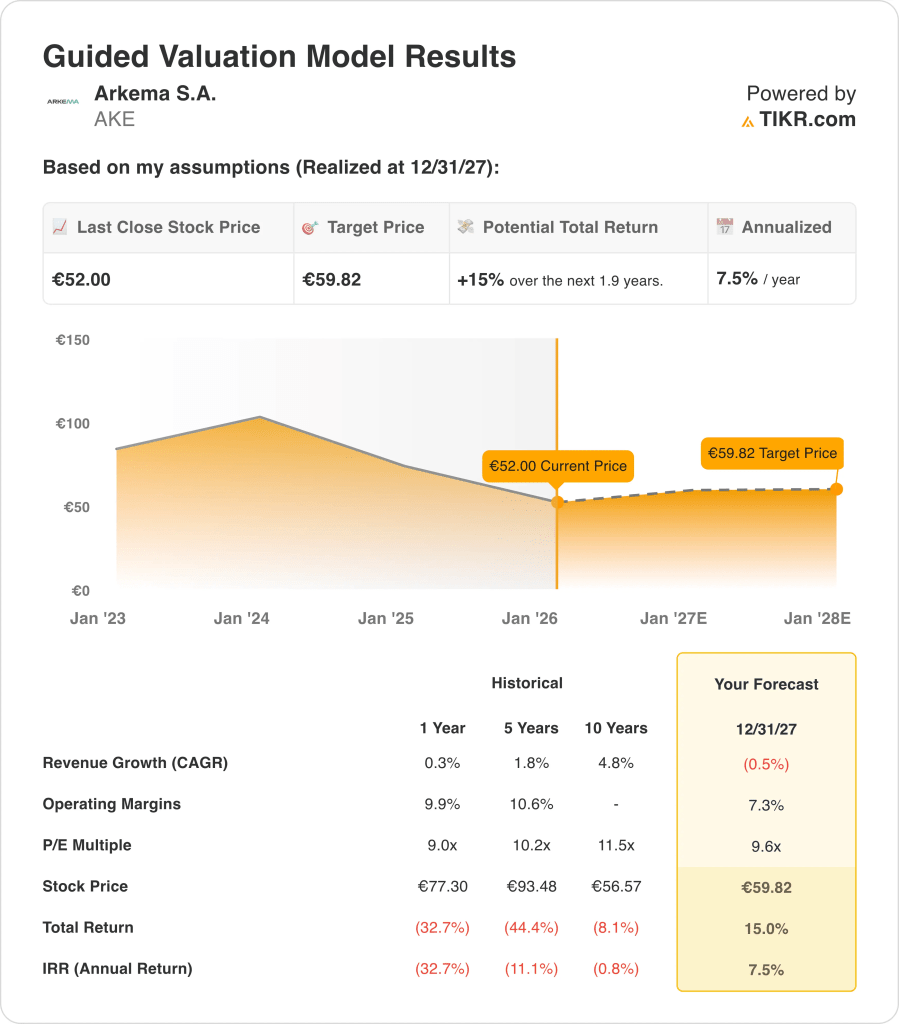
Based on estimates of -0.5% annual revenue growth, 7.3% operating margins, and a normalized exit P/E multiple of 9.6x, the model projects Arkema stock could rise from €52 to €60 per share.
That would be a 15% total return, or a 7.5% annualized return over the next 2.0 years.
Our Valuation Assumptions
TIKR’s Valuation Model lets you plug in your own assumptions for a company’s revenue growth, operating margins, and P/E multiple, and calculates the stock’s expected returns.
Here’s what we used for Arkema stock:
1. Revenue Growth: -0.5%
Arkema’s historical revenue growth has been moderate, with a 10‑year revenue CAGR below 5% as the company has managed portfolio repositioning and end‑market cyclicality.
Based on analysts’ consensus estimates, we assume a -0.5% annual revenue decline through 2027, reflecting cautious expectations around construction, coatings, and industrial demand as well as ongoing destocking in some product lines.
This slightly negative growth rate underscores that the current base case does not rely on a strong volume rebound or significant pricing tailwind in the near term.
Instead, it assumes Arkema uses its specialty materials portfolio to defend profitability even if reported sales edge down, with higher‑value products helping to cushion the impact of softer macro conditions.
2. Operating Margins: 7.3%
The company’s operating margins have historically hovered around low‑double‑digit levels, but they have come under pressure recently due to weaker volumes, cost inflation, and the impact of lower‑margin intermediates.
Based on analysts’ consensus estimates, we assume a 7.3% operating margin by 2027–2030, which sits below Arkema’s best historical years but reflects an environment where specialty products slowly offset cyclical drag from more commoditized businesses.
Management continues to optimize the portfolio, and the greater focus on adhesives and advanced materials should support mix‑driven profitability, yet the model embeds only cautious improvement because industrial demand can remain volatile.
3. Exit P/E Multiple: 9.6x
Arkema’s shares have historically traded at a single‑digit to low‑teens earnings multiple, reflecting the combination of specialty materials exposure and remaining intermediates cyclicality.
Based on analysts’ consensus estimates, we use a 9.6x exit P/E multiple, which is in line with recent trading ranges and embeds a modest discount to higher‑growth specialty chemical peers because Arkema’s growth profile is more moderate.
Maintaining this 9.6x multiple assumes the market continues to view Arkema as a balanced industrial‑specialty player rather than re‑rating it as a pure specialty chemicals franchise.
Build your own Valuation Model to value any stock (It’s free!) >>>
What Happens If Things Go Better or Worse?
Different scenarios for AKE stock through 2030 show varied outcomes based on revenue growth, profitability, and valuation multiples (these are estimates, not guaranteed returns):
- Low Case: Revenue grows 1.7% annually, operating margins stay closer to current levels → 6.2% annual returns
- Mid Case: Revenue increases 1.9% per year, and margins improve toward 7.3% → 11.9% annual returns
- High Case: Revenue growth edges up to 2.0% with stronger margin expansion and a slightly higher implied valuation → 16.9% annual returns
Only the high‑case scenario clears the 10% annualized threshold, and it would likely require better‑than‑expected demand recovery and margin improvement across key end markets.
See what analysts think about AKE stock right now (Free with TIKR) >>>
How Much Upside Does Arkema Stock Have From Here?
With TIKR’s new Valuation Model tool, you can estimate a stock’s potential share price in under a minute.
All it takes is three simple inputs:
- Revenue Growth
- Operating Margins
- Exit P/E Multiple
If you’re not sure what to enter, TIKR automatically fills in each input using analysts’ consensus estimates, giving you a quick, reliable starting point.
From there, TIKR calculates the potential share price and total returns under Bull, Base, and Bear scenarios so you can quickly see whether a stock looks undervalued or overvalued.
See a stock’s true value in under 60 seconds (Free with TIKR) >>>
Looking for New Opportunities?
- See what stocks billionaire investors are buying so you can follow the smart money.
- Analyze stocks in as little as 5 minutes with TIKR’s all-in-one, easy-to-use platform.
- The more rocks you overturn… the more opportunities you’ll uncover. Search 100K+ global stocks, global top investor holdings, and more with TIKR.
Disclaimer:
Please note that the articles on TIKR are not intended to serve as investment or financial advice from TIKR or our content team, nor are they recommendations to buy or sell any stocks. We create our content based on TIKR Terminal’s investment data and analysts’ estimates. Our analysis might not include recent company news or important updates. TIKR has no position in any stocks mentioned. Thank you for reading, and happy investing!