Key Stats for BAH Stock
- Past-Week Performance: 8%
- 52-Week Range: $79 to $138
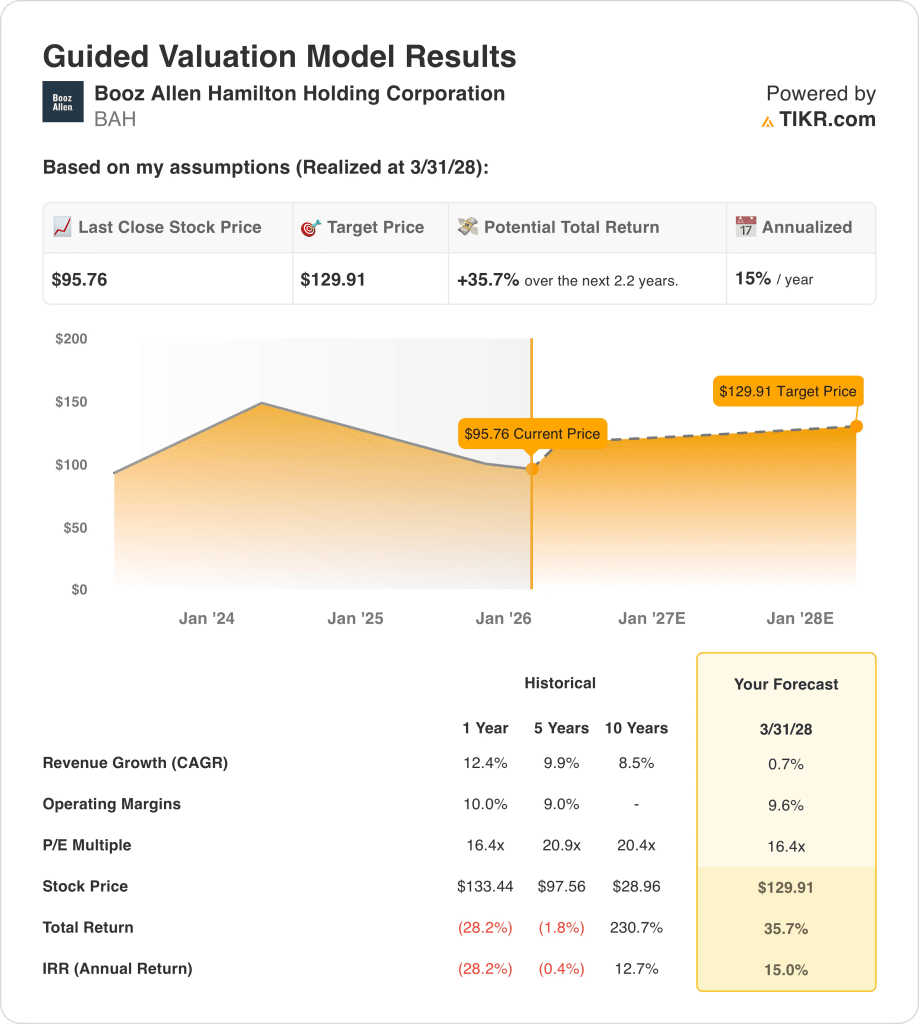
- Valuation Model Target Price: $130
- Implied Upside: 36% over 2.2 years
What Happened?
Booz Allen Hamilton Holdings stock (BAH) rose about 8% in the fourth week of January following an earnings and guidance reaction.
The move followed FY2026 adjusted EPS guidance of $5.95–$6.15, exceeding consensus $5.62, without analyst rating changes.
The guidance upside mattered because BAH remains valuation-sensitive after a prolonged decline, amplifying reactions to earnings durability signals.
Booz Allen Hamilton’s guidance, demand trends, and long-term outlook remained unchanged, despite temporary revenue pressure from government shutdown disruptions.
This reflects a recalibration of expectations rather than a deterioration in the underlying business.
Is BAH Stock Fairly Valued Right Now?
Under the valuation model shown, the stock is modeled using:
- Revenue Growth: 0.7%
- Operating Margins: 9.6%
- Exit P/E Multiple: 16.4x
Under valuation model assumptions realized through March 2028, Booz Allen Hamilton Holding Corporation stock is assessed conditionally based on modeled growth, margins, and valuation.
The model assumes 0.7% revenue CAGR, 9.6% operating margins, and a 16.4x exit P/E multiple.
Based on these inputs, the model estimates a $130 target price, implying 35.7% total return, or 15% annually.
Execution depends on sustaining margins through cost discipline, stable government demand, and backlog conversion supporting modest revenue growth assumptions.
Booz Allen Hamilton stock’s valuation reflects execution risk and sensitivity to assumptions, meaning outcomes depend on operational delivery rather than guaranteed re-rating.
Value Any Stock in Under 60 Seconds (It’s Free)
With TIKR’s new Valuation Model tool, you can estimate a stock’s potential share price in under a minute.
All it takes is three simple inputs:
- Revenue Growth
- Operating Margins
- Exit P/E Multiple
From there, TIKR calculates the potential share price and total returns under Bull, Base, and Bear scenarios so you can quickly see whether a stock looks undervalued or overvalued.
If you’re not sure what to enter, TIKR automatically fills in each input using analysts’ consensus estimates, giving you a quick, reliable starting point.