Key Takeaways:
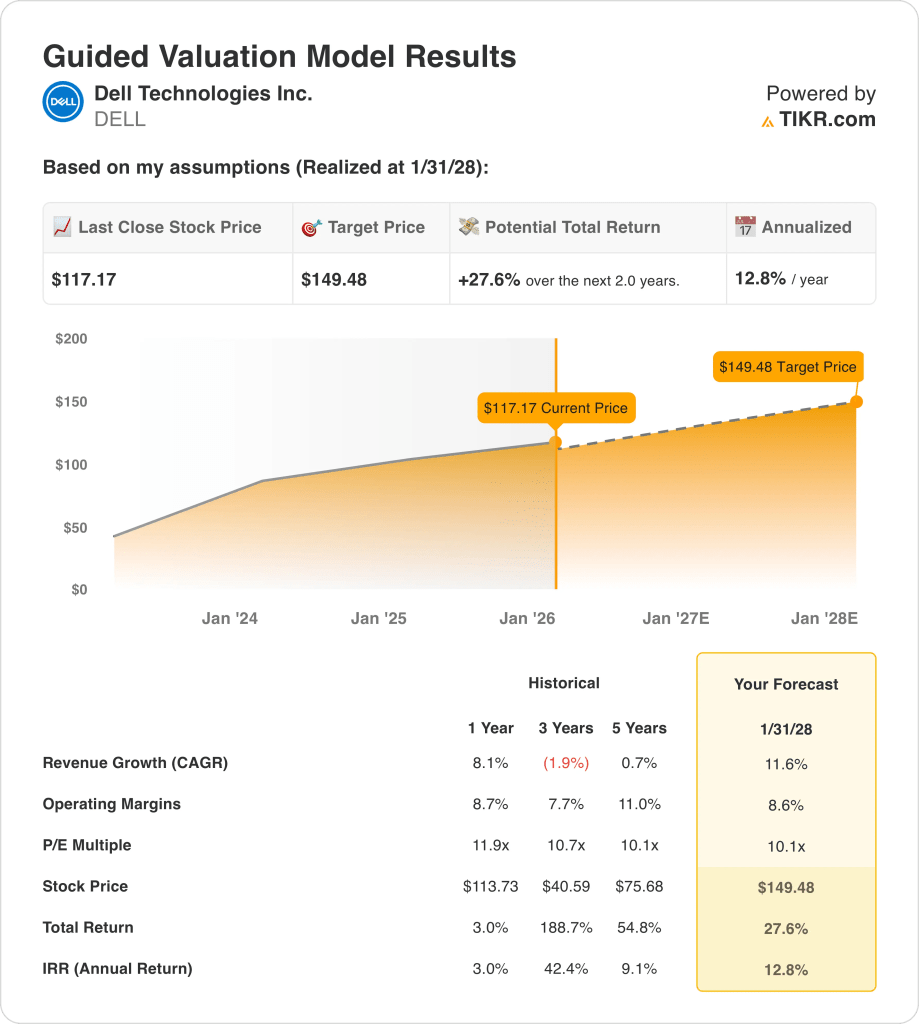
- Price Target: Dell Technologies stock carries a modeled value of $149 by 2028 based on earnings growth and a 10x P/E multiple.
- Upside Potential: The $149 target implies a 28% total return from the current price of $117 over the next 2 years.
- Annualized Return: This scenario represents a 13% annual return, reflecting earnings expansion rather than multiple re-rating.
- Earnings Profile: Dell Technologies operates at an 9% operating margin, supporting steady profit growth on expanding infrastructure demand.
Dell Technologies (DELL) designs and sells enterprise infrastructure and client hardware, reporting $27 billion in quarterly revenue across global commercial markets.
Recent TikTok joint venture disclosures highlighted Dell founder participation, reinforcing Dell’s strategic exposure to secure cloud and data infrastructure demand.
Dell stock reported $27 in quarterly revenue and $2 in adjusted EPS, showing profitability leverage as operating margins reached 9%.
With an $80 billion market cap, Dell’s growth depends on AI server demand and enterprise refresh cycles supporting infrastructure sales.
Despite earnings growth and a conservative 10x multiple, the share price reflects caution, leaving upside potential intact.
What the Model Says for DELL Stock
We assessed Dell Technologies using operating performance, capital efficiency, and infrastructure positioning reflected in its guided valuation framework.
Assuming 11.6% revenue growth, 8.6% operating margins, and a 10.1x exit P/E, the model projects value expansion.
That framework yields a $149.48 target price, representing a 27.6% total return and a 12.8% annual return.
Our Valuation Assumptions
TIKR’s Valuation Model lets you plug in your own assumptions for a company’s revenue growth, operating margins, and P/E multiple, and calculates the stock’s expected returns.
Here’s what we used for DELL stock:
1. Revenue Growth: 11.6%
Dell’s trailing revenue reached 104, rebounding from prior declines as infrastructure demand stabilized and enterprise spending normalized across core markets.
Quarterly revenue of 27 highlights growth recovery, supported by AI server demand and commercial refresh cycles across segments.
Growth risks include cyclical PC demand and government spending variability, while support comes from enterprise backlog visibility and diversified end markets.
According to consensus analyst estimates, an 11.6% revenue growth assumption reflects sustained infrastructure momentum balanced against mature client hardware exposure.
2. Operating Margins: 8.6%
Dell’s operating margins expanded to roughly 7 historically, reflecting disciplined cost control and scale benefits despite revenue volatility.
Recent results show margins near 9, supported by higher-margin infrastructure mix and stable operating expense growth relative to revenue.
Margin pressure risks include pricing competition and input costs, while support comes from AI server mix and services contribution.
An 8.6% operating margin assumes normalized profitability above historical averages without requiring aggressive cost actions.
3. Exit P/E Multiple: 10.1x
Dell has historically traded between roughly 10x and 12x earnings during stable demand periods with moderate growth visibility.
Current valuation reflects cautious sentiment despite earnings recovery, as investors weigh cyclicality and capital intensity against improving profit trends.
Multiple expansion risks include macro slowdown, while support comes from earnings consistency and balance sheet discipline.
Based on street consensus estimates, a 10.1x exit multiple balances improving execution with persistent market caution.
These assumptions imply a $149 target price, a 27.6% total return, and a 12.8% annual return.
What Happens If Things Go Better or Worse?
Dell stock’s outcomes depend on enterprise infrastructure demand, client refresh cycles, and cost discipline, creating a wide execution range through 2030.
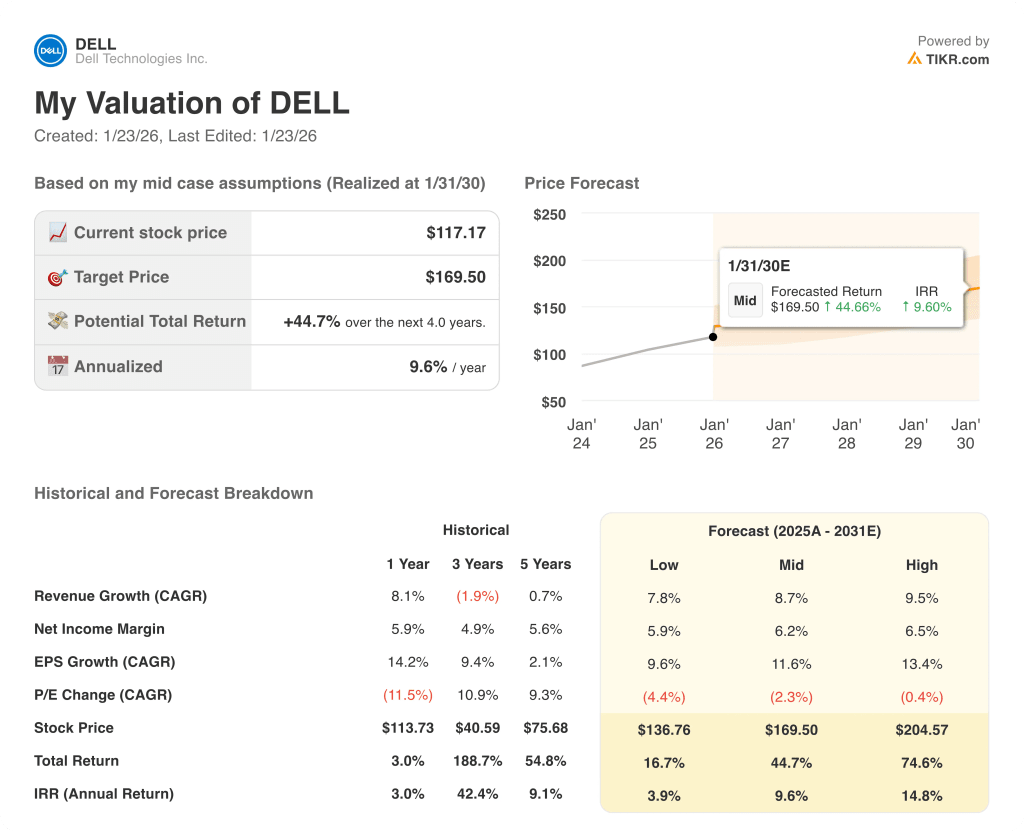
- Low Case: If enterprise spending stays cautious and PCs lag, revenue grows 7.8% with margins near 5.9% → 3.9% annualized return.
- Mid Case: With core infrastructure demand holding and execution steady, revenue grows 8.7% and margins reach 6.2% → 9.6% annualized return.
- High Case: If AI servers scale and cost efficiency improves, revenue reaches 9.5% with margins near 6.5% → 14.8% annualized return.
The $169.50 mid-case target price is achievable through execution consistency and earnings growth, without requiring valuation multiple expansion or market enthusiasm.
How Much Upside Does It Have From Here?
With TIKR’s new Valuation Model tool, you can estimate a stock’s potential share price in under a minute.
All it takes is three simple inputs:
- Revenue Growth
- Operating Margins
- Exit P/E multiple
If you’re not sure what to enter, TIKR automatically fills in each input using analysts’ consensus estimates, giving you a quick, reliable starting point.
From there, TIKR calculates the potential share price and total returns under Bull, Base, and Bear scenarios so you can quickly see whether a stock looks undervalued or overvalued.
See a stock’s true value in under 60 seconds (Free with TIKR) >>>
Looking for New Opportunities?
- See what stocks billionaire investors are buying so you can follow the smart money.
- Analyze stocks in as little as 5 minutes with TIKR’s all-in-one, easy-to-use platform.
- The more rocks you overturn… the more opportunities you’ll uncover. Search 100K+ global stocks, global top investor holdings, and more with TIKR.
Disclaimer:
Please note that the articles on TIKR are not intended to serve as investment or financial advice from TIKR or our content team, nor are they recommendations to buy or sell any stocks. We create our content based on TIKR Terminal’s investment data and analysts’ estimates. Our analysis might not include recent company news or important updates. TIKR has no position in any stocks mentioned. Thank you for reading, and happy investing!