Key Takeaways:
- Revenue Momentum: Carvana stock posted 27% revenue growth last year, showing recovery as vehicle volumes and pricing stabilized.
- Margin Turnaround: Operating margins reached 10%, reflecting improved reconditioning efficiency and tighter cost control across logistics.
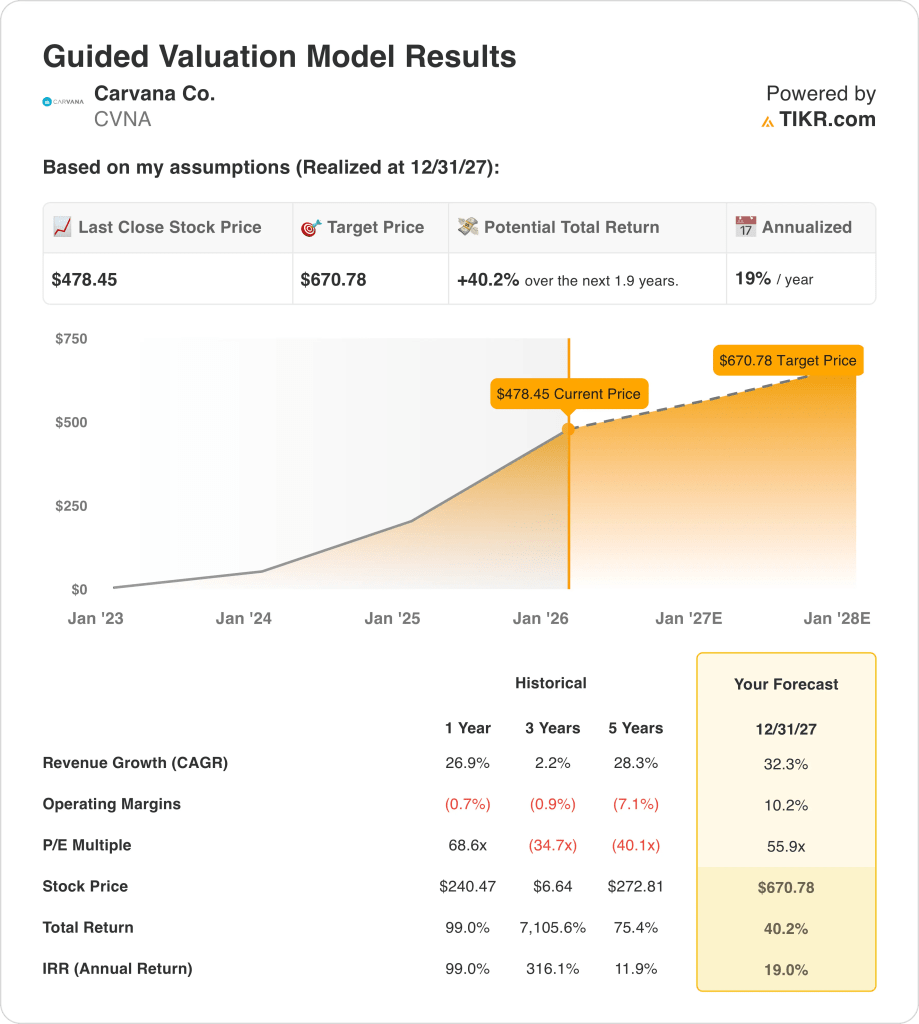
- Price Projection: Based on current assumptions, Carvana stock could reach $671 by December 2027 as profitability normalizes.
- Return Profile: This implies 40% total upside from $478, translating to about 19% annualized returns over 2 years.
Carvana Co. (CVNA) operates a US-based online used car platform and generated $18 billion in LTM revenue from vehicle sales and financing.
Investor focus increased after Carvana confirmed it will report full-year 2025 results on February 18 amid renewed profitability momentum.
Carvana stock’s revenue grew 27% last year as unit sales recovered and pricing discipline improved following aggressive restructuring actions.
Its operating income reached $2 billion LTM with margins near 9%, highlighting operating leverage from scale and reconditioning efficiency.
Even with revenue growth and margin recovery, the stock trades near $478, raising debate over how much turnaround progress is already priced.
What the Model Says for CVNA Stock
We evaluated Carvana stock using assumptions tied to marketplace scale, reconditioning efficiency, and sustained demand recovery across used vehicle categories.
Based on 32.3% revenue growth, 10.2% operating margins, and a 55.9x exit multiple, the model projects continued earnings expansion.
This supports a $671 target price, implying 40.2% total upside and about 19% annualized returns over the next two years.
Our Valuation Assumptions
TIKR’s Valuation Model lets you plug in your own assumptions for a company’s revenue growth, operating margins, and P/E multiple, and calculates the stock’s expected returns.
Here’s what we used for CVNA stock:
1. Revenue Growth: 32.3%
Carvana stock’s revenue rebounded sharply after restructuring, with 27% one-year growth reflecting recovery from prior contraction and restored inventory throughput.
Current growth is supported by higher vehicle turnover, improved logistics utilization, and expanding online conversion across national markets.
Sustaining 32.3% growth depends on used vehicle supply stability and continued demand normalization as affordability improves.
A 32.3% revenue growth reflects rebound momentum tempered by cyclical vehicle pricing and macro sensitivity, supporting roughly 19% annualized returns.
2. Operating Margins: 10.2%
Carvana historically operated at negative margins, making the recent shift to positive profitability a structural inflection in unit economics.
Margins expanded as fixed costs spread across higher volumes and reconditioning efficiency improved after capacity rationalization.
Reaching 10.2% margins requires discipline in logistics costs and stable auction pricing without renewed growth-at-all-costs behavior.
A 10.2% operating margins represent normalized scale economics rather than peak conditions, consistent with a sustainable 19% annualized return profile.
3. Exit P/E Multiple: 55.9x
Carvana’s valuation has expanded materially as profitability returned, though still below earlier speculative peaks during loss-making growth phases.
Investor optimism reflects improved earnings visibility, while caution remains due to leverage and sensitivity to used car pricing cycles.
Maintaining a 55.9x multiple assumes margins persist and earnings volatility remains contained through the cycle.
A 55.9x exit multiple balances recovery credibility with cyclical risk, supporting a $670.78 target and 40.2% total returns.
What Happens If Things Go Better or Worse?
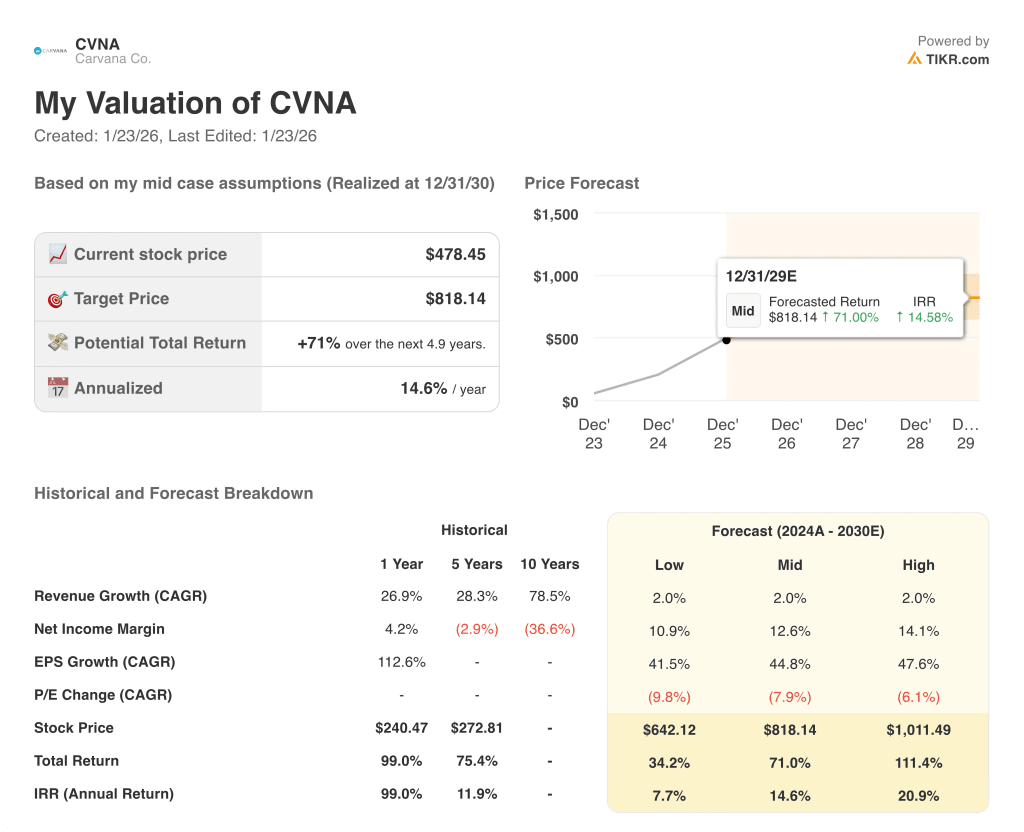
Carvana’s outcomes depend on used vehicle demand, inventory sourcing discipline, and sustained cost control, creating multiple execution paths through 2030.
- Low Case: If demand softens and execution tightens, revenue grows 2.0% and margins stay near 10.9% → 7.7% annualized return.
- Mid Case: With operations stabilizing and volumes holding, revenue grows 2.0% and margins improve toward 12.6% → 14.6% annualized return.
- High Case: If sourcing efficiency strengthens and pricing holds, revenue reaches 2.0% and margins approach 14.1% → 20.9% annualized return.
The $818.14 mid-case target depends on steady execution and margin delivery, achievable without multiple expansion or hype.
How Much Upside Does It Have From Here?
With TIKR’s new Valuation Model tool, you can estimate a stock’s potential share price in under a minute.
All it takes is three simple inputs:
- Revenue Growth
- Operating Margins
- Exit P/E multiple
If you’re not sure what to enter, TIKR automatically fills in each input using analysts’ consensus estimates, giving you a quick, reliable starting point.
From there, TIKR calculates the potential share price and total returns under Bull, Base, and Bear scenarios so you can quickly see whether a stock looks undervalued or overvalued.
Looking for New Opportunities?
- See what stocks billionaire investors are buying so you can follow the smart money.
- Analyze stocks in as little as 5 minutes with TIKR’s all-in-one, easy-to-use platform.
- The more rocks you overturn… the more opportunities you’ll uncover. Search 100K+ global stocks, global top investor holdings, and more with TIKR.
Disclaimer:
Please note that the articles on TIKR are not intended to serve as investment or financial advice from TIKR or our content team, nor are they recommendations to buy or sell any stocks. We create our content based on TIKR Terminal’s investment data and analysts’ estimates. Our analysis might not include recent company news or important updates. TIKR has no position in any stocks mentioned. Thank you for reading, and happy investing!