A company’s moat is what protects its profits from competition over time. Businesses with durable moats can sustain high returns, grow earnings, and compound shareholder value for years. Businesses without moats often see margins shrink as competitors catch up.
The challenge is that moats are inherently qualitative. Brand strength, network effects, switching costs, and cost advantages are difficult to measure directly. But the financial statements tell the story. When a company earns consistently high returns on capital, maintains stable margins through cycles, and grows without destroying value, the numbers reveal the moat.
This guide walks through the key financial ratios that help identify moats, how to interpret them, and where to find them inside TIKR.
Why Financial Ratios Reveal Moats
Moats show up in the numbers because they allow companies to do things competitors cannot. A business with pricing power maintains gross margins even as costs rise. A company with scale advantages earns higher returns on invested capital than smaller rivals. A firm with sticky customers sees stable revenue and predictable cash flow.
Over time, these advantages compound. High returns on capital, reinvested at similar rates, create exponential growth in intrinsic value. That is why long-term investors focus on moats. The ratios do not tell you what the moat is, but they confirm whether one exists and how strong it might be.
TIKR tip: Use TIKR’s Financials and Ratios tabs to compare these metrics across five, ten, or even twenty years of history. Moats reveal themselves through consistency, not single-year snapshots.
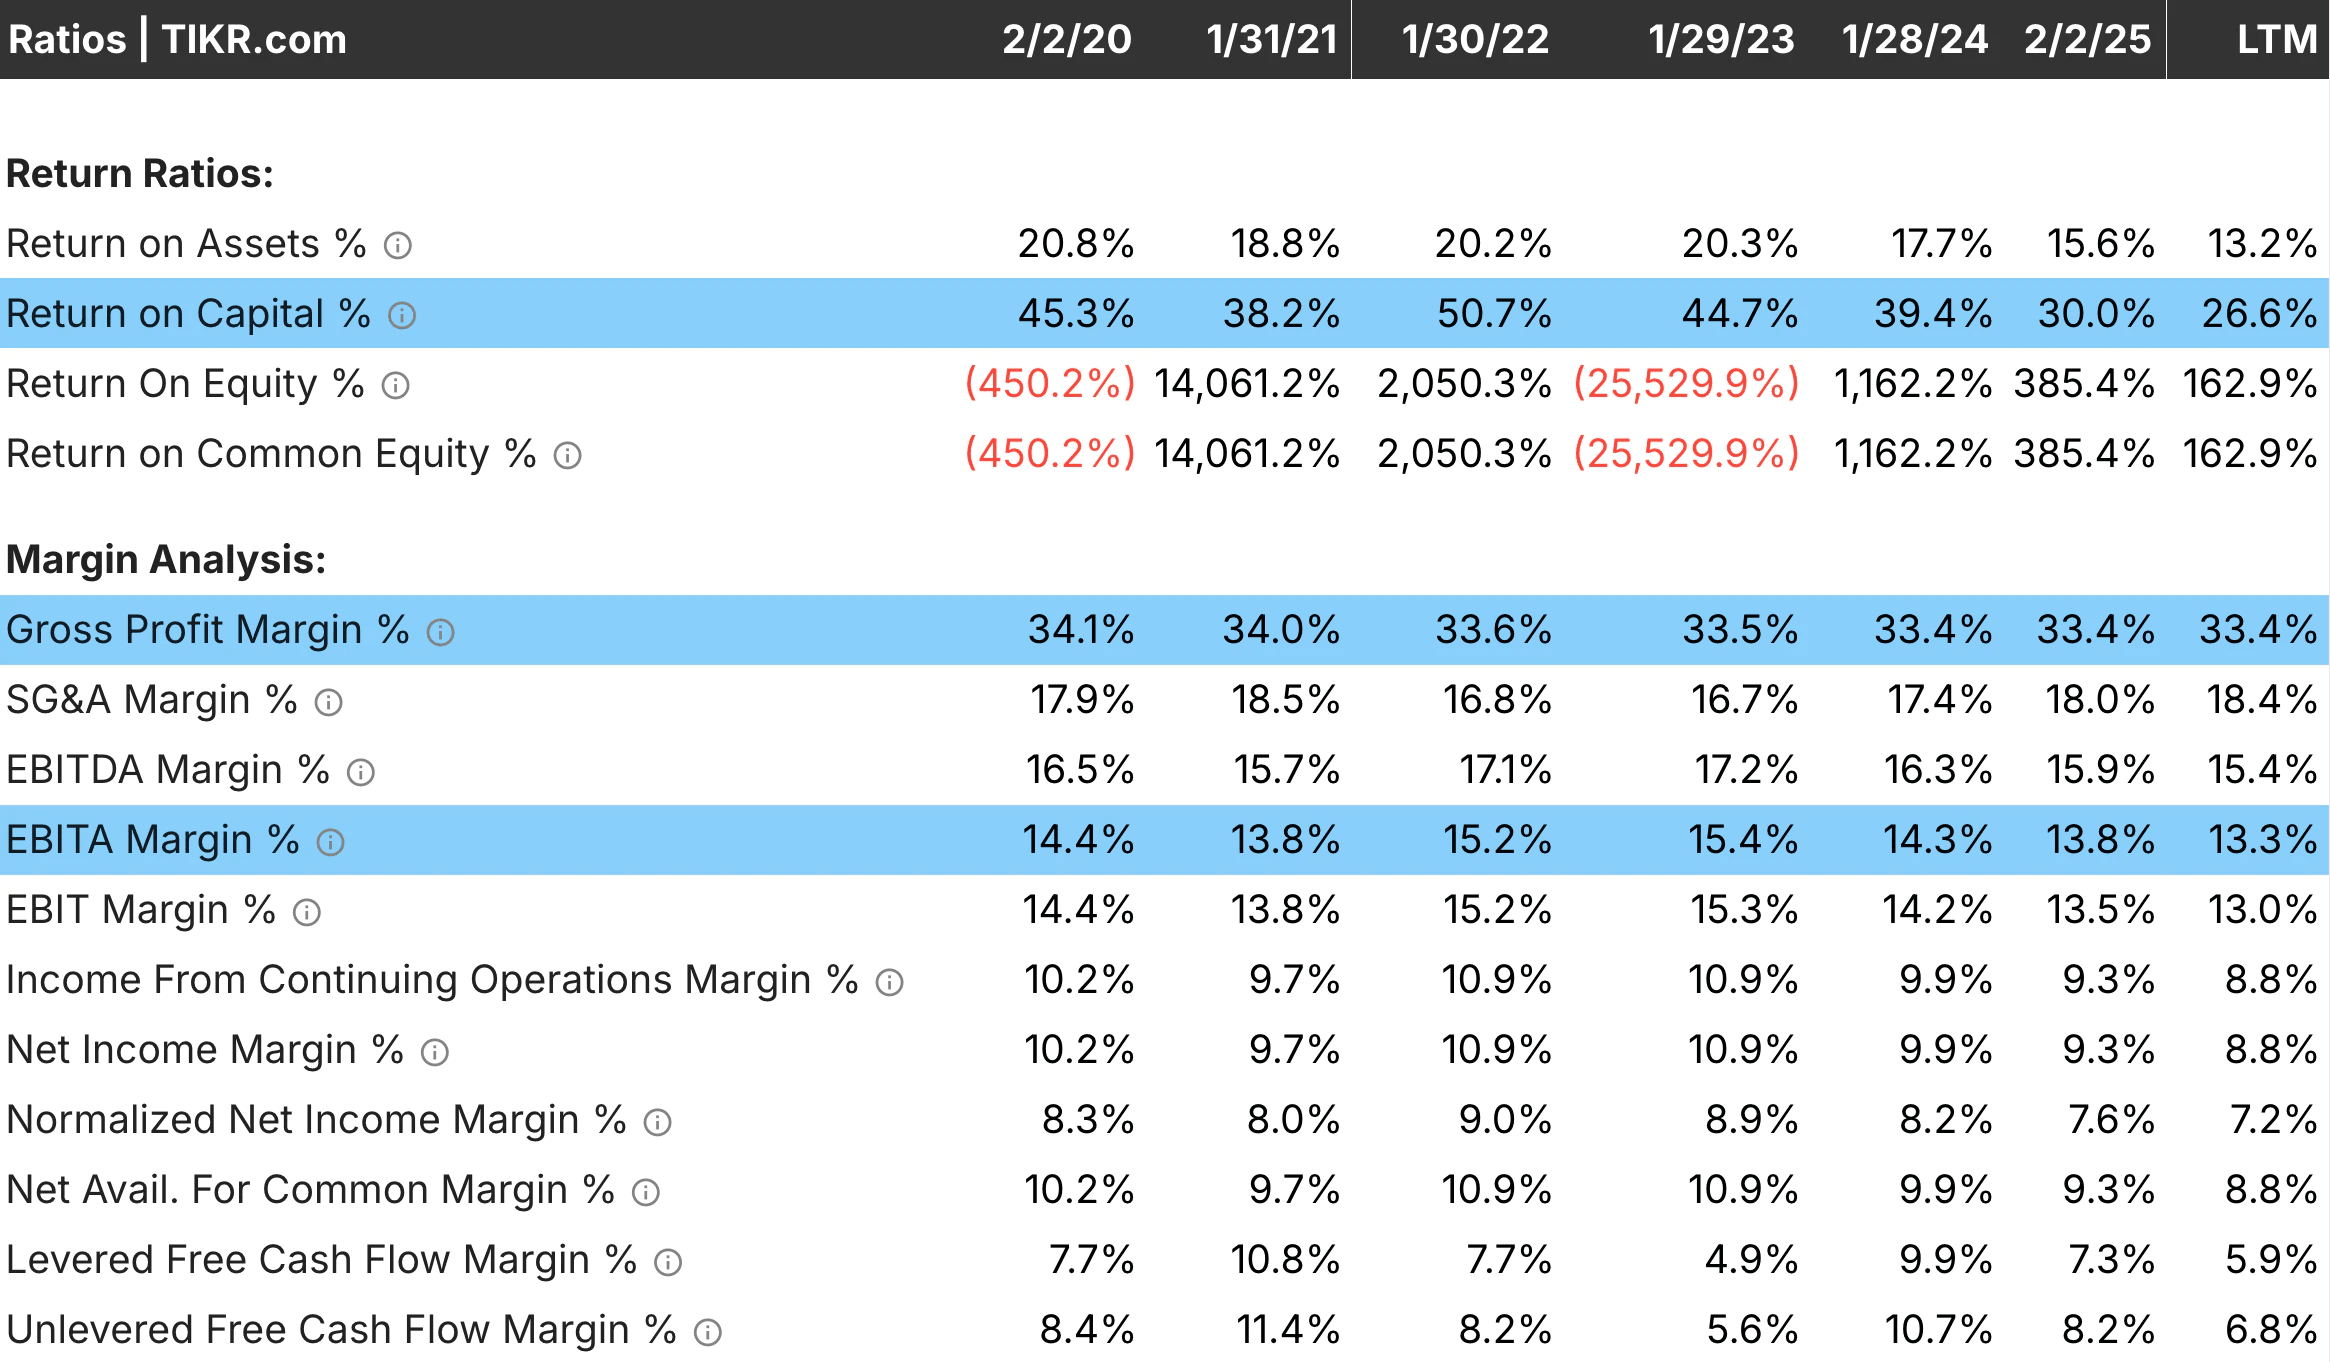
Step 1: Start with Return on Capital (ROC)
Return on capital measures how efficiently a company generates profits from the capital it deploys. It answers a simple question: for every dollar invested in the business, how much operating profit does management produce?
A company earning 20% ROC is generating $0.20 in operating profit for every $1.00 of capital. That is exceptional. A company earning 8% ROC is barely covering its cost of capital and creating little excess value.
What to look for:
- ROC consistently above 15% suggests a durable competitive advantage
- ROC that remains stable or rises over time indicates the moat is holding
- ROC that declines steadily may signal increasing competition or a weakening position
The keyword is consistency. A single year of high ROC can be a fluke. Five or ten years of high ROC points to something structural.
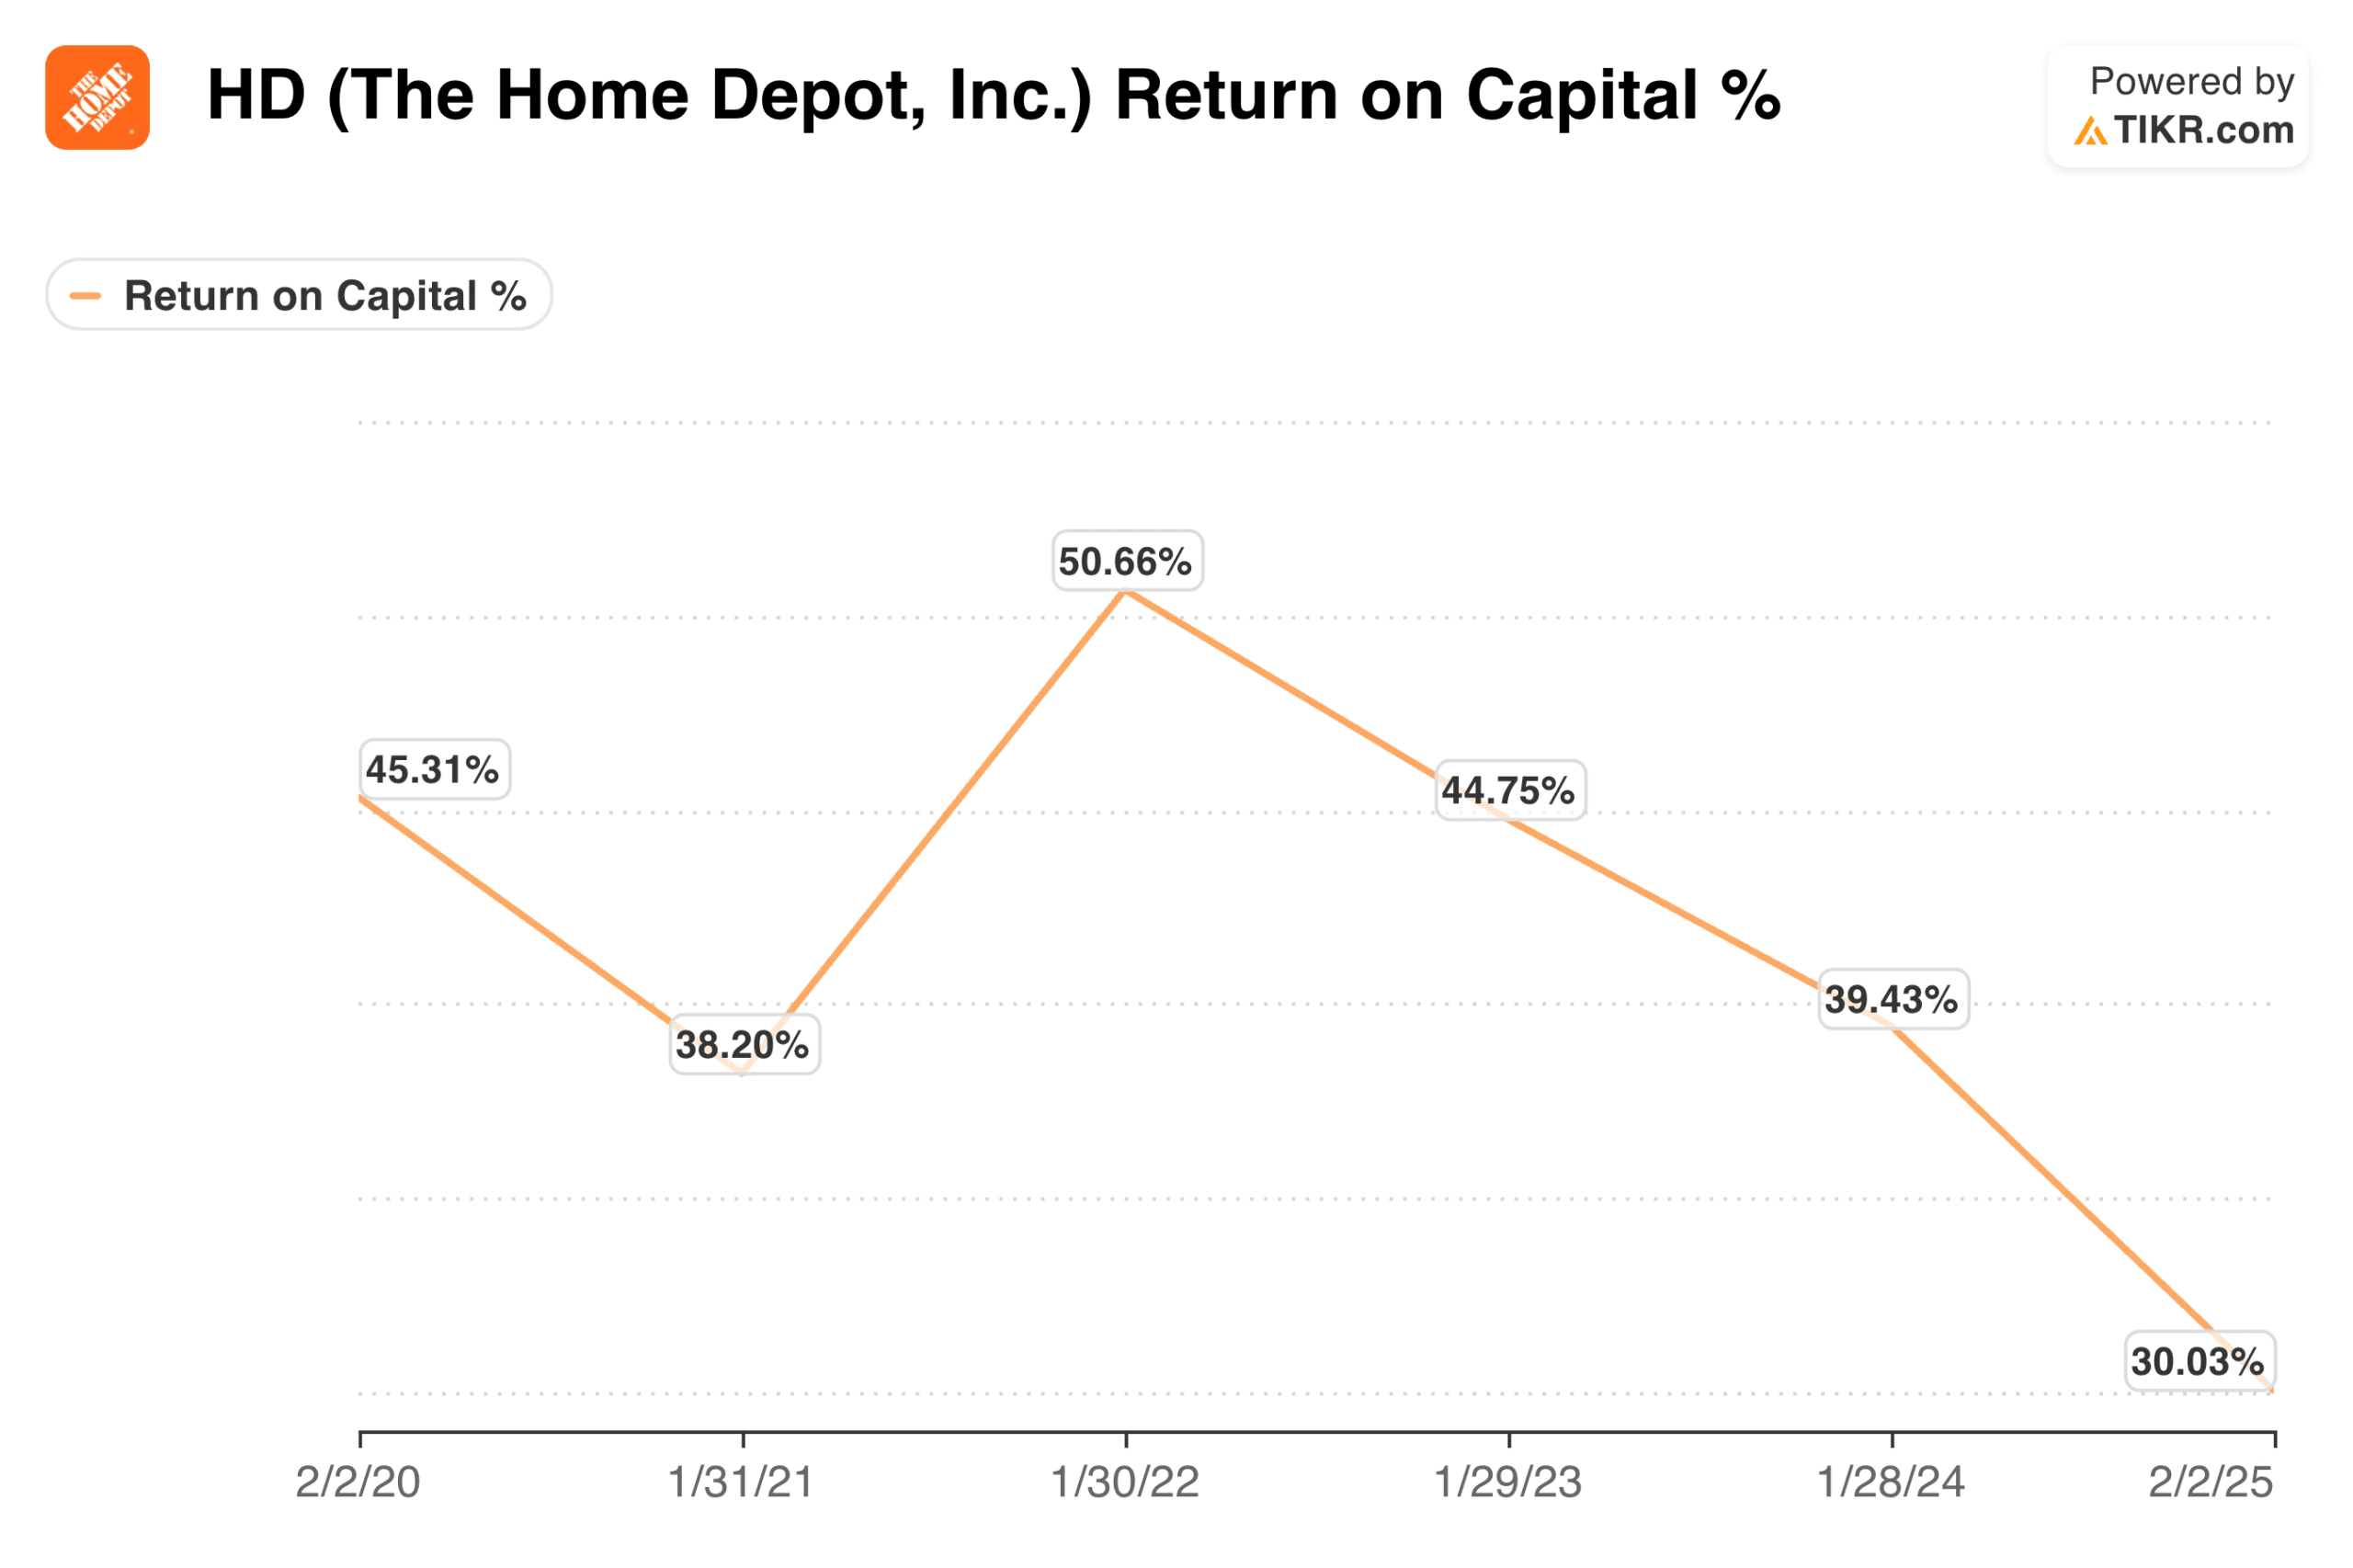
TIKR tip: In TIKR, navigate to Detailed Financials, then Ratios to view ROC over multiple years. Compare the company’s ROC to its industry peers using the Competitors tab to see whether the advantage is company-specific or sector-wide.
Step 2: Examine Gross Margin Stability
Gross margin reflects pricing power. It shows the profit remaining after direct costs, before operating expenses. Companies with strong moats can maintain or expand gross margins because customers are willing to pay premium prices or because production costs are structurally lower than competitors’.
A business with a 60% gross margin has significant room to absorb cost increases, invest in growth, or return cash to shareholders. A business with a 20% gross margin has much less flexibility.
What to look for:
- Gross margins that remain stable across economic cycles
- Gross margins above industry averages
- Gradual expansion in gross margin over time, which may indicate strengthening pricing power
Declining gross margins often signal commoditization. When a company must cut prices to compete, its moat is eroding.
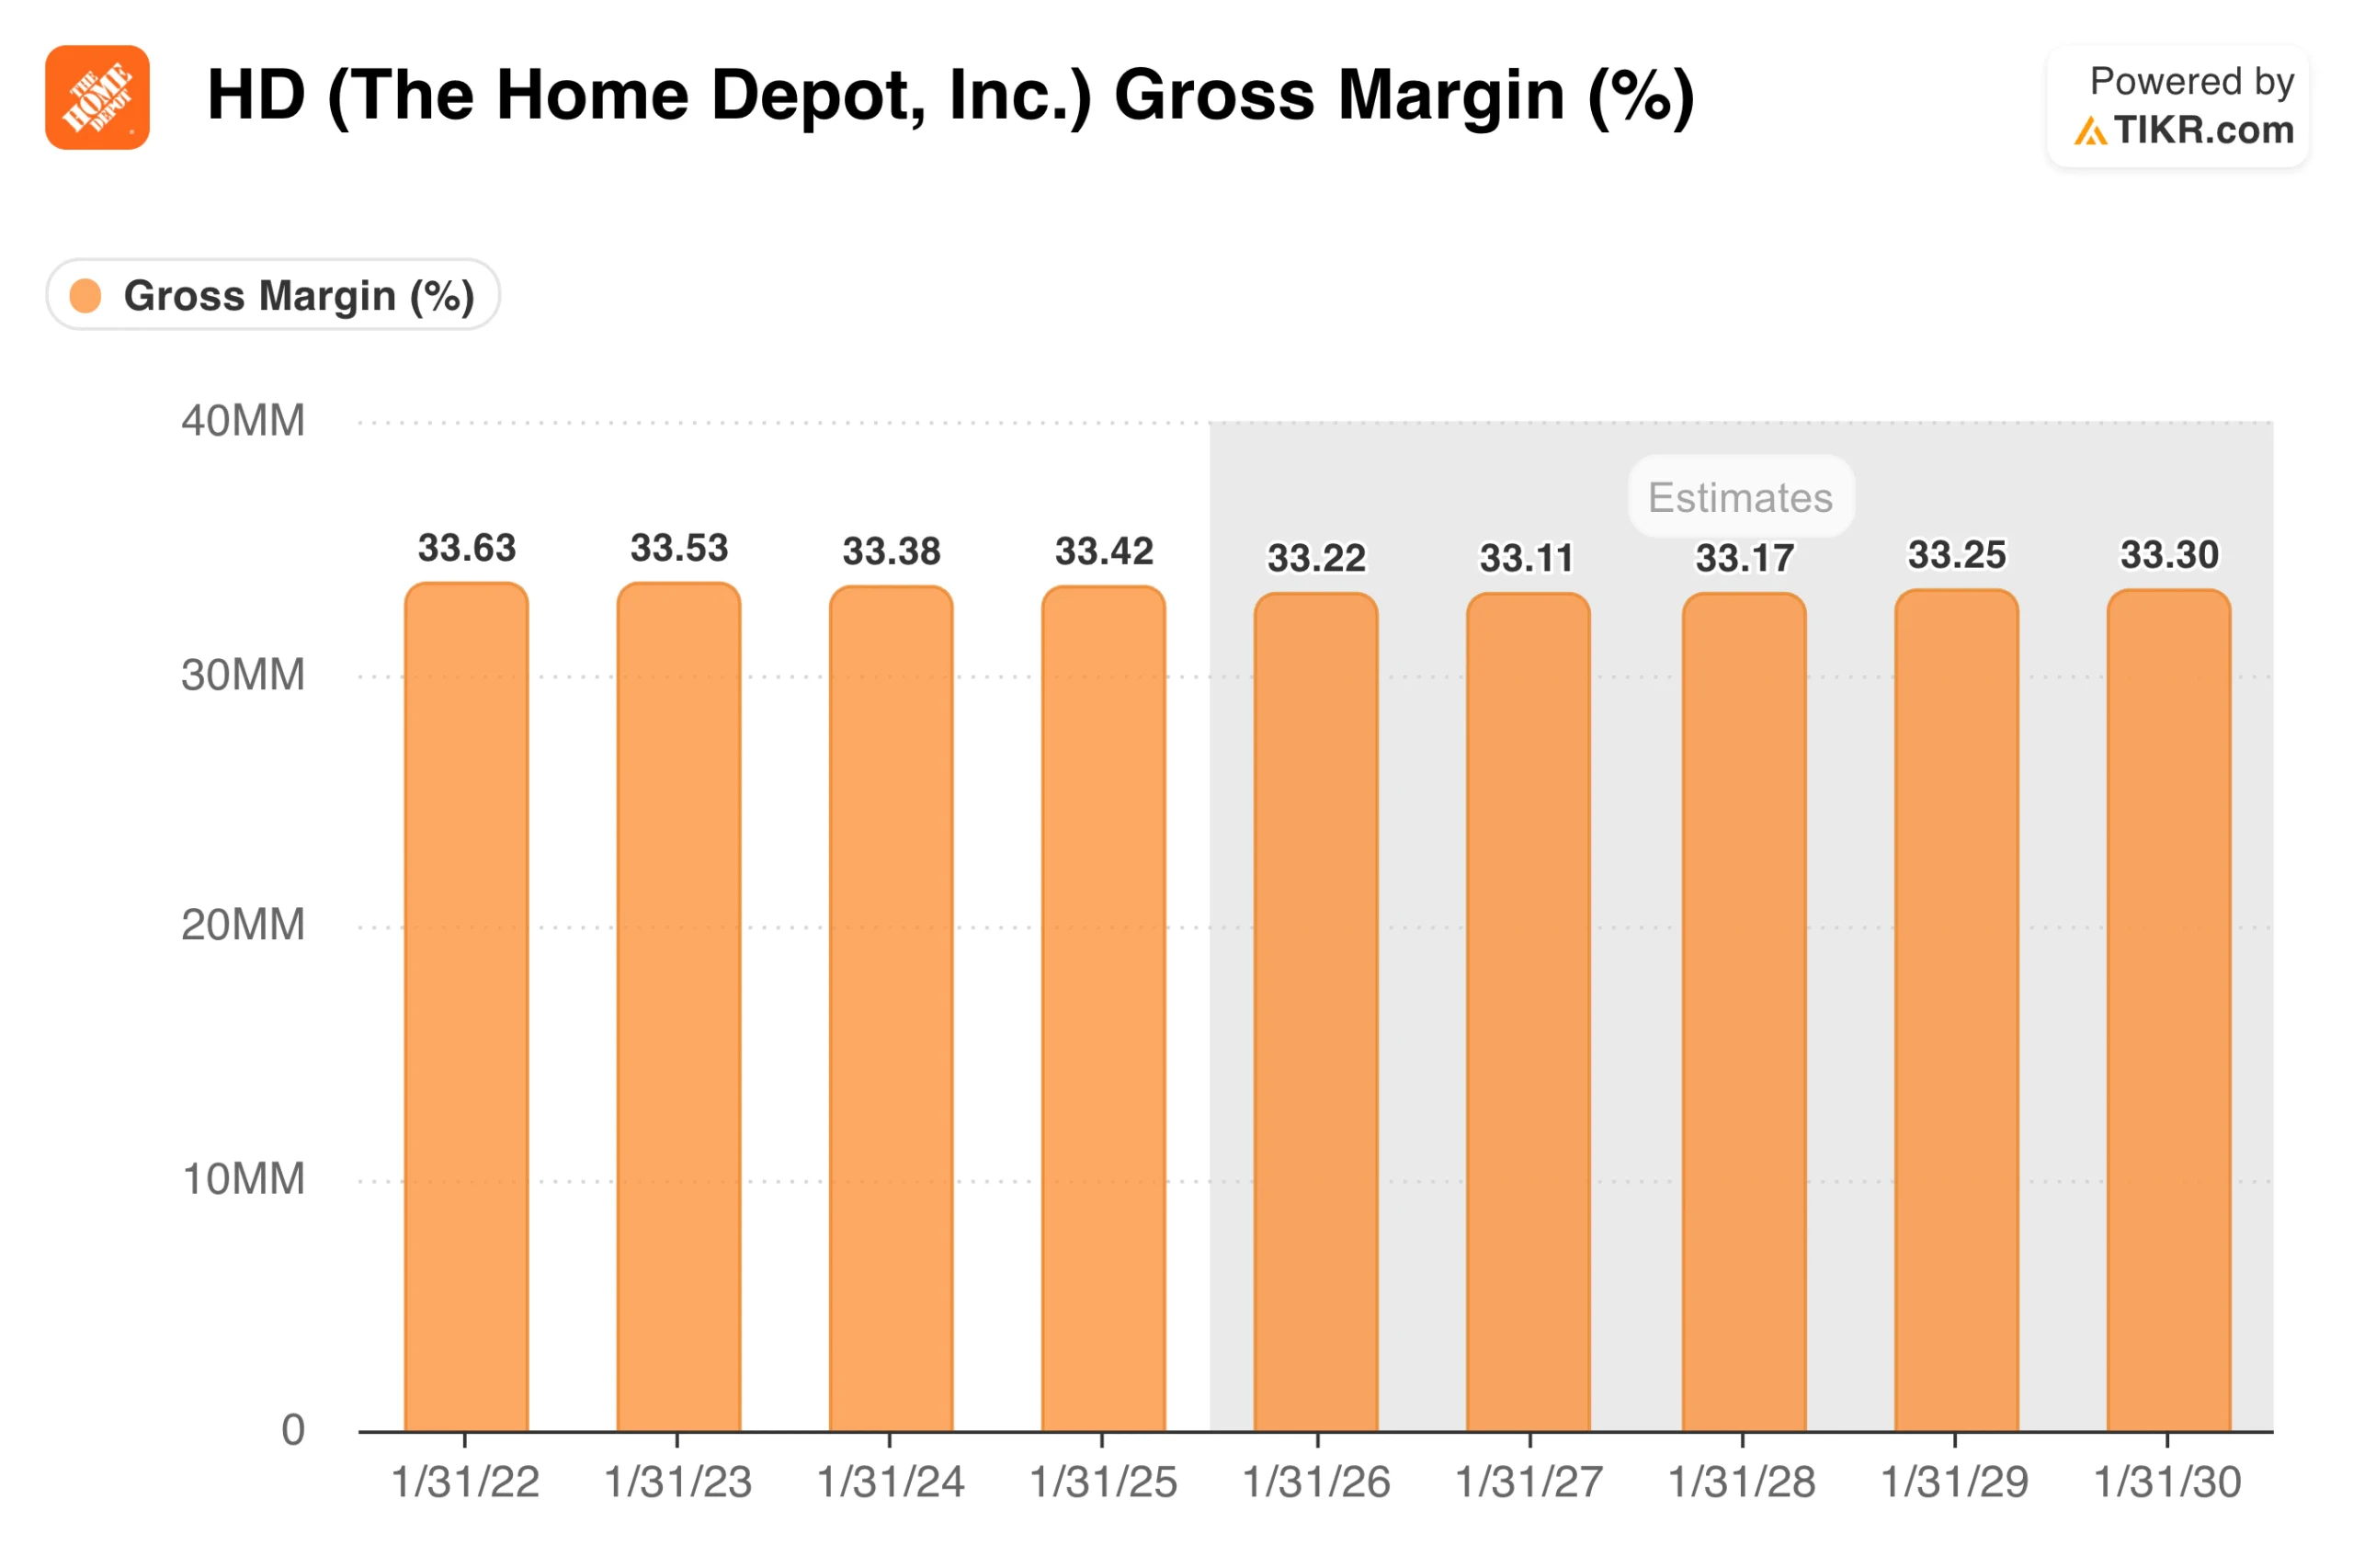
TIKR tip: Use TIKR’s Estimates tab to view historical gross margins alongside analyst forecasts. If analysts expect margins to hold steady or improve, that supports the moat thesis.
Step 3: Analyze Operating Margin Trends
Operating margin builds on gross margin by including selling, general, and administrative expenses. It shows how efficiently management runs the entire business, not just production.
High operating margins indicate a company can convert revenue into profit without excessive overhead. This often reflects scale advantages, efficient operations, or premium positioning that justifies lean cost structures.
What to look for:
- Operating margins consistently above peers
- Operating leverage, where margins expand as revenue grows
- Stability through downturns, which shows the business model holds up under pressure
A company with 25% operating margins has a very different economic profile than one with 8% margins, even if both grow revenue at the same rate.
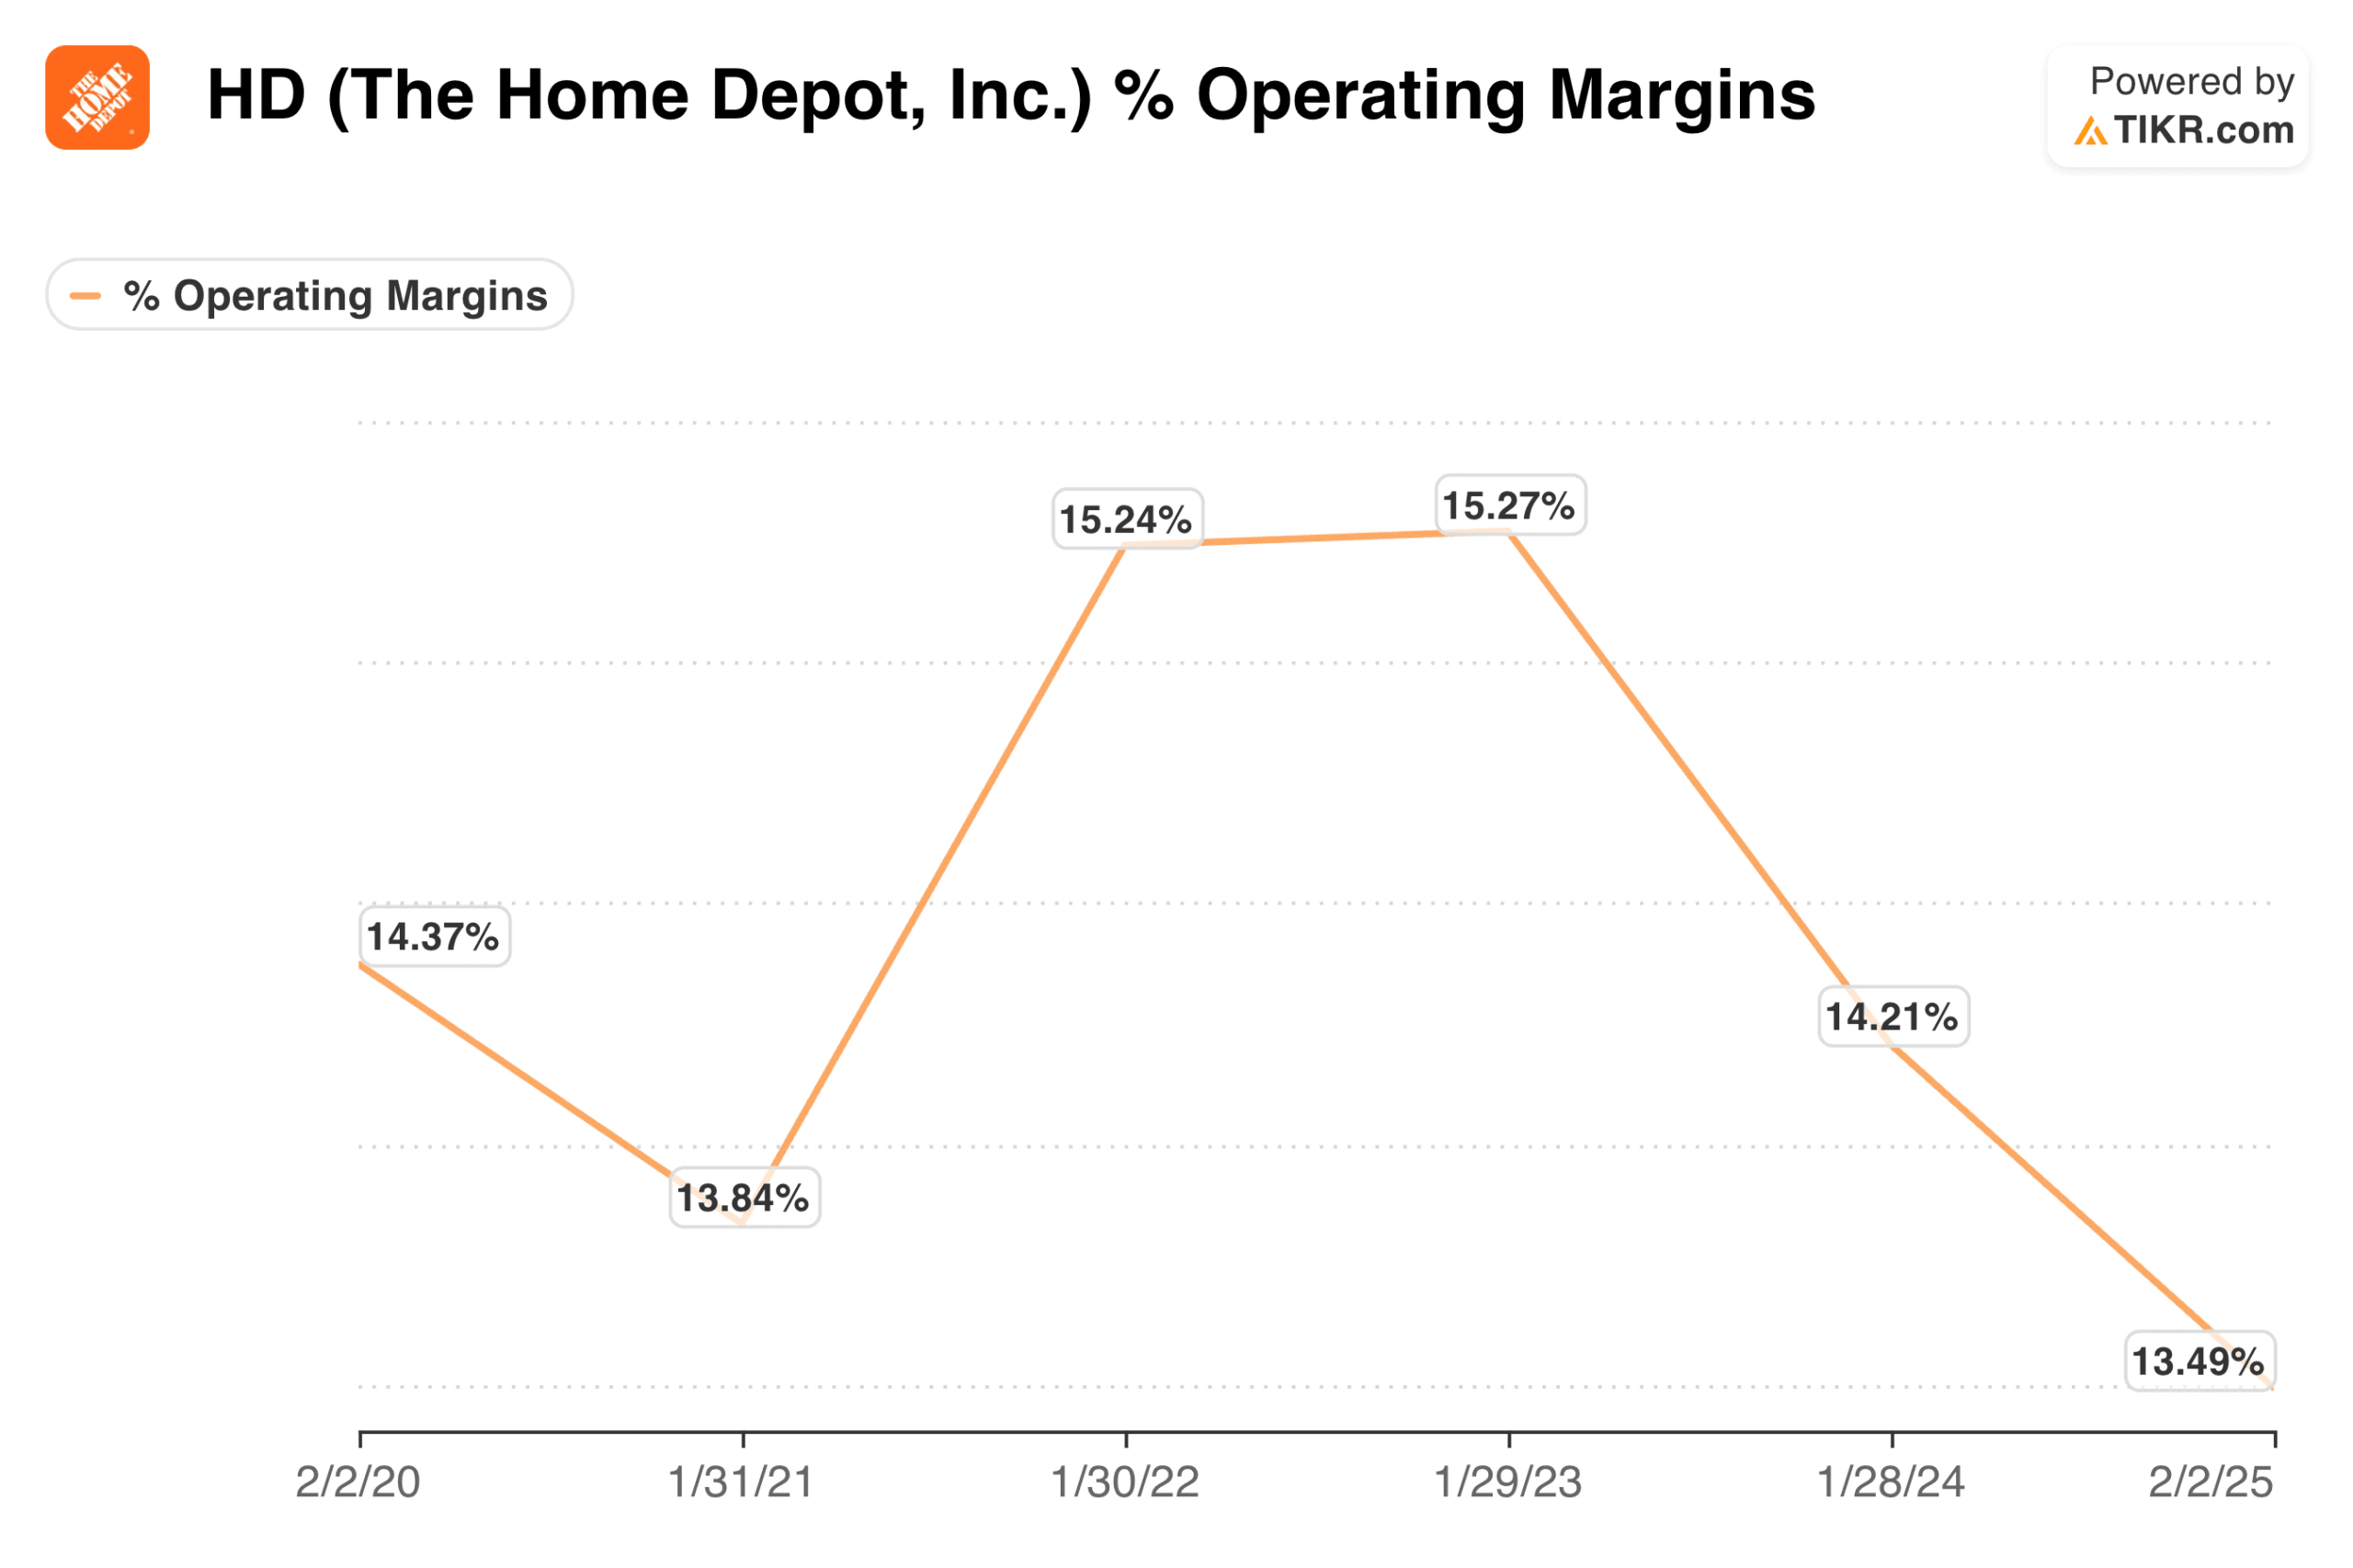
TIKR tip: Use TIKR’s Financials tab to view operating margin trends over multiple years for any company you are researching. To compare against competitors, check each peer’s operating margin individually and note which businesses consistently convert more revenue into operating profit.
Step 4: Check Free Cash Flow Conversion
Earnings can be manipulated through accounting choices. Cash flow is harder to fake. Free cash flow measures the cash a business generates after capital expenditures and is what ultimately funds dividends, buybacks, debt reduction, and reinvestment.
A company with a moat typically converts a high percentage of its net income into free cash flow. This indicates that reported profits are real and that the business does not require excessive reinvestment just to maintain its position.
What to look for:
- Free cash flow that tracks or exceeds net income over time
- Positive free cash flow in most years, including downturns
- Free cash flow margins that remain stable or improve
Businesses that consistently generate more free cash flow than net income often have capital-light models, which can be a sign of competitive strength.

TIKR tip: TIKR’s Cash Flow Statement shows free cash flow alongside operating cash flow and capital expenditures. Review the trend over multiple years to confirm the business generates real cash, not just accounting profits.
Step 5: Evaluate Return on Equity (ROE) with Context
ROE measures how much profit a company generates relative to shareholder equity. High ROE can indicate a strong moat, but it requires context because leverage distorts the ratio.
A company can boost ROE by taking on debt. That is not a sign of competitive strength. The goal is to find companies with high ROE driven by operational excellence, not financial engineering.
What to look for:
- ROE above 15% sustained over many years
- ROE that remains high even with modest leverage
- Consistency in ROE through different market environments
Comparing ROE to ROC helps isolate the impact of leverage. If the ROC is high and the debt is low, a high ROE reflects genuine business quality.
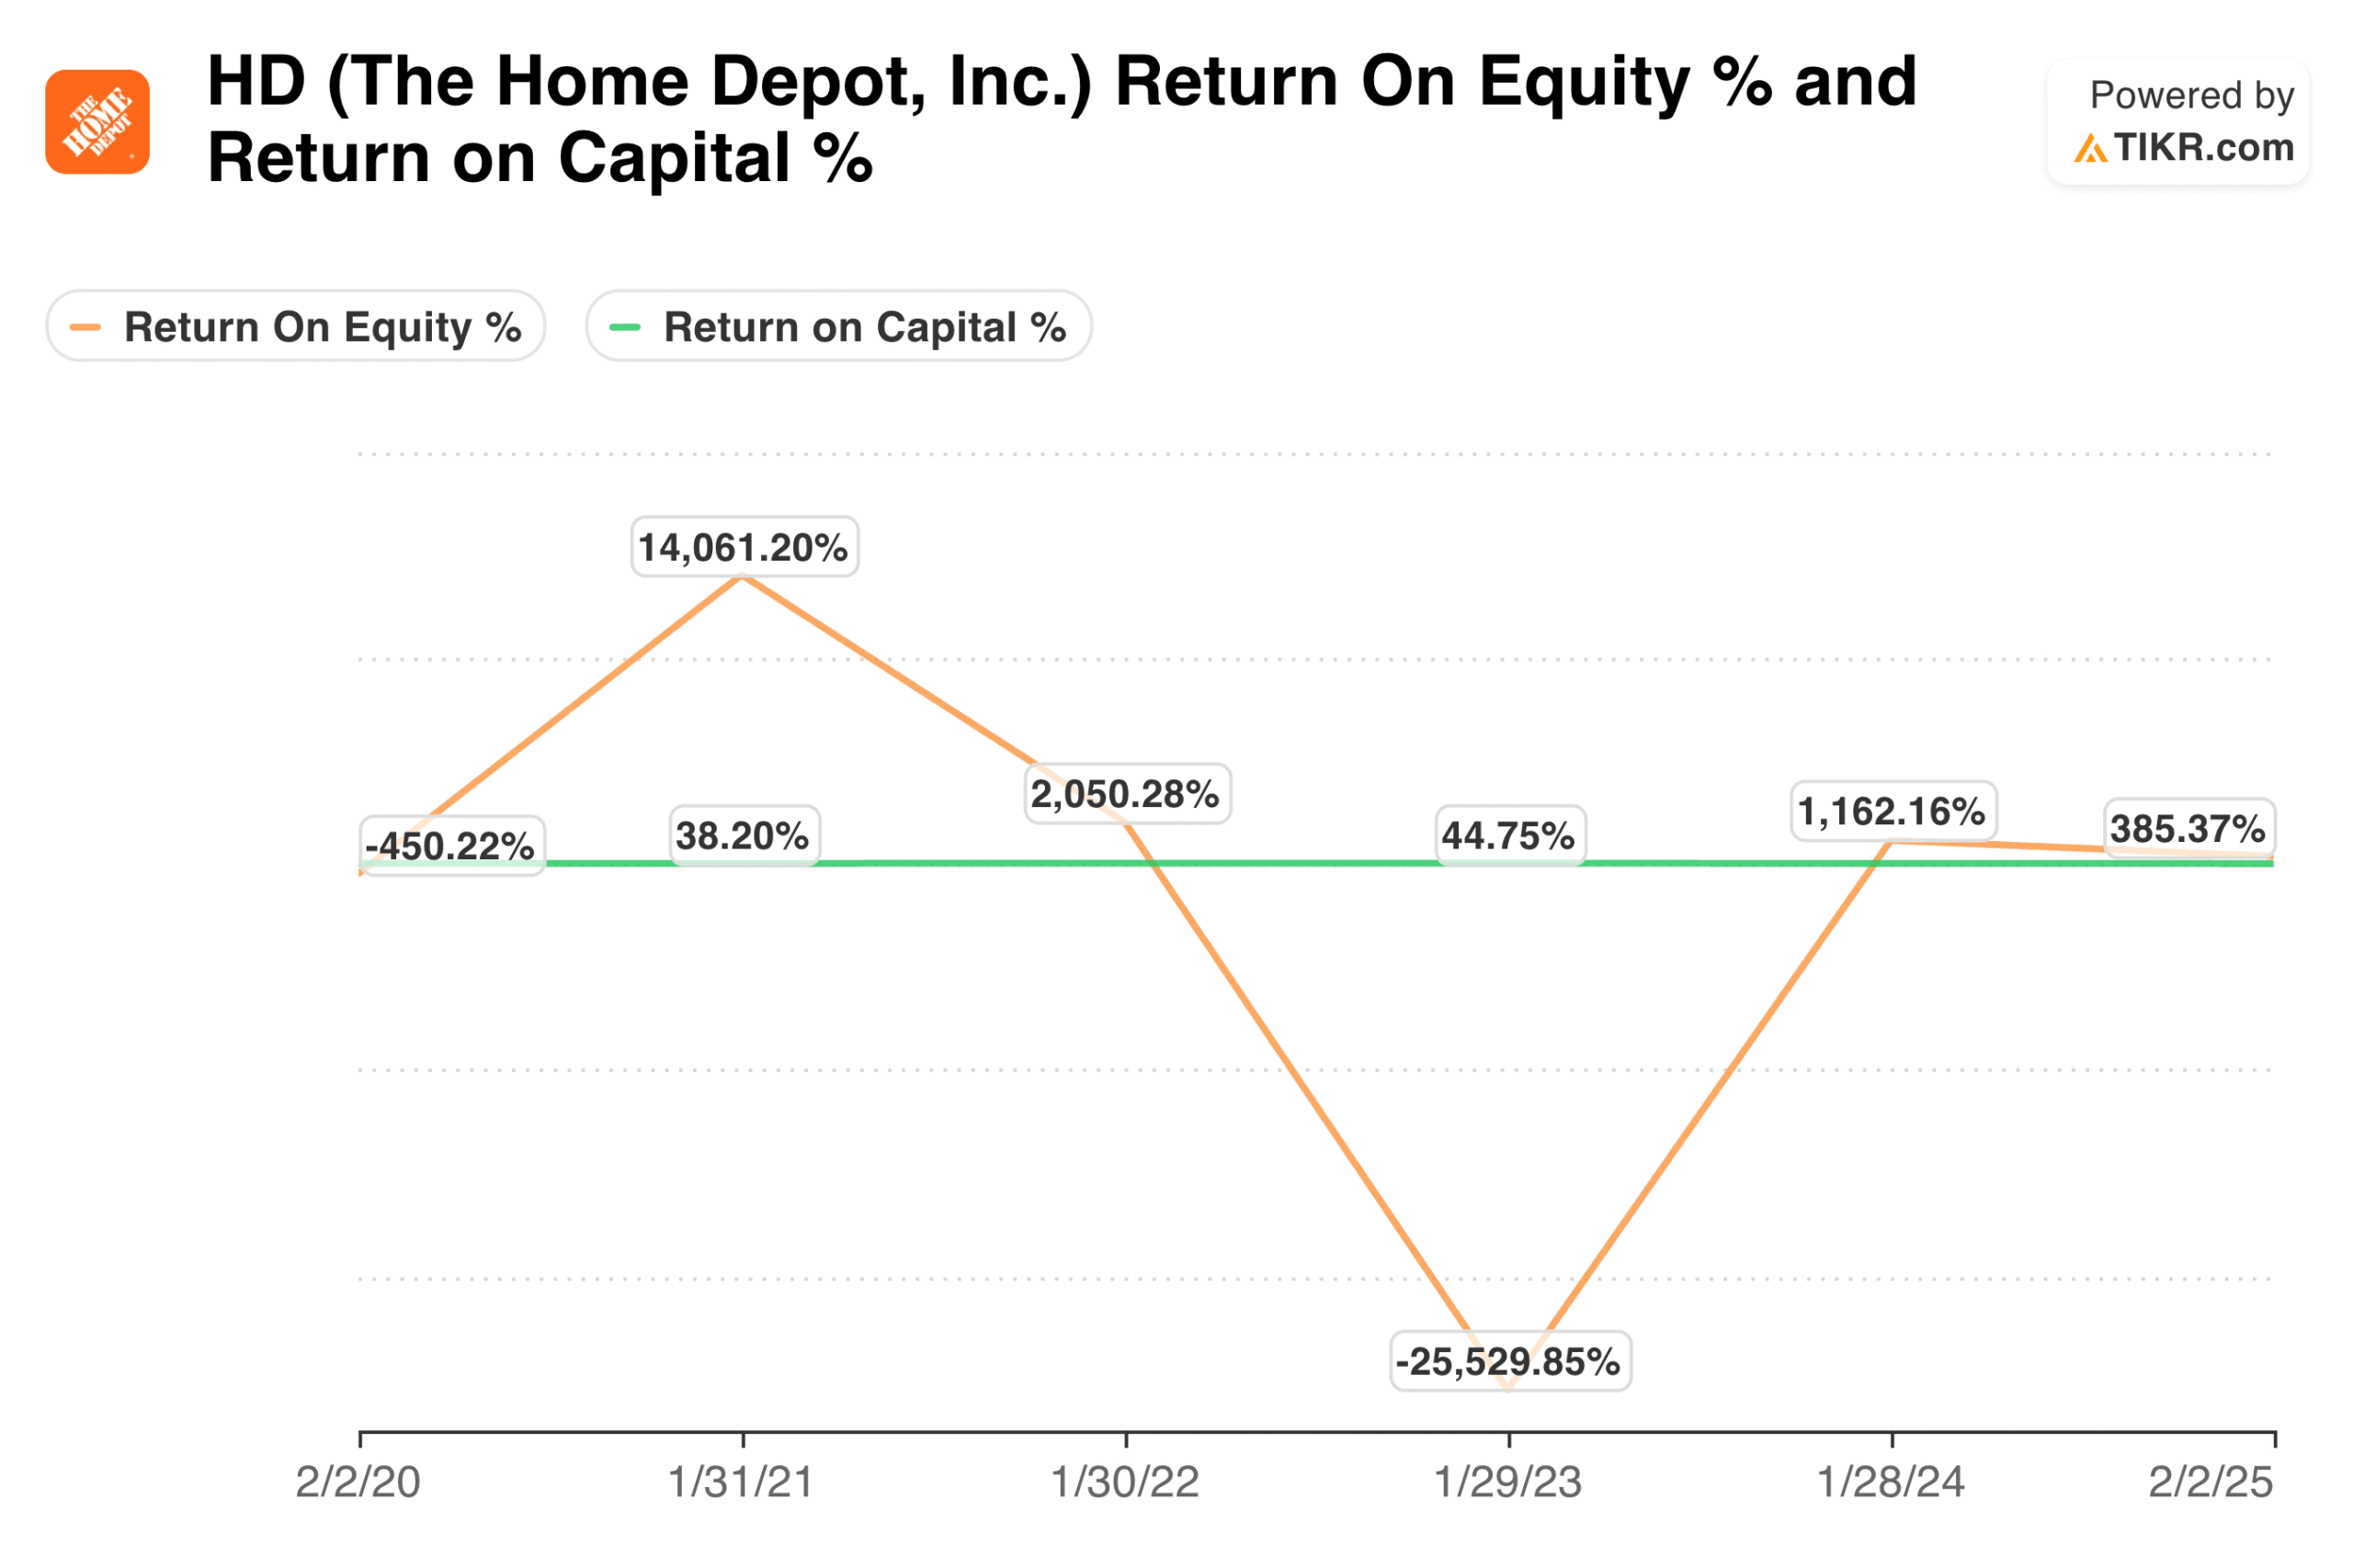
TIKR tip: Use TIKR’s Ratios tab to view both ROE and ROC side by side. Also, check the debt-to-equity ratio to understand how much leverage contributes to returns.
Step 6: Assess Revenue Stability and Growth
Moats often manifest as predictable, recurring revenue. Companies with switching costs or subscription models tend to show steady revenue growth with low volatility. Companies in commodity businesses often show choppy, cyclical revenue patterns.
Revenue growth matters, but so does the quality of that growth. Organic growth from existing customers and new market share is more valuable than growth from acquisitions, which can mask underlying weakness.
What to look for:
- Revenue that grows steadily without sharp declines
- Consistent organic growth rates over five to ten years
- Revenue concentration, as too much dependence on a few customers, can weaken the moat
A company that grows revenue by 8% annually for a decade is often more attractive than one that grows by 20% in boom years and contracts by 15% in downturns.
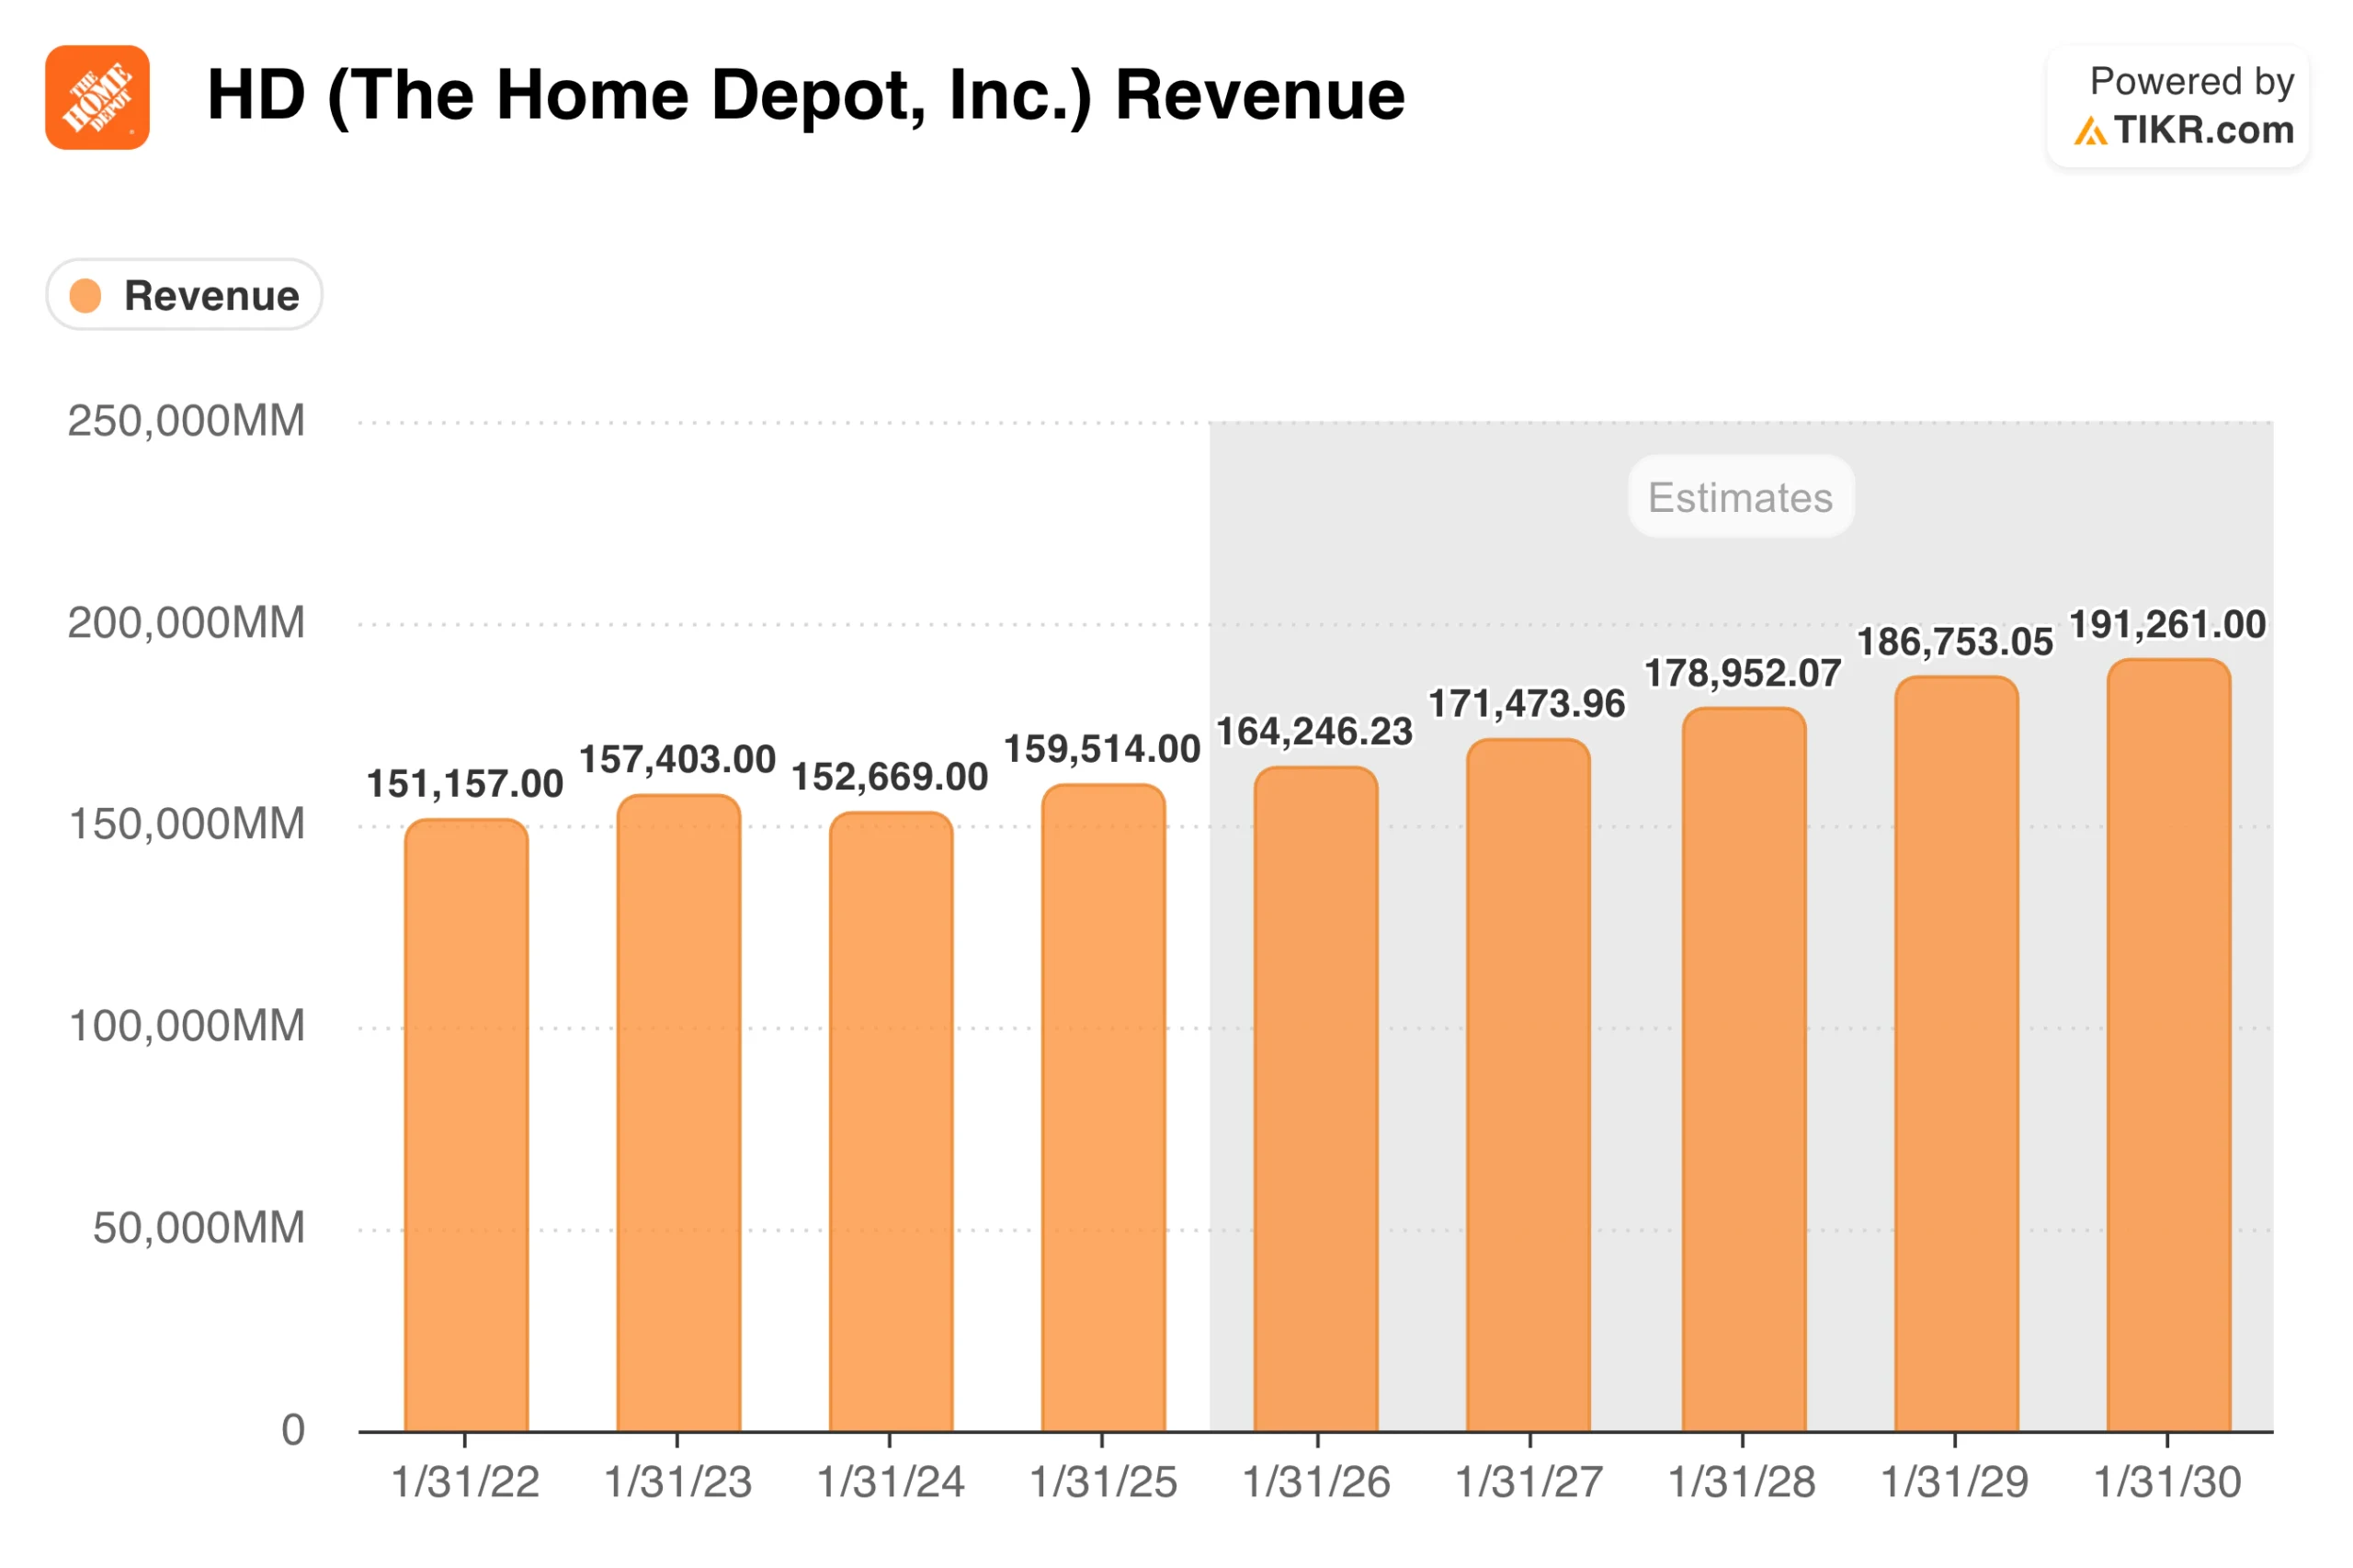
TIKR tip: TIKR’s Estimates tab shows historical revenue alongside analyst forecasts. Look for companies with steady growth trajectories and analysts who expect that consistency to continue.
Step 7: Compare Against Peers
No ratio means much in isolation. A 12% ROIC might be excellent in one industry and mediocre in another. The real signal comes from comparing a company’s ratios to its closest competitors over time.
If one company in an industry consistently earns higher returns, maintains better margins, and generates more free cash flow than its peers, that outperformance points to a competitive advantage. If the entire industry earns similar returns, no individual company likely has a moat.
What to look for:
- Persistent outperformance relative to peers across multiple metrics
- Gaps that widen over time rather than narrow
- Advantages that hold up through different economic conditions
Peer comparison turns raw numbers into actionable insight.
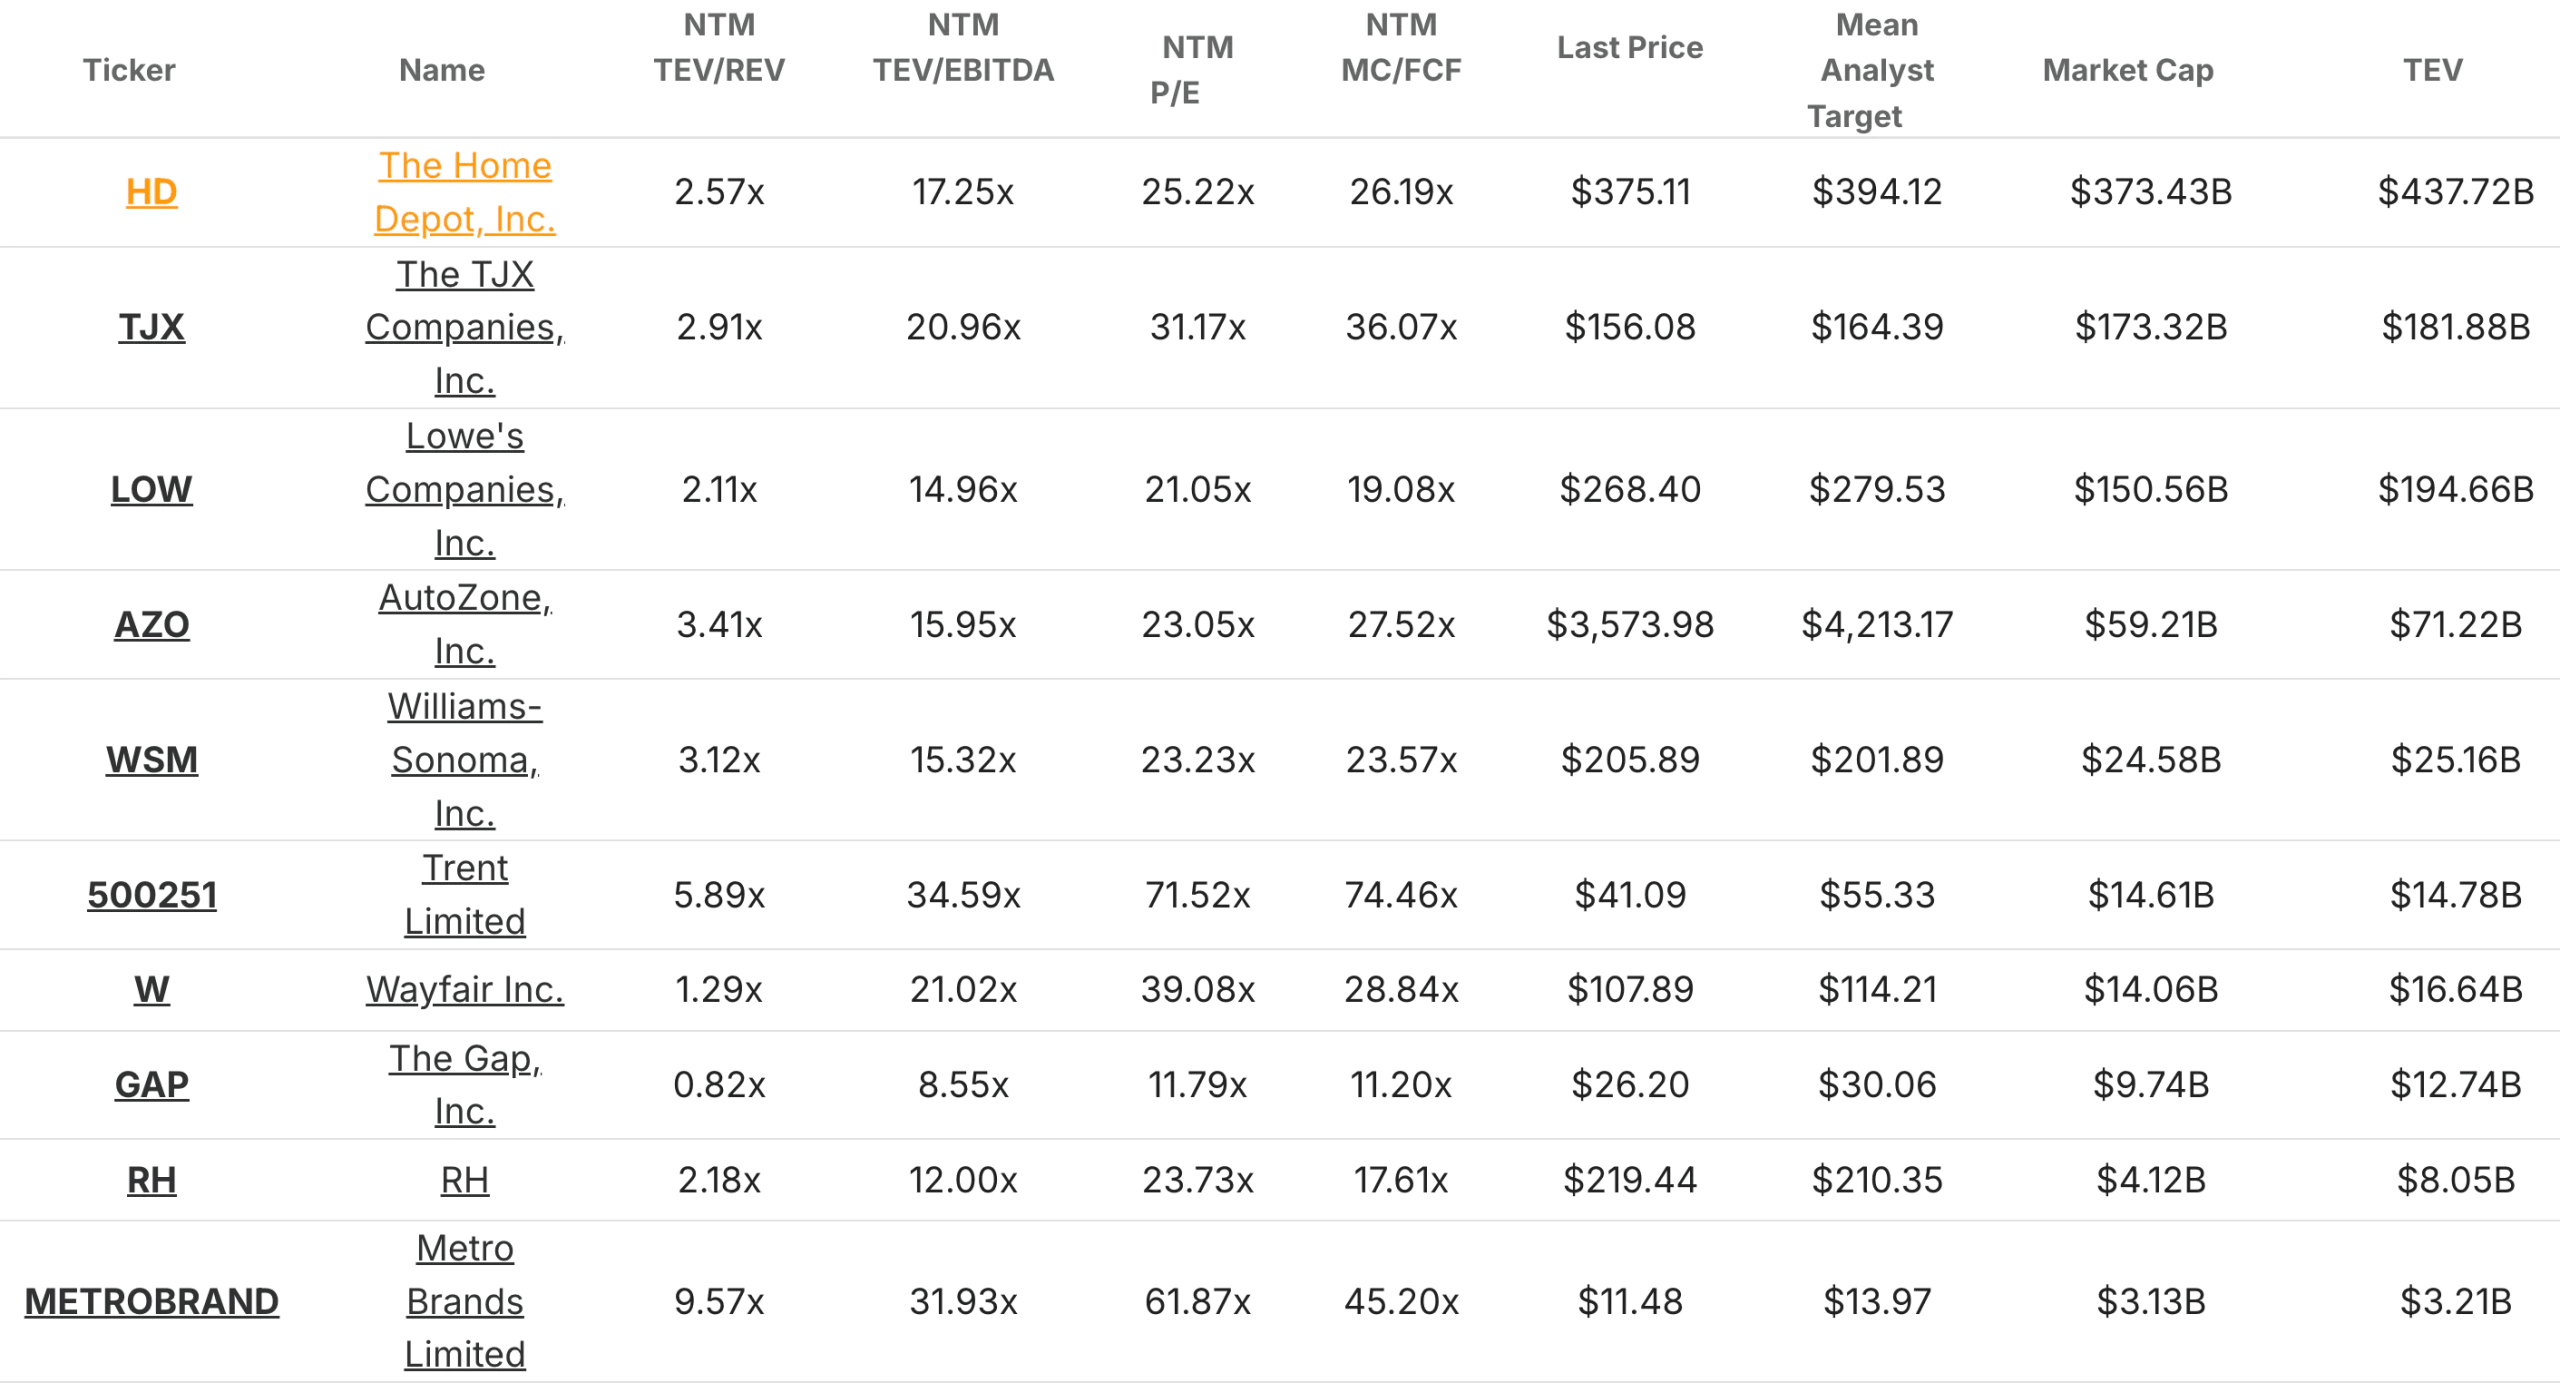
TIKR tip: TIKR’s Competitors tab automatically groups companies by sector and displays key ratios side-by-side. Use this to quickly identify which businesses stand out and which are merely average.
Putting It All Together
Moat analysis is not about finding a single perfect ratio. It is about building a picture from multiple data points that reinforce each other.
A company with 20% ROIC, 40% gross margins, stable operating margins, strong free cash flow conversion, and consistent outperformance versus peers is showing clear signs of a durable moat. A company with declining ROIC, compressing margins, and erratic cash flow is showing signs of competitive pressure.
The financial ratios do not explain why the moat exists. That requires understanding the business model, customer relationships, and industry dynamics. But the ratios confirm whether the moat is real and whether it is strengthening or weakening over time.
A Quick Checklist for Moat Analysis
Use this framework when evaluating any company:
- Is ROIC consistently above 15%?
- Are gross and operating margins stable or improving?
- Does free cash flow track or exceed net income?
- Is ROE high without excessive leverage?
- Is revenue growth steady and organic?
- Does the company outperform peers across these metrics?
If most answers are yes, the company likely has a moat worth delving into further.
TIKR Takeaway
A company’s moat determines its ability to compound value over time. The financial ratios reveal whether that moat exists and how durable it might be. ROIC shows capital efficiency. Margins show pricing power and cost discipline. Free cash flow confirms that profits are real. Peer comparisons put everything in context.
TIKR makes this analysis straightforward by bringing together historical financials, ratios, estimates, and peer data into a single platform. Instead of pulling numbers from multiple sources, you can evaluate moat strength in minutes and focus your time on the companies that deserve deeper research.
The best long-term investments are businesses with durable competitive advantages. The ratios help you find them.
Track company financials, stock value, and competitor information with TIKR (It’s free) >>>
How to Accurately Value a Stock in Under 30 Seconds
All it takes to value a stock with TIKR is three simple inputs:
- Revenue Growth
- Operating Margins
- Exit P/E Multiple
If you’re not sure what assumptions to use, TIKR automatically fills in each input using analysts’ consensus estimates, giving you a quick, reliable starting point.
From there, TIKR calculates the potential share price and total returns under Bull, Base, and Bear scenarios so you can quickly see whether a stock looks undervalued or overvalued.
See a stock’s true value in under 60 seconds (Free with TIKR) >>>
Looking for New Opportunities?
- Discover which stocks billionaire investors are purchasing, so you can follow the smart money.
- Analyze stocks in as little as 5 minutes with TIKR’s all-in-one, easy-to-use platform.
- The more rocks you overturn… the more opportunities you’ll uncover. Search 100K+ global stocks, global top investor holdings, and more with TIKR.
Disclaimer:
Please note that the articles on TIKR are not intended to serve as investment or financial advice from TIKR or our content team, nor are they recommendations to buy or sell any stocks. We create our content based on TIKR Terminal’s investment data and analysts’ estimates. Our analysis might not include recent company news or important updates. TIKR has no position in any stocks mentioned. Thank you for reading, and happy investing!