

Key Stats for ABBV Stock
- Past-Week Performance: 2%
- 52-Week Range: $164 to $245
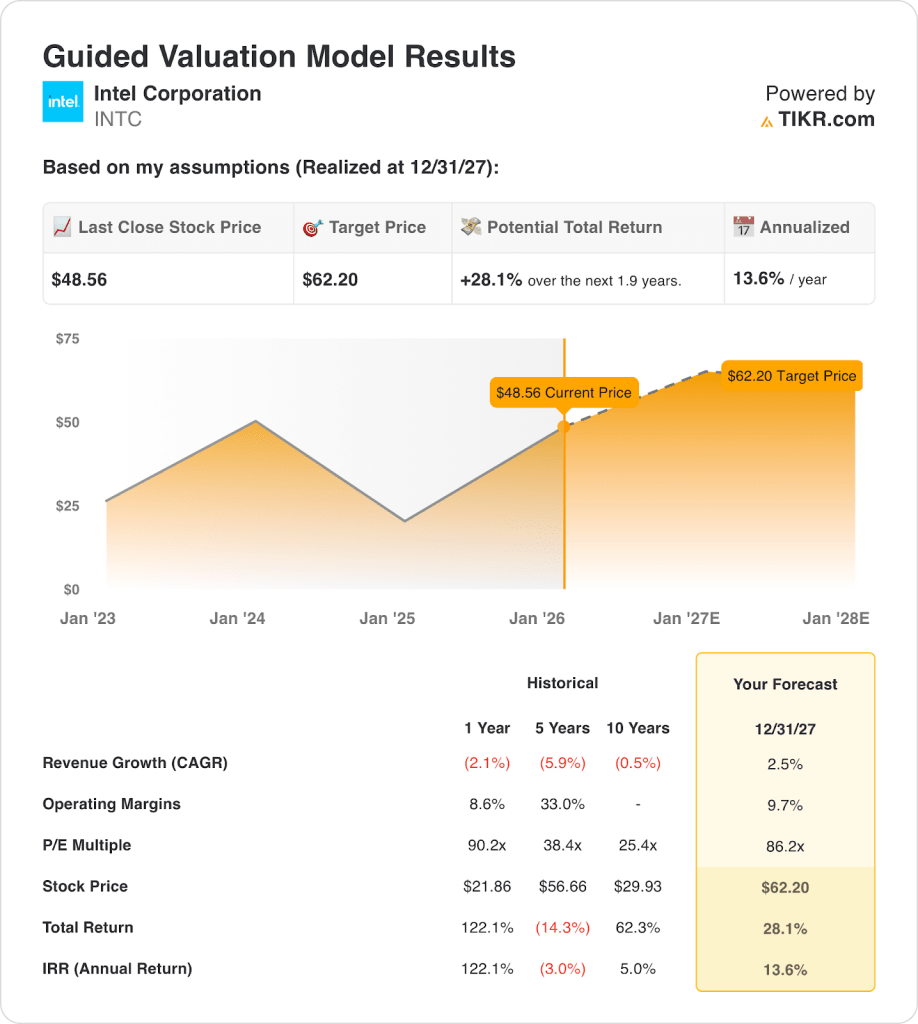
- Valuation Model Target Price: $62
- Implied Upside: 28.1% over 1.9 years
What Happened?
AbbVie stock (ABBV) climbed about 2% over the past week, trading near recent highs after steady performance amid mixed biotech news.
The move followed January 19 reports that partner Genmab’s phase 3 epcoritamab trial failed to meet its primary endpoint in late-stage blood cancer patients.
Investors appeared to view the partner trial setback as limited to Genmab, with AbbVie’s diversified pipeline cushioning broader sentiment impact.
Separately, on January 12, AbbVie announced an exclusive licensing agreement with RemeGen to develop a bispecific antibody, including a $650 million upfront payment.
Market participants continued to focus on potential U.S. drug tariffs, while AbbVie disclosed no manufacturing or pricing actions during the period.
AbbVie reported no changes to guidance, demand trends, or its long-term outlook during the week following these developments.
Is ABBVIE Stock Fairly Valued Right Now?
Under the valuation model shown, the stock is modeled using:
- Revenue Growth: 2.5%
- Operating Margins: 9.7%
- Exit P/E Multiple: 86.2x
Under valuation model assumptions realized through 2027, AbbVie stock is assessed conditionally, with outcomes dependent on execution across growth, margins, and valuation assumptions.
The model assumes 8.6% revenue CAGR, 47.2% operating margins, and a 15.4x exit P/E multiple through the forecast period.
Based on these inputs, the model estimates a $269.67 target price, implying 23.0% total upside, or 11.3% annualized returns.
Execution depends on portfolio diversification beyond Humira, pipeline progress in oncology and immunology, and sustained margin discipline across branded therapies.
AbbVie stock valuation reflects execution risk rather than optimism, with outcomes dependent on pipeline delivery and stable demand trends over time.
Value Any Stock in Under 60 Seconds (It’s Free)
With TIKR’s new Valuation Model tool, you can estimate a stock’s potential share price in under a minute.
All it takes is three simple inputs:
- Revenue Growth
- Operating Margins
- Exit P/E Multiple
From there, TIKR calculates the potential share price and total returns under Bull, Base, and Bear scenarios so you can quickly see whether a stock looks undervalued or overvalued.
If you’re not sure what to enter, TIKR automatically fills in each input using analysts’ consensus estimates, giving you a quick, reliable starting point.
See a stock’s true value in under 60 seconds (Free with TIKR) >>>


