
Key Stats for Mastercard Stock
- Past-Week Performance: -2.73%
- 52-Week Range: $466 to $602
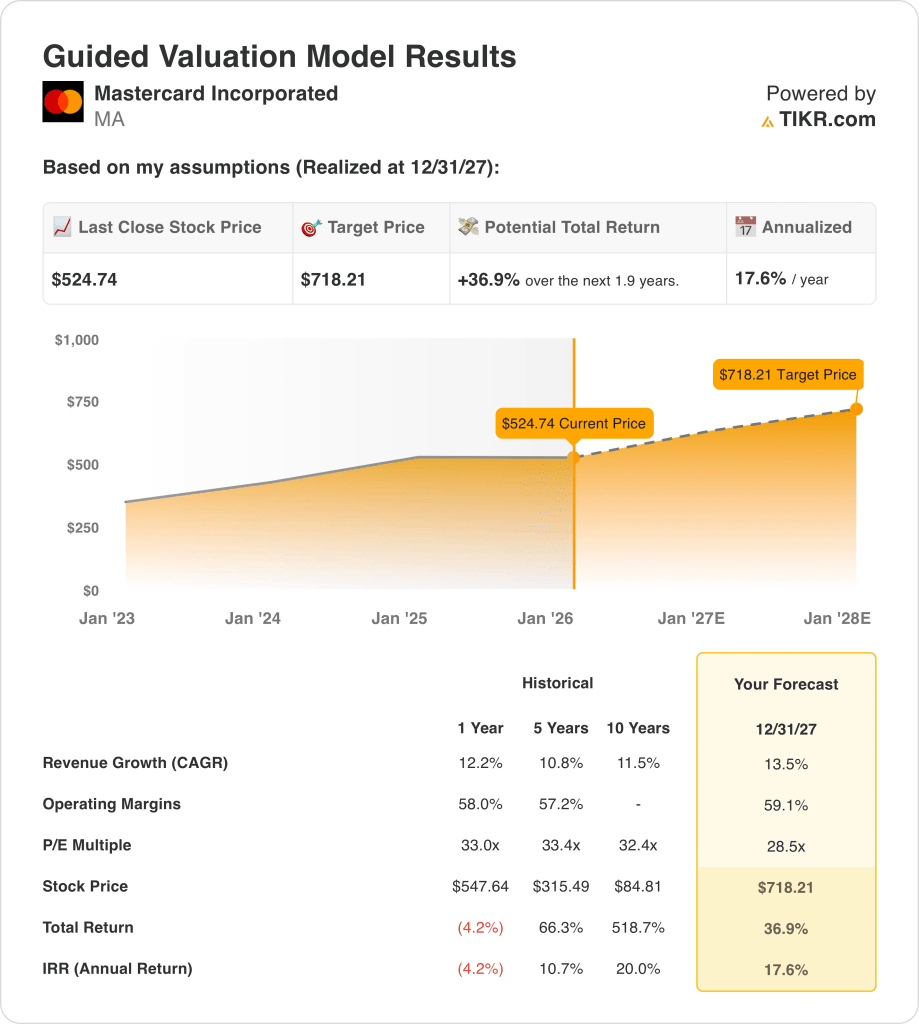
- Valuation Model Target Price: $718
- Implied Upside: 37% over 1.9 years
What Happened?
Mastercard stock (MA) fell about 2.7% over the past week, trading around the low-$520s after recent consolidation near prior highs.
That decline followed renewed political commentary on capping U.S. credit-card interest rates, which framed sentiments and speculations across card-related stocks.
Also, last week, president Trump reiterated calls for a temporary 10% rate cap, though no company-specific actions or implementation details were announced.
Investors appeared to reassess regulatory headline risk, despite Mastercard’s indirect exposure to interest rates as a payment network.
The move occurred without changes to guidance, demand trends, or the company’s long-term outlook.
The pullback appears driven by sentiment and valuation sensitivity, not operational performance.
Is MA Stock Fairly Valued Right Now?
Under the valuation model shown, the stock is modeled using:
- Revenue Growth: %
- Operating Margins: %
- Exit P/E Multiple: x
The valuation model frames Mastercard stock through 2027, with outcomes dependent on execution of the modeled assumptions.
The model assumes 13.5% revenue CAGR, 59.1% operating margins, and a 28.5x exit P/E multiple.
Based on these inputs, the model estimates a $718 target price, implying 36.9% total returns, or 17.6% annually.
Execution depends on sustained payment volume growth, global scale benefits, pricing discipline, and margin leverage across Mastercard’s network.
Mastercard stock valuation reflects execution risk and sensitivity to assumptions, meaning outcomes may vary despite stable underlying business fundamentals.
Value Any Stock in Under 60 Seconds (It’s Free)
With TIKR’s new Valuation Model tool, you can estimate a stock’s potential share price in under a minute.
All it takes is three simple inputs:
- Revenue Growth
- Operating Margins
- Exit P/E Multiple
From there, TIKR calculates the potential share price and total returns under Bull, Base, and Bear scenarios so you can quickly see whether a stock looks undervalued or overvalued.
If you’re not sure what to enter, TIKR automatically fills in each input using analysts’ consensus estimates, giving you a quick, reliable starting point.