Key Takeaways
- ServiceNow consensus revenue growth of 22% in 2026 is more than double Salesforce’s 9.6%, reflecting two fundamentally different positions in the enterprise software cycle.
- TIKR’s valuation model targets a 12.3% IRR for Salesforce stock versus 11.1% for ServiceNow stock, favoring CRM on a risk-adjusted basis.
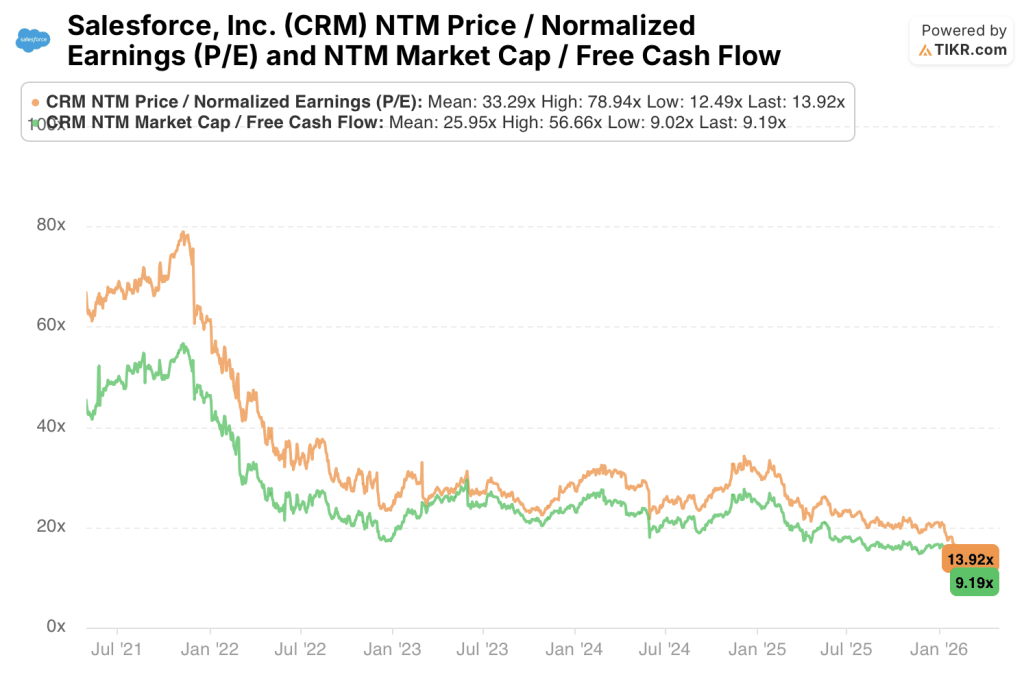
- Salesforce stock trades at 9.19x NTM FCF with a 10.9% FCF yield; ServiceNow stock trades at 21.05x forward P/E, requiring 18%+ revenue growth through 2028 to justify the premium.
- Both companies share near-identical gross margins and FCF conversion rates, making operating leverage trajectory the decisive profitability differentiator.
Key Stats
Salesforce (CRM)
- Current Price: $184
- TIKR Mid-Case Target: $355
- Potential Return: +93% over ~5 years
- IRR (Mid Case): 12%
- NTM P/E: 13.92x
- NTM FCF Yield: 11%
ServiceNow (NOW)
- Current Price: $91
- TIKR Mid-Case Target: $172
- Potential Return: +89% over 5 years
- IRR (Mid Case): 11.1%
- NTM P/E: 21.05x
- NTM FCF Yield: 6.7%
Maturity vs. Momentum: Two Different Stages of the Same Playbook
Salesforce (CRM) built the dominant CRM platform over two decades and has since expanded into analytics (Tableau), integration (MuleSoft), and AI-powered agents through its Agentforce product suite.
The result is a $37.9B revenue business with customers embedded across sales, marketing, service, and commerce workflows.
That breadth is both the company’s greatest strength and its near-term constraint. At this scale, sustaining double-digit growth requires winning new categories rather than simply expanding within existing ones.
Agentforce represents Salesforce’s bet that agentic AI becomes the next layer of enterprise software spend. Early customer adoption data from fiscal 2026 suggests the market is responding.
ServiceNow (NOW) built its business on a narrower but exceptionally sticky problem: IT service management, or the software that tracks, routes, and resolves issues across enterprise technology infrastructure.
That original use case has since expanded into HR workflows, legal operations, procurement, and field service. The company is positioning its Now Platform as the operating system for enterprise workflow automation.
Revenue reached $13.28B in 2025 after growing at 20% or above for each of the last five years.
ServiceNow is still in the middle of its margin expansion arc, with operating margins at 15.1% in 2025 compared to Salesforce’s 20.2%.
The tension between these two companies is one of maturity versus momentum. Salesforce offers a mature FCF machine at a compressed valuation; ServiceNow offers faster revenue growth and an earlier position on the margin expansion curve.
For an investor choosing between them today, the question is whether ServiceNow’s growth premium justifies a valuation that is nearly 50% richer on a forward earnings basis.
Wall Street’s Take: The Comparison
The business case distinction maps directly onto the forward earnings picture.
Salesforce’s scale advantage produces predictable, high-margin cash flows, but consensus growth expectations have compressed accordingly. ServiceNow’s narrower origin and faster TAM expansion into enterprise workflow automation keep the Street projecting growth rates that Salesforce stopped delivering five years ago.
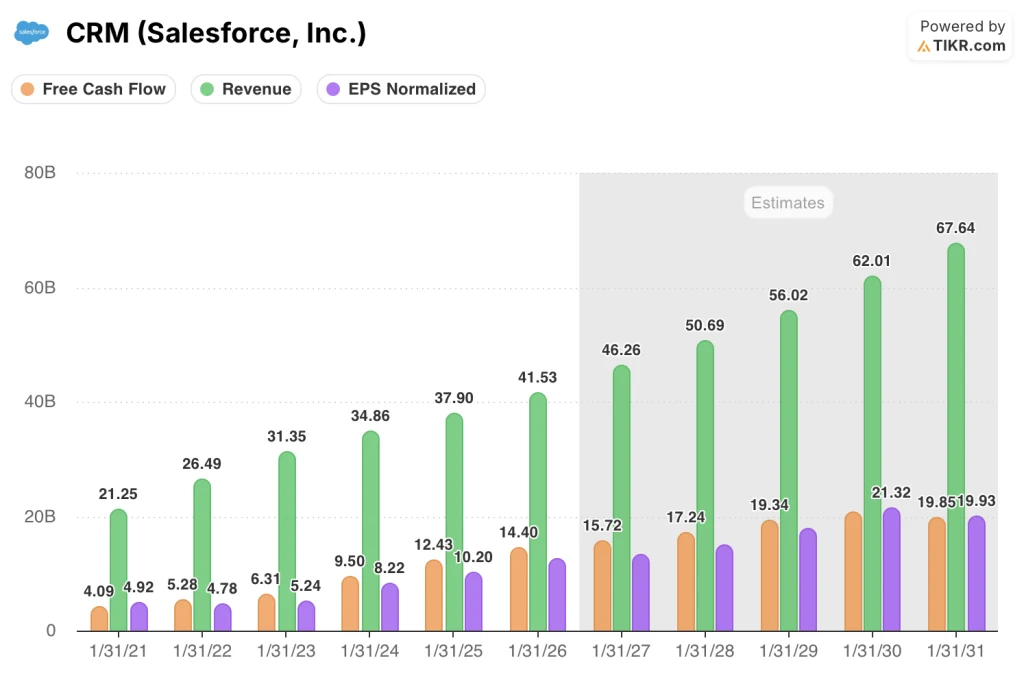
Consensus places Salesforce revenue at $46.26B in fiscal 2027, up 11.4% from $41.53B in fiscal 2026, with FCF margins projected to hold near 34% through 2028 and EPS normalized growing to $13.20.
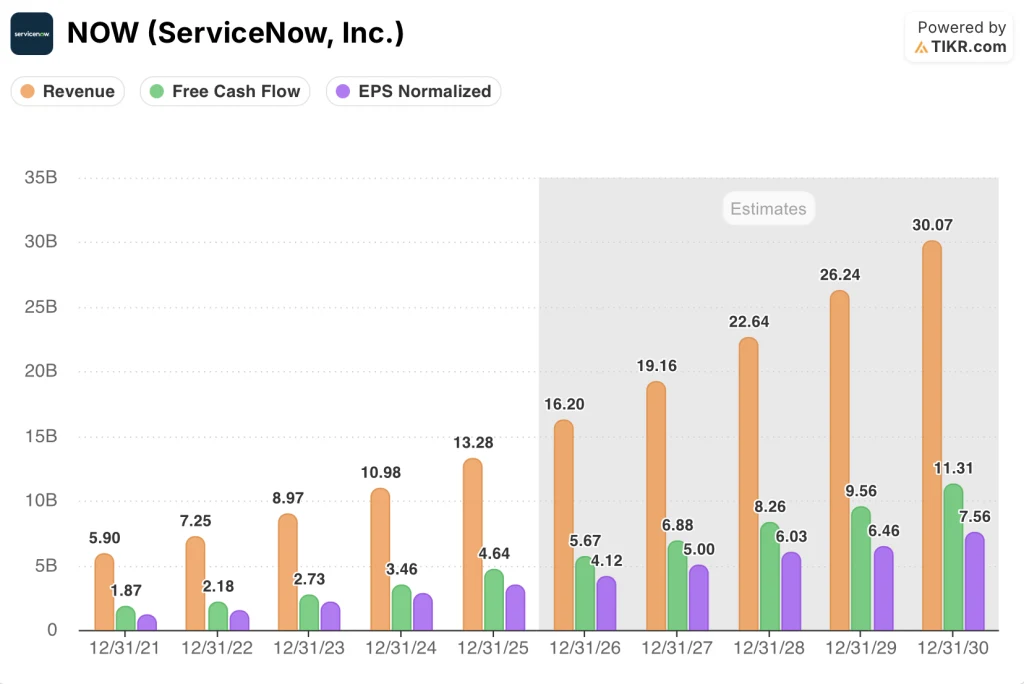
ServiceNow consensus calls for $19.16B in revenue in 2027, up 18.3% from $16.20B in 2026, with FCF margins expanding from 35% toward 35.9% by 2027, and normalized EPS growing to $5
ServiceNow is growing revenue faster and expanding margins from a lower base. It is doing so while generating an FCF yield that, at 6.7%, sits below Salesforce’s 10.9% today.
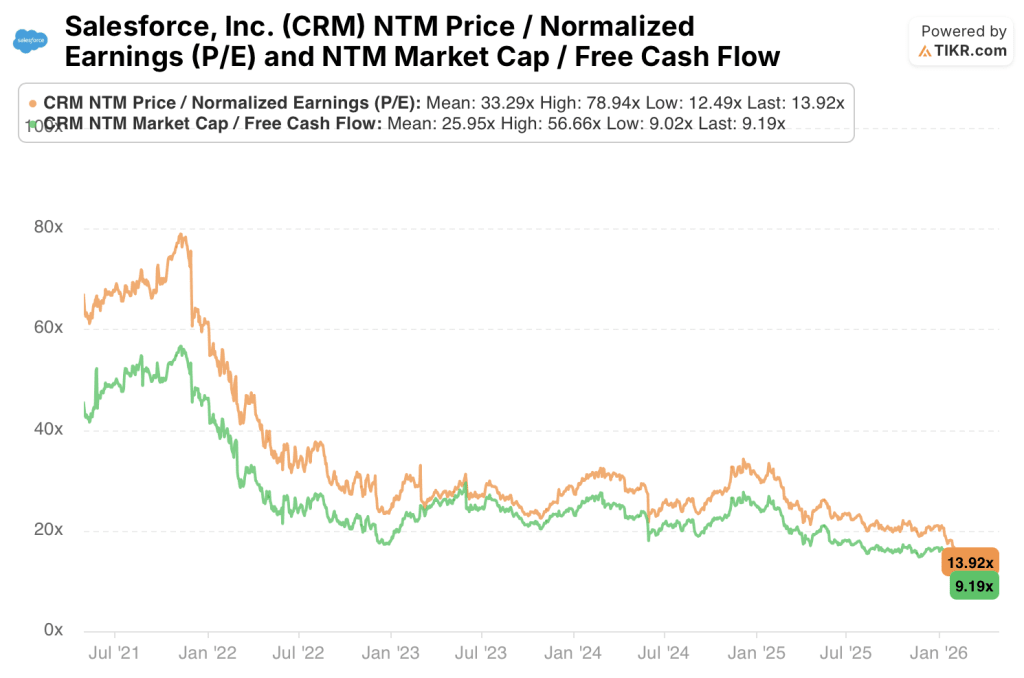
Salesforce stock trades at 13.92x forward P/E and 9.19x NTM FCF today, both at the low end of their 5-year ranges. The 5-year means sit at 33.29x and 25.95x respectively, meaning the stock is pricing in a fraction of the growth expectations it carried just three years ago.
Meanwhile, ServiceNow stock trades at 21.05x forward P/E and 15.03x NTM FCF today, both at the low end of their 5-year ranges. The 5-year means sit at 59.51x and 42.98x respectively, meaning the Street is paying significantly less for ServiceNow’s growth today than at any point in the last five years.
Both companies trade at roughly 90% upside to TIKR’s mid-case targets. ServiceNow achieves that at a higher entry multiple.
Salesforce stock appears undervalued at current levels, trading at 9.19x NTM FCF for a business generating $14.4B in free cash flow and projected to reach $17.2B by fiscal 2028.
ServiceNow stock appears fairly valued, with a 21.05x forward P/E pricing in a growth trajectory that must sustain above 18% annually to justify the premium.
The core risk in Salesforce stock is Agentforce adoption stalling at the proof-of-concept stage, which would confirm the bear case that AI adds engagement but not incremental revenue.
The core risk in ServiceNow stock is margin compression if headcount expansion outpaces workflow automation revenue during the platform’s enterprise buildout.
Salesforce’s next catalyst is the fiscal Q2 earnings report, where investors will watch Agentforce paid seat additions for the first time at scale.
ServiceNow’s next catalyst is the Q2 report showing whether 22% consensus growth holds as enterprise IT budgets face macro pressure.
Financials: The Profitability Race
Both companies share a near-identical gross margin profile, with Salesforce at 77.7% in fiscal 2026 and ServiceNow at 77.5% in fiscal 2025.
That structural similarity is what makes the operating margin gap so analytically important. When gross margins converge, the profitability race is decided by operating leverage, and these two businesses are at very different points on that trajectory.
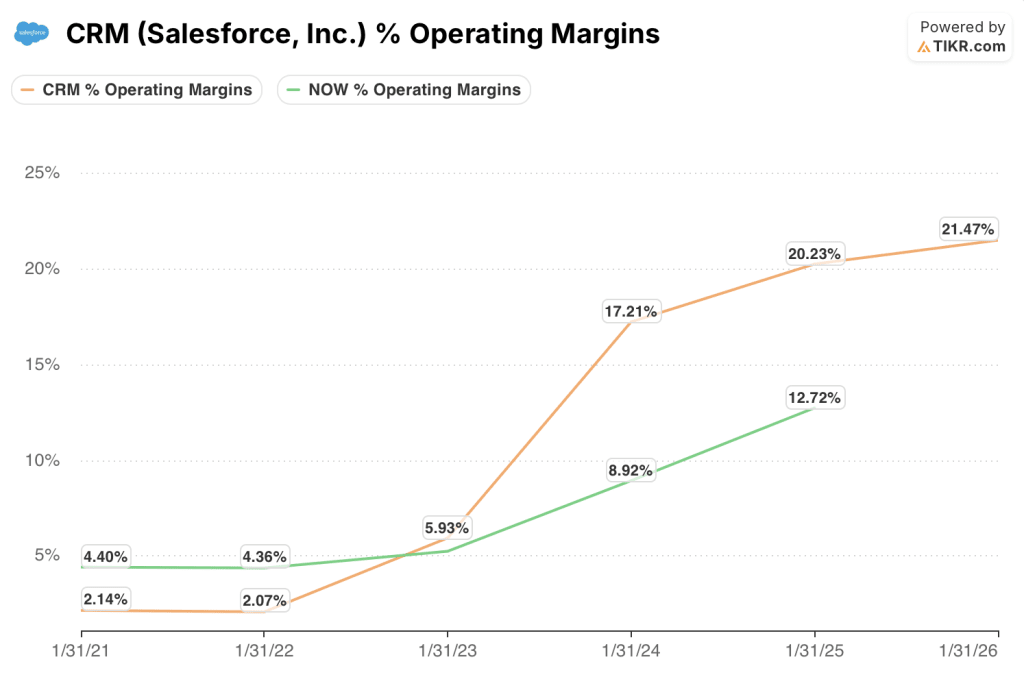
Salesforce’s operating margin expanded from 2.1% in fiscal 2021 to 20.2% in fiscal 2025 and 21.5% in fiscal 2026. That compression of the cost structure took the better part of four years and was accelerated by activist pressure in 2023.
The business has largely completed its operating leverage journey.
ServiceNow’s operating margin moved from 4.4% in 2021 to 15.1% in 2025, following a strikingly similar trajectory but running approximately four years behind.
ServiceNow still has roughly 5 to 6 percentage points of operating margin expansion ahead of it before reaching Salesforce’s current levels, assuming revenue growth continues at or above 18%.
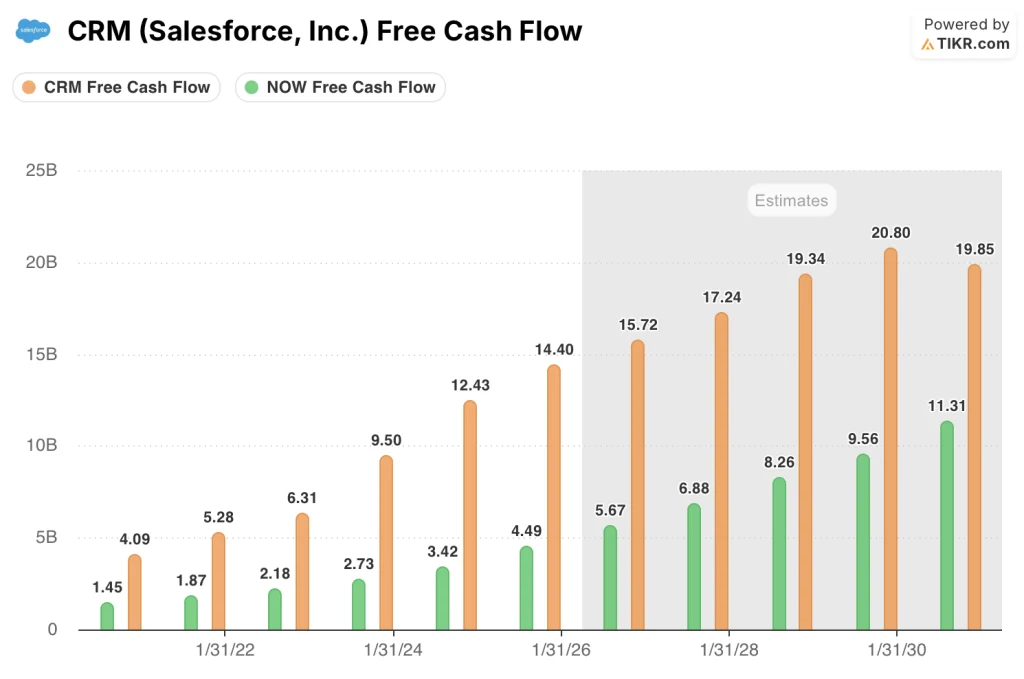
Salesforce generated $14.40B in free cash flow in fiscal 2026 at a 34.7% FCF margin. ServiceNow matched that conversion rate almost exactly, generating $4.64B at 34.9% in fiscal 2025, on a revenue base less than a third the size.
That is the most important number in this comparison: two companies with the same gross margin structure and the same FCF conversion rate, separated by a revenue gap of more than $28B, growing at very different speeds.
Valuation Model Take + Head-to-Head Scenario Breakdown
TIKR’s mid-case model for Salesforce assumes a revenue CAGR of 9.7% through fiscal 2031, a net income margin expanding toward 28.9%, and an EPS CAGR of 10.8%.
At a current price of $183.82, that produces a target of $508.61 by January 2035, implying a 176.7% total return.
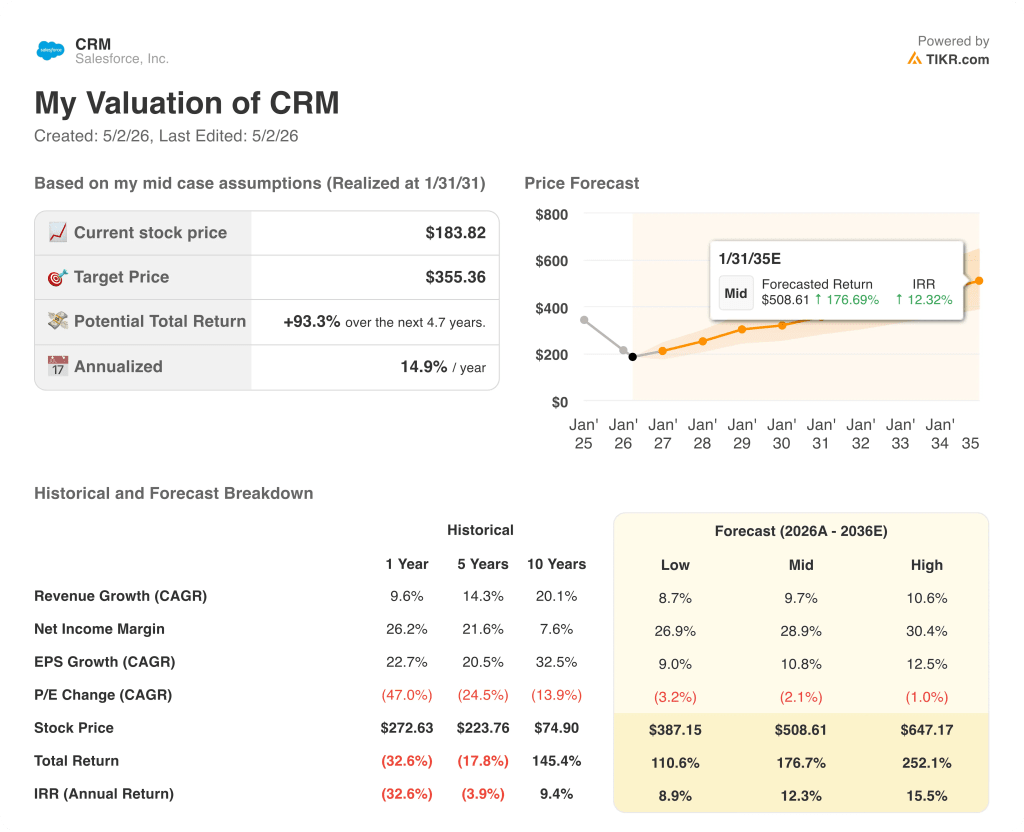
Salesforce stock appears undervalued at current levels, with a mid-case IRR of 12% annually over the next ~5 years, supported by an FCF yield of 11% that already prices in below-consensus growth assumptions and leaves room for multiple re-rating if Agentforce revenue contribution becomes measurable by fiscal 2027.
TIKR’s mid-case model for ServiceNow assumes a revenue CAGR of 14% through 2030, a net income margin expanding toward around 28%, and an EPS CAGR of 12%.
At a current price of $91, that produces a target of $227 by December 2034, implying a 149% total return.
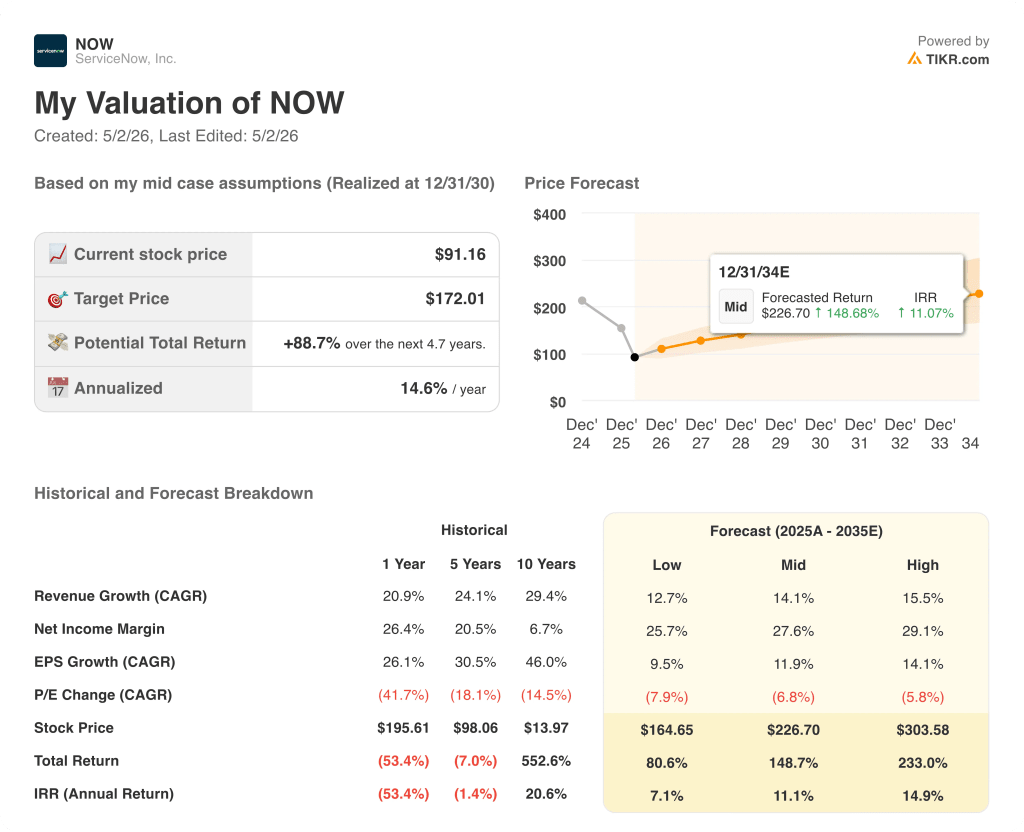
ServiceNow stock appears fairly valued, with a mid-case IRR of 11%, a result that reflects the market’s willingness to pay a full multiple for a business still early in its margin expansion. The model produces a respectable return, but it requires ServiceNow to sustain above-18% revenue growth through at least 2028 to avoid multiple compression.
The TIKR model IRR gap, 12% for Salesforce versus 11% for ServiceNow, favors Salesforce on a risk-adjusted basis. The lower multiple, higher FCF yield, and more predictable growth trajectory give CRM the edge for investors who weigh downside protection alongside return potential.
The central argument between these two stocks hinges on one question: whether ServiceNow’s operating margin expansion arc delivers the same outcome Salesforce’s did, and whether the current 21x forward P/E prices that correctly or with too much generosity.
The Case for Salesforce (CRM)
- Trading at 9.19x NTM FCF, Salesforce stock is at a multi-year valuation low despite generating $14.4B in free cash flow in fiscal 2026, up 15.8% year on year.
- FCF margins of 34.7% in fiscal 2026 are projected to hold near 34% through fiscal 2028, providing a durable floor under the stock even in a slow-growth environment.
- Agentforce paid deployments represent an unpriced catalyst: consensus models assume no material AI revenue contribution, so any measurable uptake drives estimate revisions higher.
- Operating margins have expanded from 2.1% to 21.5% over five years, and the cost structure is now optimized, meaning incremental revenue increasingly converts to free cash flow at above-average rates.
- The TIKR high-case IRR of 15.5% assumes only a 10.6% revenue CAGR, a threshold Salesforce exceeded in fiscal 2027 consensus ($46.26B, up 11.4%), making the high case more accessible than the multiple implies.
The Case for ServiceNow (NOW)
- Consensus revenue growth of 22% in 2026 and 18.3% in 2027 is structurally faster than any scenario TIKR’s Salesforce model contemplates through fiscal 2028.
- ServiceNow’s operating margin reached 15.1% in 2025 and is tracking toward 31.2% in the TIKR model’s EBIT forecast for 2025, suggesting the margin expansion runway is real and data-supported.
- FCF conversion of 34.9% in fiscal 2025 already matches Salesforce’s efficiency on a much smaller revenue base, indicating the business will generate disproportionate FCF as revenue scales toward $22.6B by 2028.
- The Now Platform’s expansion from ITSM into HR, legal, and procurement creates multiple independent growth vectors that reduce single-segment concentration risk and support the 18%+ growth thesis.
- ServiceNow’s 10-year historical revenue CAGR of 29.4% and EPS CAGR of 46% suggest the business has consistently beaten conservative consensus expectations, making the 21x forward P/E a less demanding hurdle than it appears in isolation.
Should You Invest in Salesforce, Inc. or ServiceNow, Inc.?
The only way to really know is to look at the numbers yourself. TIKR gives you free access to the same institutional-quality financial data that professional analysts use to answer exactly that question.
Pull up Salesforce, Inc. stock and ServiceNow, Inc. stock and you’ll see years of historical financials, what Wall Street analysts expect for revenue and earnings in the quarters ahead, how valuation multiples have moved over time, and whether price targets are trending up or down for both companies.
You can build a free watchlist to track Salesforce, Inc. and ServiceNow, Inc. alongside every other stock on your radar. No credit card required. Just the data you need to decide for yourself.
Access Professional Tools to Analyze CRM and NOW stock on TIKR for Free →