

Key Stats for Royal Caribbean Stock
- Current Price: $265.55
- Target Price (Mid): ~$525
- Street Target: ~$341
- Potential Total Return: ~98%
- Annualized IRR: ~16% / year
- Earnings Reaction: +0.68% (April 30, 2026)
Now Live: Discover how much upside your favorite stocks could have using TIKR’s new Valuation Model (It’s free) >>>
What Happened?
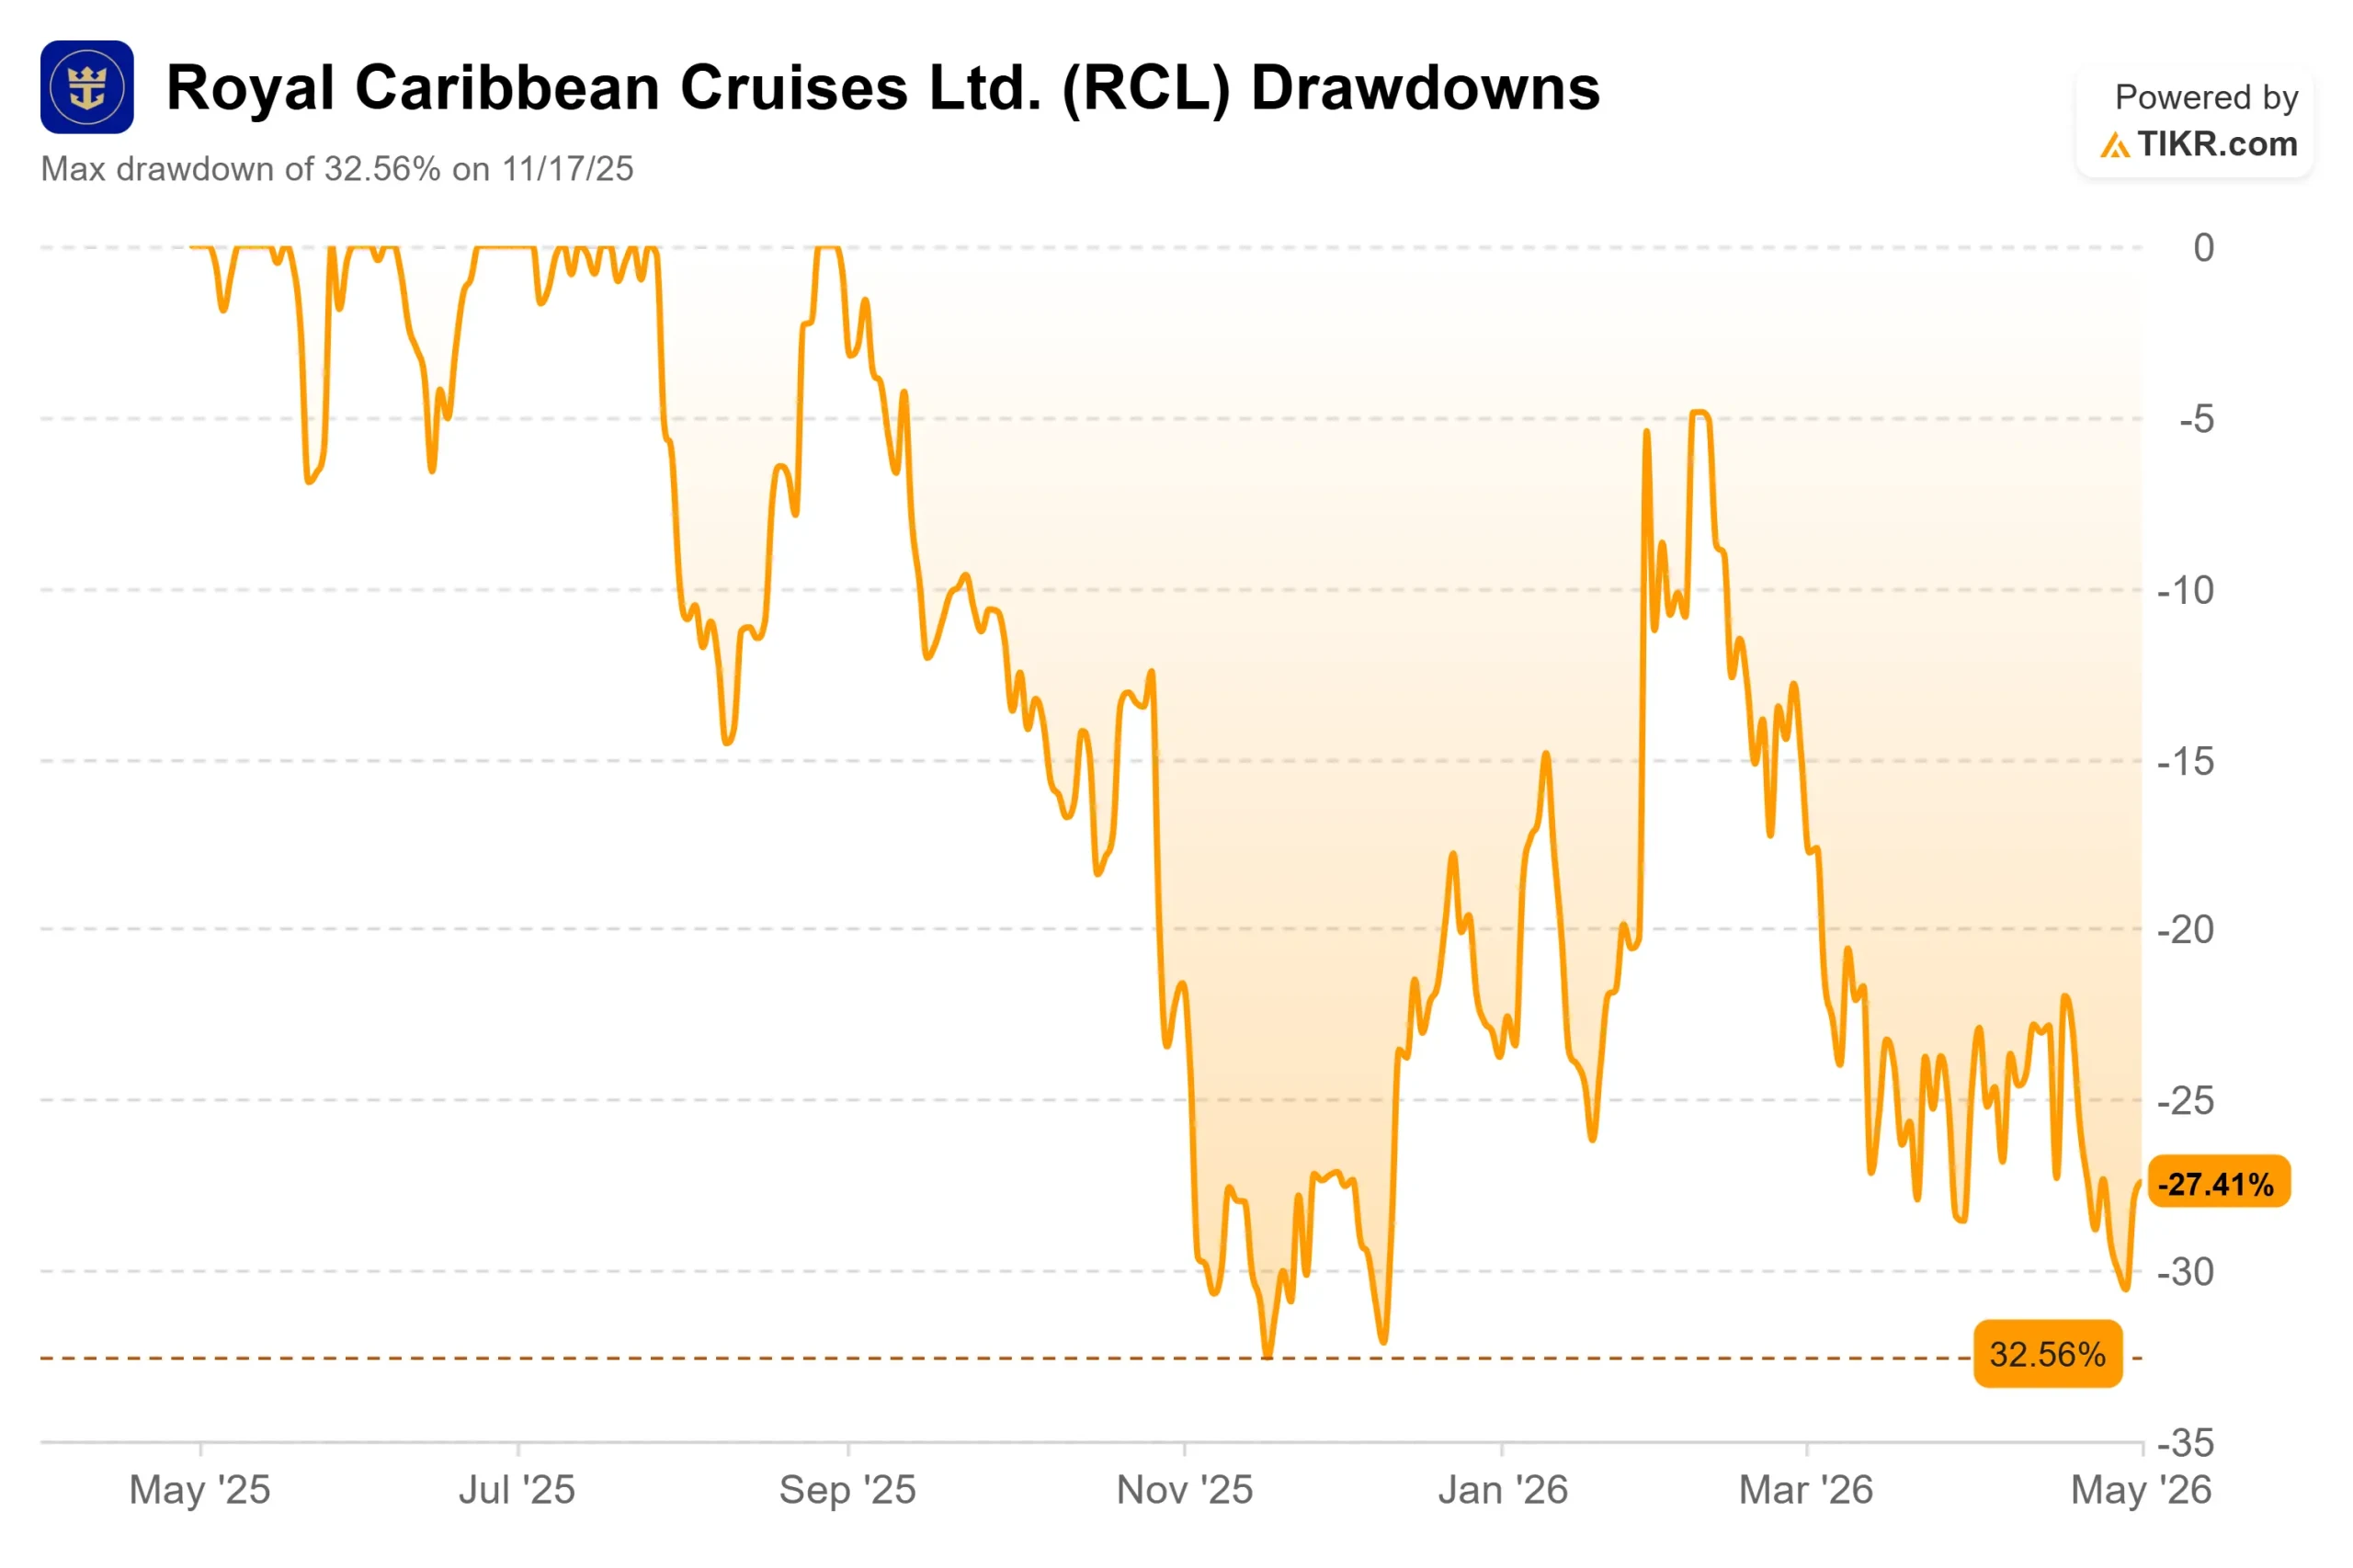
Royal Caribbean (RCL) keeps delivering strong results and watching the stock drift. After reporting Q1 2026 adjusted EPS of $3.60, a 12.59% beat against the Wall Street consensus of $3.20, shares closed up just 0.68% on April 30. The stock still sits roughly 27% below its 52-week high of $366.50. Bulls say geopolitical noise is masking one of the best travel businesses on the market. Bears say the guidance trim and fuel headwinds are real risks that justify the discount. The question is whether the current price already reflects both.
A Strong Quarter the Market Couldn’t Celebrate
Per Royal Caribbean’s investor relations materials, adjusted EPS came in at $3.60, up 33% from Q1 2025, and $0.37 above management’s own guidance midpoint. Revenue reached $4.45 billion, up 11.3% year-over-year. Adjusted EBITDA was approximately $1.7 billion at a 38% margin, more than 300 basis points above the prior year. Operating cash flow rose 13% to $1.8 billion. The company sailed 2.5 million guests at a 109% load factor, meaning ships ran above full double-occupancy.
CEO Jason Liberty was direct on the call: “Revenue grew 11% year-over-year. Earnings were 11% higher than guidance, and we returned $1.1 billion of capital through dividends and share buybacks.”
What tempered the reaction was the full-year guidance revision. Royal Caribbean cut its 2026 adjusted EPS range to $17.10–$17.50 from $17.70–$18.10. CFO Naftali Holtz itemized the driver: “Our earnings guidance includes a $0.62 headwind from fuel rates for the remaining of the year as well as a $0.12 headwind from lower expected earnings contribution from TUI Cruises.”
Those two items account for $0.74 of the total cut. Strip them out, and the underlying operational outlook is essentially unchanged from January.
See historical and forward estimates for Royal Caribbean stock (It’s free!) >>>
Why the Guidance Trim Is Smaller Than It Looks
Middle East tensions drove air travel costs sharply higher, cooling demand for Mediterranean sailings, which are among Royal Caribbean’s highest-yielding routes. Bookings softened in late February and March. But that softness has already reversed. Management confirmed that Mediterranean bookings recovered to above prior-year pacing.
The problem is that with limited inventory remaining for Q2 and Q3, the rebound shows up more clearly in Q4 numbers. Liberty was unambiguous on the direction: “We are not turning the corner. We have turned the corner.”
A separate drag came from West Coast Mexico itineraries, which represent 5% of annual capacity. Management described that as a one-time event that sets up favorable comparisons heading into 2027.
The Caribbean, representing 57% of annual deployment, was unaffected throughout. Caribbean yields are expected to grow for the full year, even against elevated industry capacity, supported by Royal Caribbean’s exclusive private destinations. Liberty described the full-year yield shape as a “smiley face,” with Q2 and Q3 absorbing the heaviest headwinds and Q4 positioned to rebound. He confirmed directly that without the Mediterranean drag, management would have raised full-year yield guidance.
Discover how much upside RCL could have using TIKR’s Valuation Model
The Repeat Guest Flywheel
Repeat guests now account for approximately 40% of bookings, up from a historical one-third. Those guests spend about 25% more per cruise than first-timers, per Liberty on the earnings call. The company’s cross-brand loyalty program, the Points Choice rewards expansion, and the new Royal ONE co-branded credit card, which covers Royal Caribbean International, Celebrity Cruises, and Silversea, are all designed to deepen that relationship.
The digital numbers reinforce it. Monthly active users on the Royal Caribbean app are five times higher than 2019 levels, adoption exceeds 90%, and more than half of onboard revenue is now booked digitally before guests step aboard. That pre-cruise capture rate improves revenue visibility and lowers the cost of onboard selling.
The Perfecta Performance Program, Royal Caribbean’s long-term financial plan, targets a 20% compound annual growth rate in adjusted EPS through 2027 and a return on invested capital in the high teens. Higher repeat rates and earlier digital bookings are two of the core levers making that target credible.
Destination Pipeline as a Yield Catalyst
Royal Caribbean is expanding its private destination portfolio from three to eight locations by 2028. At a third-party port, excursion economics are shared. At a proprietary destination, Royal Caribbean captures everything. The Royal Beach Club Santorini opened recently, with management reporting strong demand. Perfect Day Mexico targets a soft opening in Q4 2027, ramping fully through 2028.
Royal Caribbean brand CEO Michael Bayley described the Gulf of Mexico opportunity on the call: “If you look at the opportunity that exists in Texas, it’s a market which is much larger than Florida and its penetration rate is much lower than Florida.” The Royal Beach Club in Cozumel is expected in early 2028, with Perfect Day Costa Maya targeted for late 2027. Construction on Perfect Day Mexico has resumed after earlier environmental permitting issues were resolved.
On the hardware side, Royal Caribbean recently announced orders for Icon 6 and Icon 7. Legend of the Seas is expected in Q2 2026, and Liberty noted its early book position and pricing are already ahead of where Icon of the Seas and Star of the Seas were at comparable stages.

See how Royal Caribbean performs against its peers in TIKR (It’s free!) >>>
Valuation: A Premium With a Track Record Behind It
Royal Caribbean trades at 12.09x NTM EV/EBITDA, a real premium versus Carnival Corporation at 8.68x and Norwegian Cruise Line Holdings at 8.53x, per TIKR’s Competitors page as of May 1, 2026. Royal Caribbean has beaten EBITDA estimates in each of the five most recent quarters, with beats ranging from 2.07% to 6.72%. On NTM P/E of 15.26x, the valuation looks more reasonable given the earnings surprises track record and the Perfecta targets.
Of the analysts covering RCL, 15 rate it Buy, 4 Outperform, and 7 Hold, with zero Underperforms or Sells, per TIKR’s Street Targets as of May 1, 2026. The mean Street target is $341.42, implying around 29% upside from $265.55. Citi kept its Buy rating after Q1 while cutting its target to $348 from $377. JPMorgan maintains its Overweight rating at $341.
TIKR shows LTM net debt of $21.28 billion at 2.98x net debt/EBITDA. The company refinanced near-term maturities in Q1 with a $2.5 billion investment-grade bond offering that was significantly oversubscribed. Scheduled debt maturities run $1.2 billion in 2026, $2.5 billion in 2027, $3.1 billion in 2028, $1.1 billion in 2029, and $1.0 billion in 2030. Against the 2025 operating cash flow of $6.47 billion, those maturities are manageable.
TIKR Advanced Model Analysis
- Current Price: $265.55
- Target Price (Mid): ~$525
- Potential Total Return: ~98%
- Annualized IRR: ~16% / year

See analysts’ growth forecasts and price targets for Royal Caribbean stock (It’s free!) >>>
The TIKR mid-case uses a revenue CAGR of around 8%, driven by capacity additions of 4%–7% annually through 2029 as new ships enter service, and yield growth compounding through private destination ramp-ups and repeat guest monetization. The margin driver is operating leverage on a fixed cost base, with net income margins projected at around 26% by 2030 versus 19.6% in the trailing twelve months per TIKR’s actuals data. The primary risk is fuel cost persistence: if Middle East tensions keep oil elevated and raise hedging costs for 2027 and 2028, the margin expansion path narrows. On the demand side, 40% repeat guests, a 109% load factor, and a record WAVE season make a structural demand deterioration difficult to justify at current prices.
Conclusion
Watch the Q3 2026 net yield guidance issued at Q2 earnings in late July. Management indicated Q3 will face headwinds similar to Q2 from Mediterranean exposure. If bookings have truly turned, the Q3 outlook will confirm it. In the writer’s view, a Q3 net yield figure above flat in constant currency would support the thesis. A second consecutive downside surprise would be a signal worth taking seriously.
Royal Caribbean’s Q1 results show a business executing well on bookings, margins, capital return, and digital engagement, while carrying short-term fuel and geopolitical costs that are quantified and largely hedged. At 27% below its 52-week high and below the Street’s mean target, the guidance trim looks more like a temporary compression than a structural break.
See what stocks billionaire investors are buying so you can follow the smart money with TIKR.
Should You Invest in Royal Caribbean?
The only way to really know is to look at the numbers yourself. TIKR gives you free access to the same institutional-quality financial data that professional analysts use to answer exactly that question.
Pull up Royal Caribbean, and you’ll see years of historical financials, what Wall Street analysts expect for revenue and earnings in the quarters ahead, how valuation multiples have moved over time, and whether price targets are trending up or down.
You can build a free watchlist to track Royal Caribbean alongside every other stock on your radar. No credit card required. Just the data you need to decide for yourself.
Analyze Royal Caribbean on TIKR Free →
Looking for New Opportunities?
- See what stocks billionaire investors are buying so you can follow the smart money.
- Analyze stocks in as little as 5 minutes with TIKR’s all-in-one, easy-to-use platform.
- The more rocks you overturn… the more opportunities you’ll uncover. Search 100K+ global stocks, global top investor holdings, and more with TIKR.
Disclaimer:
Please note that the articles on TIKR are not intended to serve as investment or financial advice from TIKR or our content team, nor are they recommendations to buy or sell any stocks. We create our content based on TIKR Terminal’s investment data and analysts’ estimates. Our analysis might not include recent company news or important updates. TIKR has no position in any stocks mentioned. Thank you for reading, and happy investing!


