Key Stats for Figma Stock
- Current Price: $22.92
- Target Price (Mid): ~$64
- Street Target: ~$40
- Potential Total Return: ~178%
- Annualized IRR: ~25% / year
- Earnings Reaction: +13.24% (5/14/26)
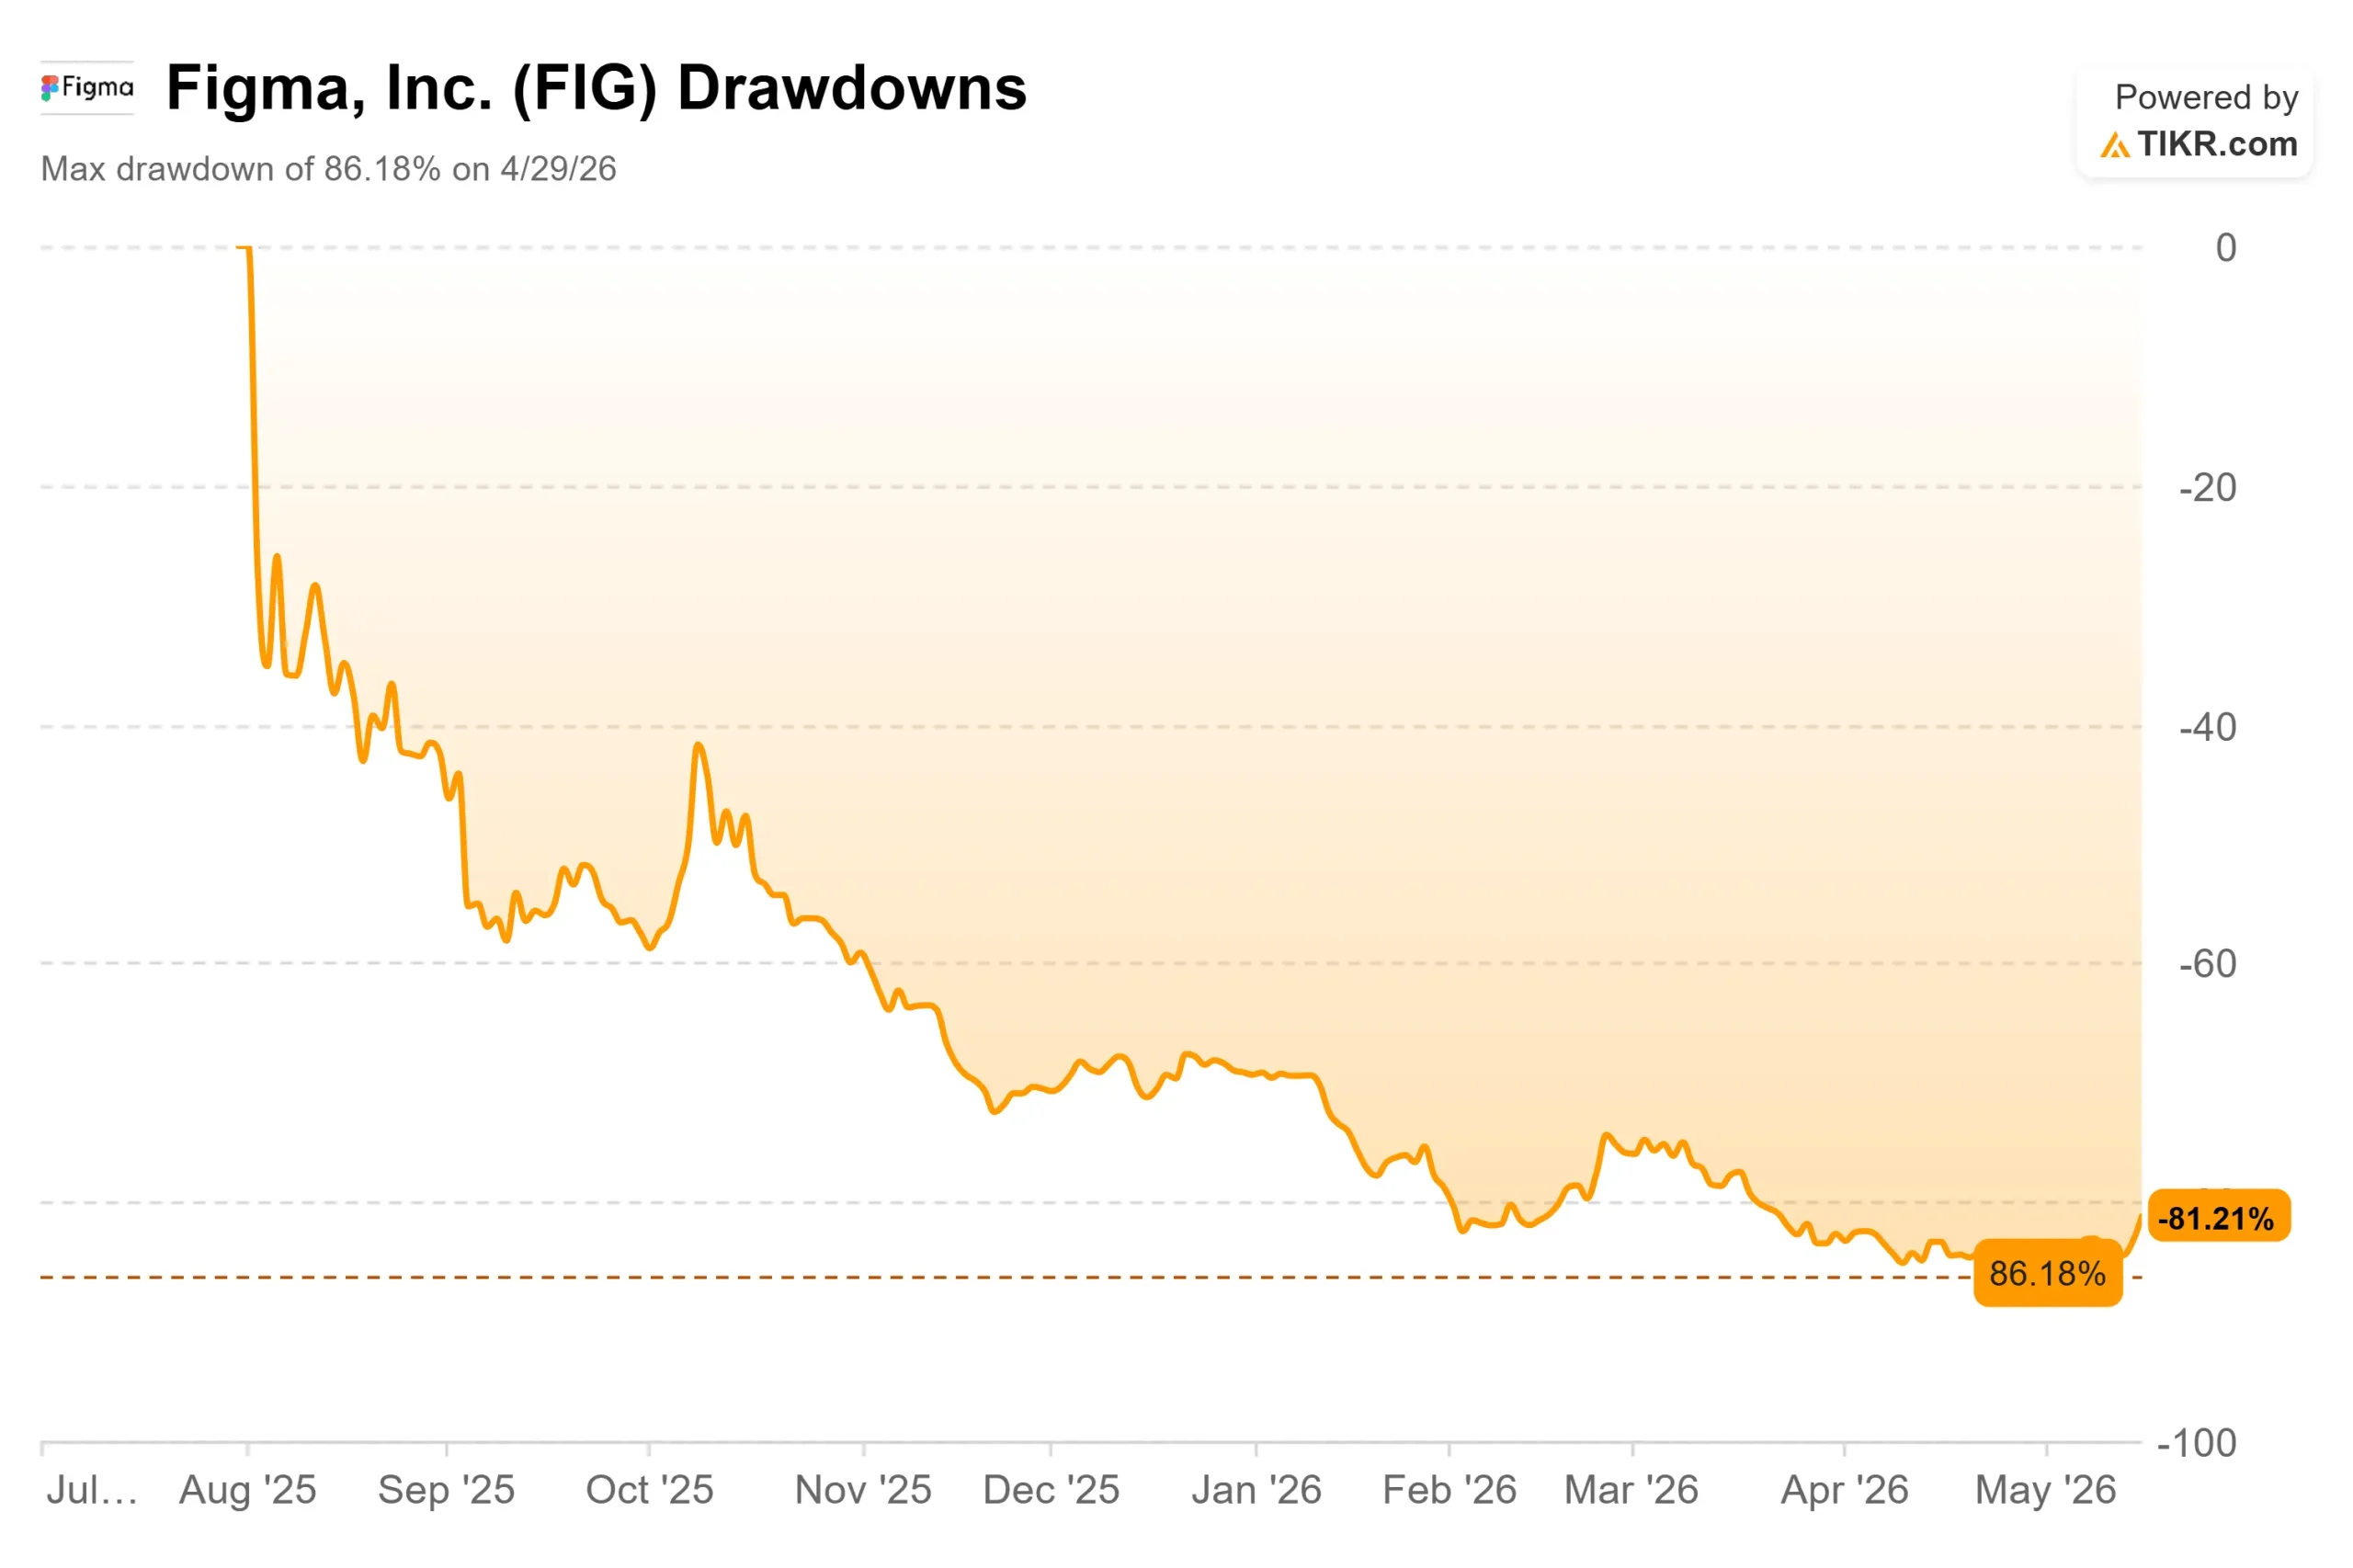
- Max Drawdown: 86.18% (4/29/26)
Now Live: Discover how much upside your favorite stocks could have using TIKR’s new Valuation Model (It’s free) >>>
What Happened?
Figma, Inc. (FIG) priced its IPO at $33 on July 31, 2025, hit an intraday high of $142.92 on its first trading day, and then spent the next nine months in freefall. By April 29, 2026, the stock had shed 86.18% from that peak, touching a 52-week low of $16.60.
The selloff had real catalysts. In February 2026, Google launched Stitch, a free AI-powered design tool, stoking fears about Figma’s pricing power. In March, law firm Lowey Dannenberg opened a securities class-action investigation into the company. In April, Anthropic launched Claude Design, a direct competitor to Figma’s core product. Then, on May 15, Figma disclosed in its quarterly filing that Anthropic’s legal dispute with the U.S. government over whether Claude could be designated a federal supply chain risk could hurt Figma’s government sales, since Claude powers Figma’s federal AI products.
Then Q1 earnings landed on May 14, and the stock jumped 13.24% in one session. The question investors are now asking: Is this a real recovery, or a relief rally in a structurally challenged name?
See historical and forward estimates for Figma stock (It’s free!) >>>
What Q1 Actually Showed
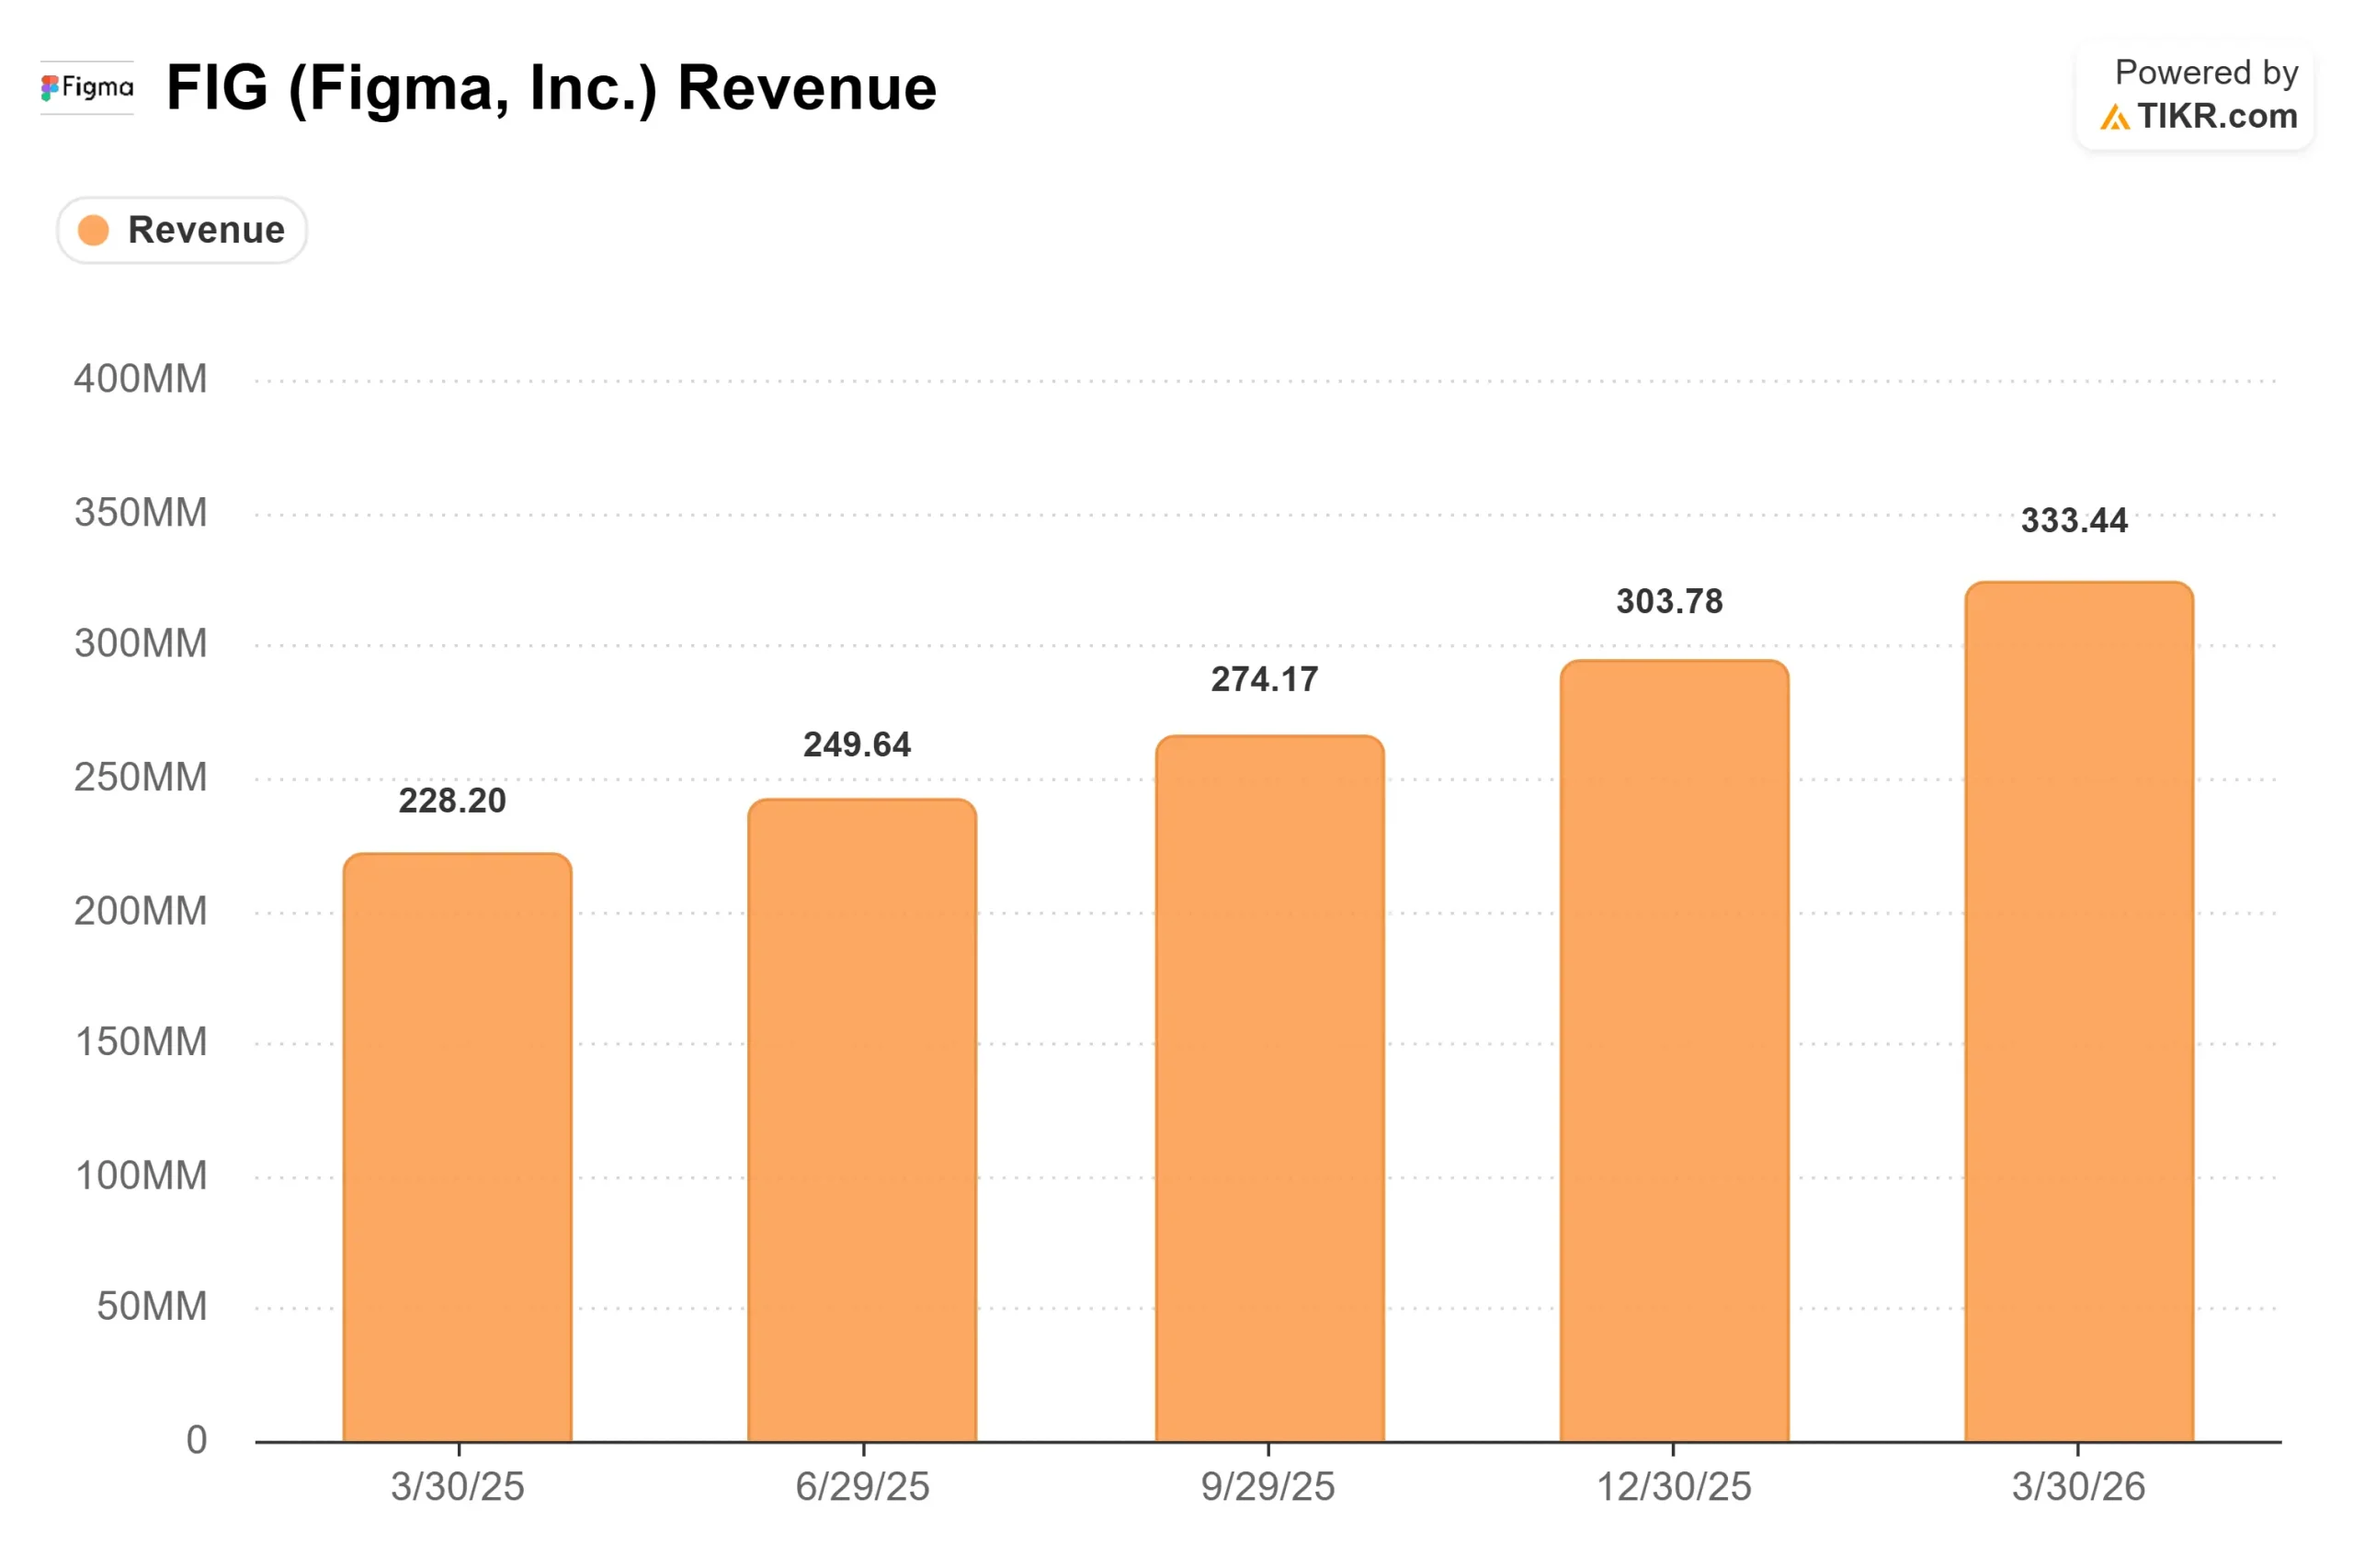
Revenue grew 46% year-over-year to $333.4 million, beating the $316.02 million analyst consensus by 5.51%. That marks Figma’s second consecutive quarter of accelerating growth, up from 40% in Q4 2025 and 38% in Q3. Non-GAAP EPS of $0.10 beat the $0.06 estimate by 60.98%.
The numbers beyond the headline:
- Net dollar retention reached 139%, up 3 percentage points from Q4 and the highest in over two years. This measures how much existing customers are spending year-over-year.
- Paid customers spending over $100,000 in annual recurring revenue grew 48% year-over-year.
- Total paid customers reached approximately 690,000, up 54% from roughly 450,000 a year ago.
- Free cash flow margin was 27% for the quarter, even after absorbing a $56 million one-time cash outflow for Figma’s first-ever annual bonus payout.
Management raised full-year revenue guidance by $55 million to $1.422 to $1.428 billion, implying around 35% growth. Non-GAAP operating income guidance was lifted by $25 million to $125 to $135 million. Q2 guidance came in at $348 to $350 million, implying around 40% growth.
The AI Monetization Signal
The figure that arguably moved the stock the most was not in the income statement. It was a retention metric from April: over 75% of Org and Enterprise users who had previously exceeded their AI credit limits continued consuming credits after Figma enforced those limits on March 18. That measures willingness to pay, not just usage.
Figma Make, the company’s AI-powered app builder, had previously been included free with paid seats. Once credit limits went live, heavy usage started generating incremental revenue. The early pull-through is real. CFO Praveer Melwani described one of the world’s largest enterprise technology companies purchasing additional credits to expand AI capabilities across 7 business units after standardizing on Figma Make. As of Q1, Pro teams purchasing AI credit add-ons had an average annualized spend of over 3x that of teams that had not.
MCP Figma’s Model Context Protocol integration, which lets AI agents read and write directly to Figma files, is a separate signal. MCP weekly active users grew 5x quarter-over-quarter. Among customers spending over $100,000 in ARR, those using MCP grew full seats approximately 70% faster than those who were not. MCP is currently free in beta, making it a future monetization layer on top of seats and credits.
CEO Dylan Field framed the logic on the earnings call: “in this world where bits are abundant, what’s scarce is human creativity, actual point of view, care and craft and judgment.”
What the Bears Are Still Right About
A strong quarter does not resolve the competitive picture. Claude Design launched in April as a direct rival. Google’s Stitch is free. On the earnings call, Field acknowledged the threat plainly: “They have the ability to train first-party models and couple those with their own products if they choose to. And so we have to pay attention to that.”
Gross margin slipped to 82% in Q1 as AI inference costs rose, and management declined to set a floor. A proposed class-action lawsuit filed separately in November 2025 alleges Figma used customer design files to train its AI models without permission. The Lowey Dannenberg securities investigation and the Anthropic government supply chain risk add further legal uncertainty that is not yet priced.
On valuation multiples, Figma trades at 7.02x NTM EV/Revenue and 84.51x NTM P/E. Adobe (ADBE), the closest publicly traded design software peer on TIKR, trades at 3.76x NTM EV/Revenue and 10.28x NTM P/E. Figma’s premium reflects a substantially higher growth rate, but it also means any guidance miss hits a stretched multiple hard. The Street’s mean price target of around $40 implies roughly 75% upside, well below what the TIKR model projects.
See how Figma performs against its peers in TIKR (It’s free!) >>>
TIKR Advanced Model Analysis
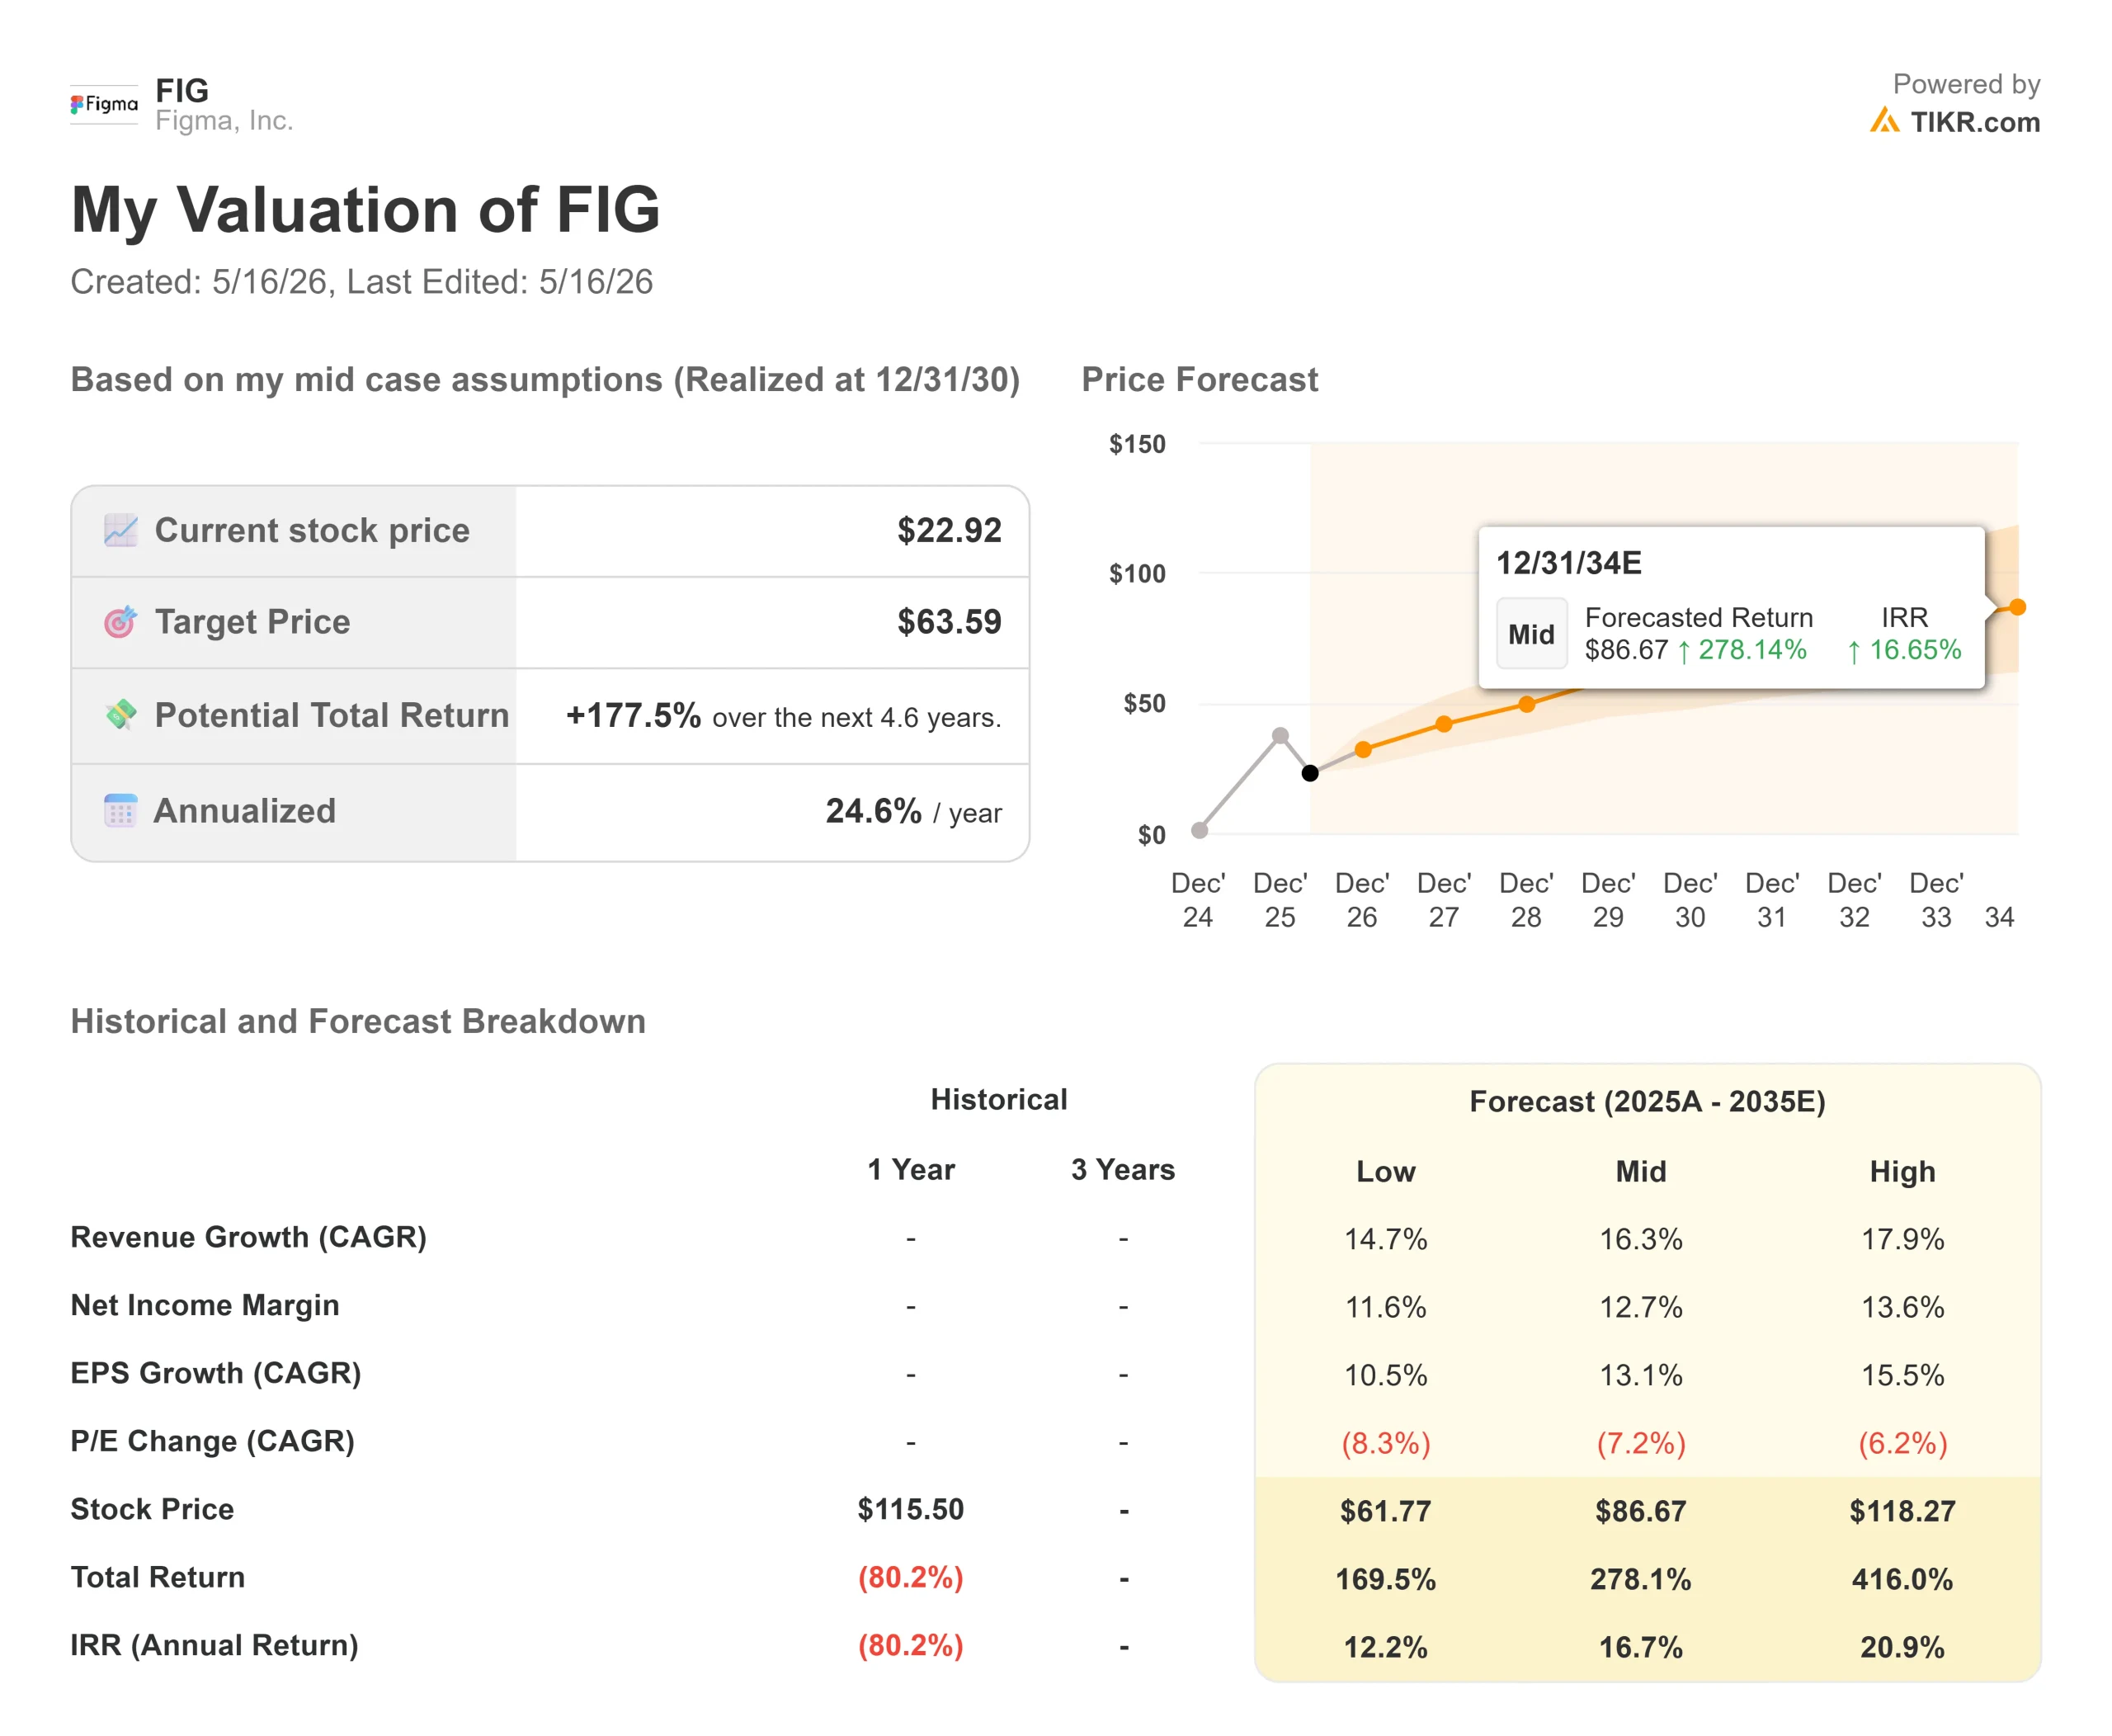
- Current Price: $22.92
- Target Price (Mid): ~$64
- Potential Total Return: ~178%
- Annualized IRR: ~25% / year
See analysts’ growth forecasts and price targets for Figma stock (It’s free!) >>>
The TIKR mid-case model, realized at 12/31/30, is built on two revenue growth drivers: sustained enterprise seat expansion fueled by AI product adoption, and the scaling of AI credit monetization as a consumption layer on top of the base seat model. The model assumes a revenue CAGR of around 16% and a net income margin expanding to around 13%. The margin driver is operating leverage as the revenue base scales, supported by Figma’s stated investment in first-party AI models trained on its design corpus to reduce inference costs over time.
The primary risk is competitive displacement. If Claude Design or Stitch erodes Figma’s enterprise retention, the seat expansion and NDR assumptions that underpin this model break down. Q1’s data gives no evidence of that. Q2’s will be the real test.
Conclusion
The number to watch is net dollar retention. At 139%, it is the strongest signal that Figma’s enterprise base is not defecting; it is spending more. If NDR holds above 130% when Q2 results come in, the argument that AI competition is existential gets much harder to sustain. If it drops materially, the bears get their data point.
The near-term catalyst is June, when Figma’s Config user conference is scheduled. Management flagged that Q2 operating income will be impacted by Config costs. A strong product reveal that expands the AI credit surface area would reinforce the recovery thesis. A quiet event would not.
The Q1 fundamentals are real. Whether the stock can sustain its re-rating from $16.60 toward what the TIKR model projects is what the next two quarters will answer.
See what stocks billionaire investors are buying so you can follow the smart money with TIKR.
Should You Invest in Figma?
The only way to really know is to look at the numbers yourself. TIKR gives you free access to the same institutional-quality financial data that professional analysts use to answer exactly that question.
Pull up Figma, and you’ll see years of historical financials, what Wall Street analysts expect for revenue and earnings in the quarters ahead, how valuation multiples have moved over time, and whether price targets are trending up or down.
You can build a free watchlist to track Figma alongside every other stock on your radar. No credit card required. Just the data you need to decide for yourself.
Looking for New Opportunities?
- See what stocks billionaire investors are buying so you can follow the smart money.
- Analyze stocks in as little as 5 minutes with TIKR’s all-in-one, easy-to-use platform.
- The more rocks you overturn… the more opportunities you’ll uncover. Search 100K+ global stocks, global top investor holdings, and more with TIKR.
Disclaimer:
Please note that the articles on TIKR are not intended to serve as investment or financial advice from TIKR or our content team, nor are they recommendations to buy or sell any stocks. We create our content based on TIKR Terminal’s investment data and analysts’ estimates. Our analysis might not include recent company news or important updates. TIKR has no position in any stocks mentioned. Thank you for reading, and happy investing!