Key Stats for S&P Global Stock
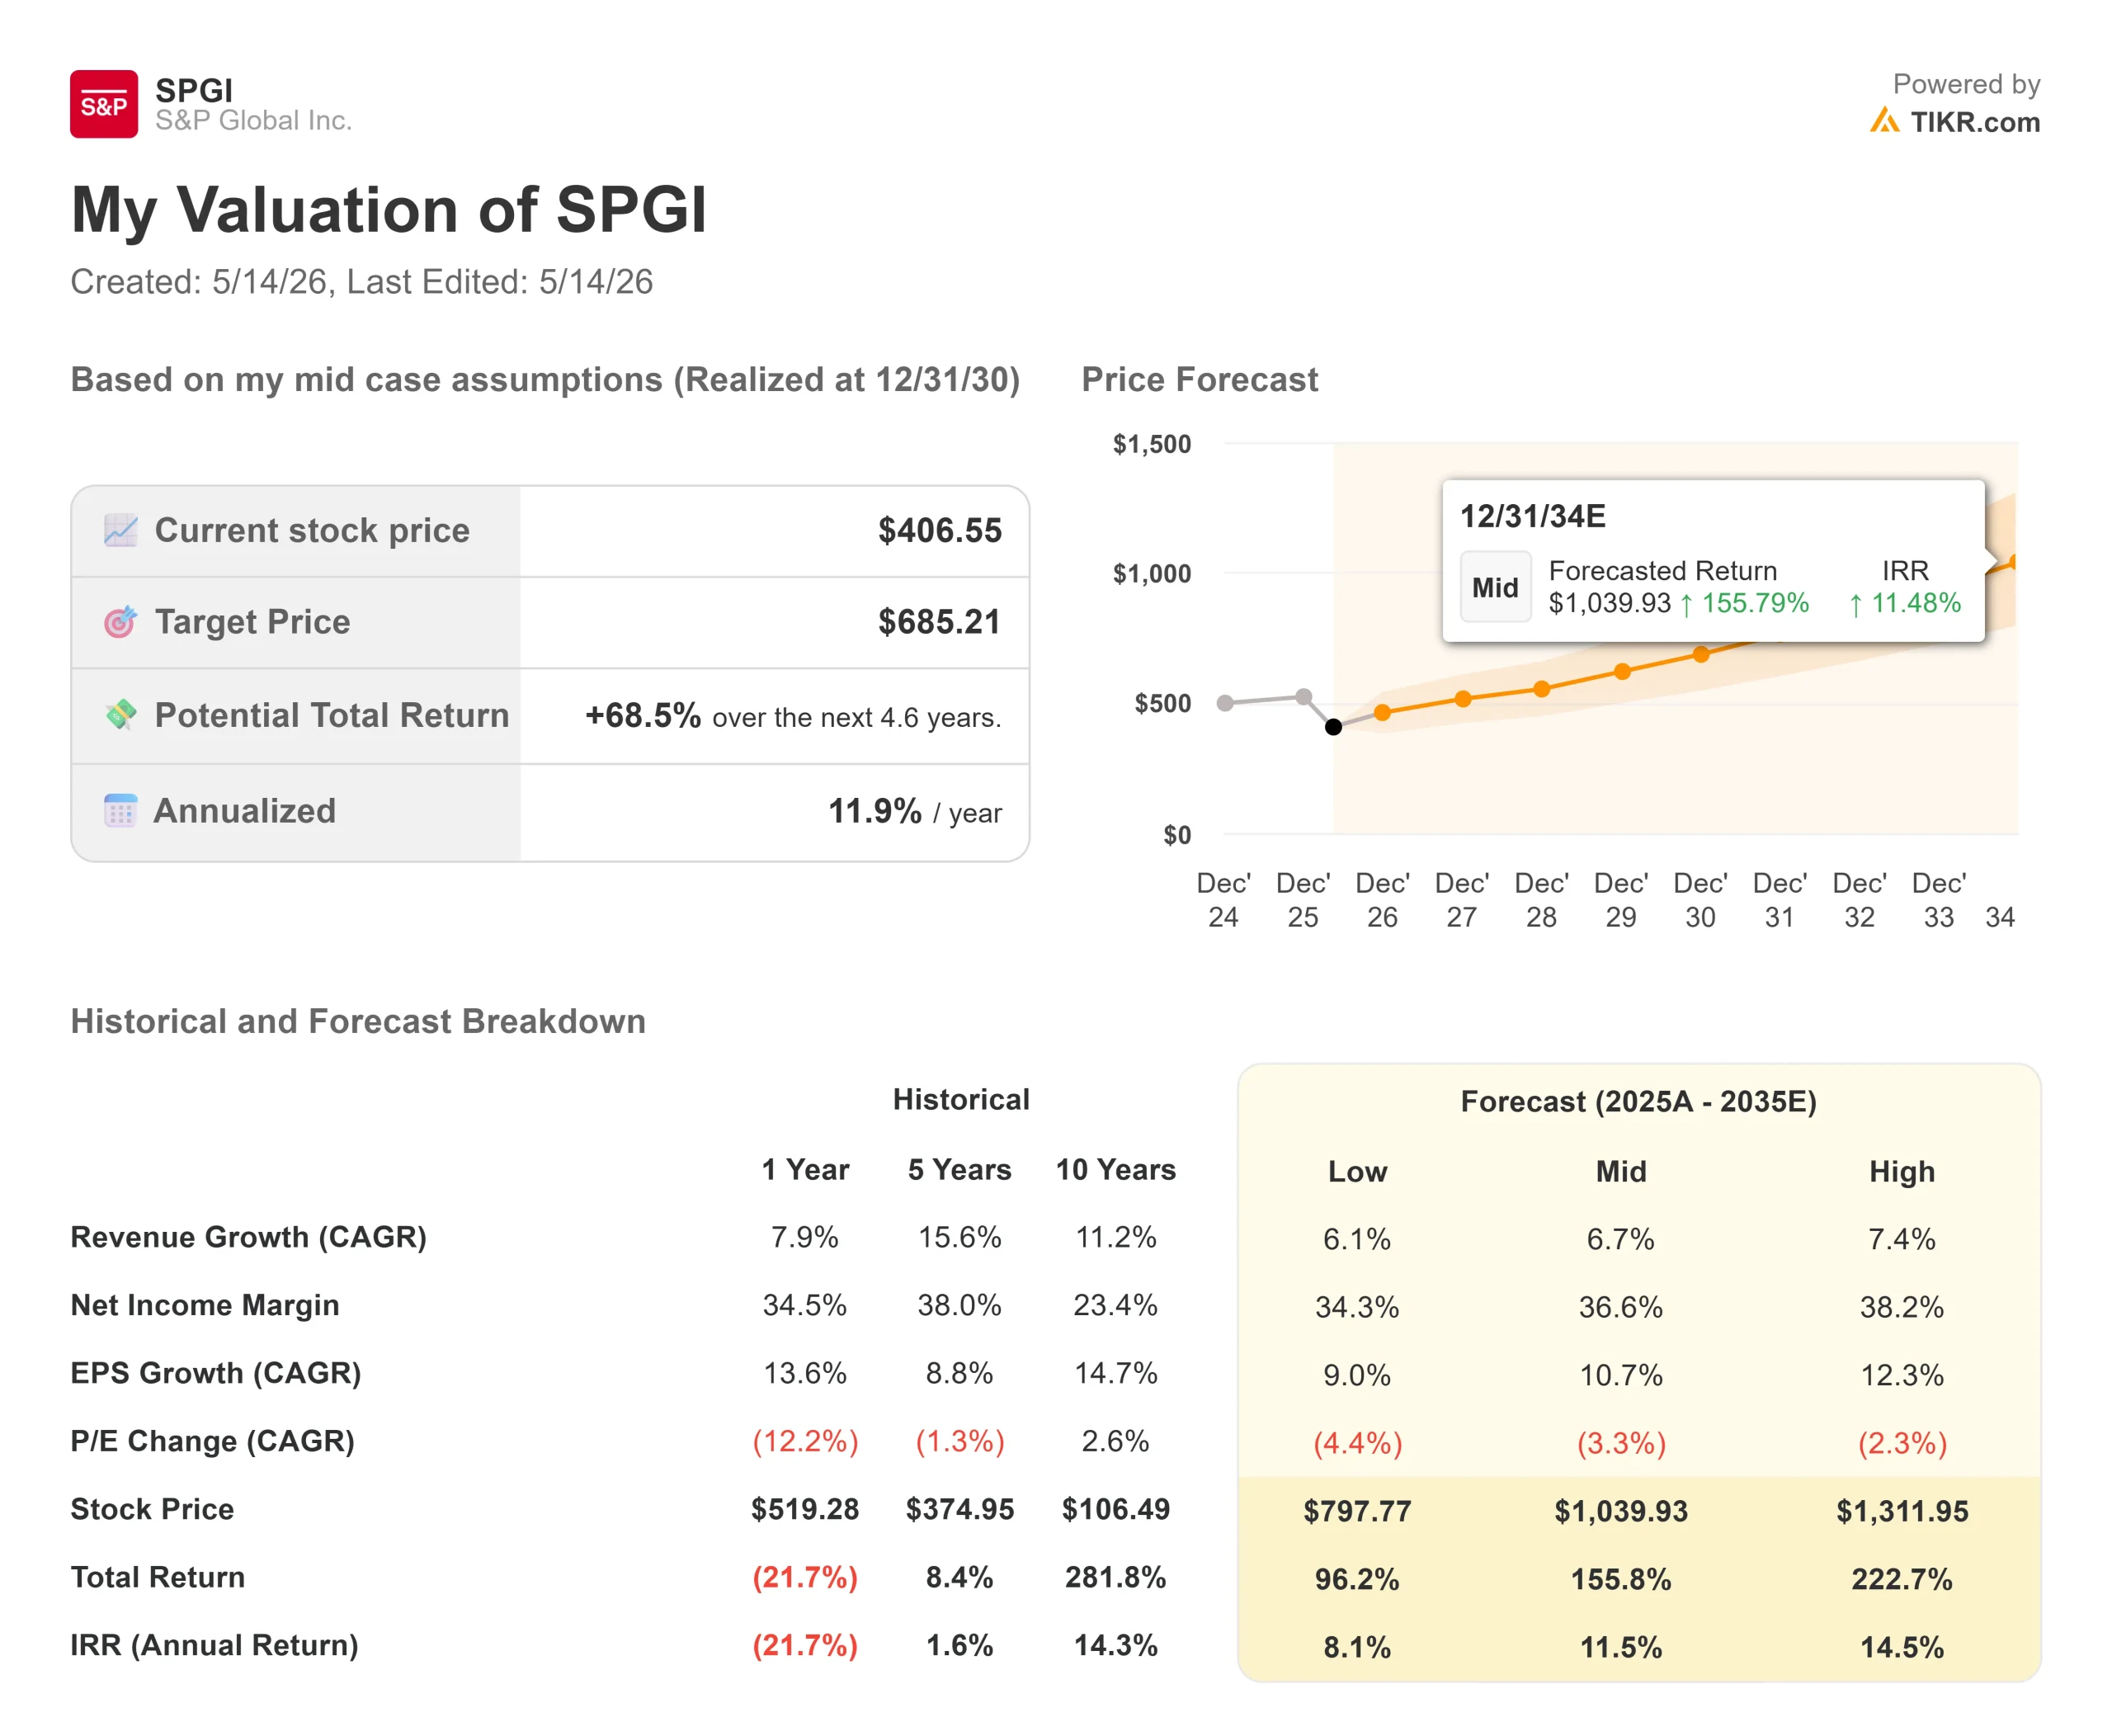
- Current Price: $406.55
- Target Price (Mid): ~$685
- Street Target: ~$534
- Potential Total Return: ~69%
- Annualized IRR: ~12% / year
- Earnings Reaction: (0.06%) on April 28, 2026
- Max Drawdown: 30.73% on February 11, 2026
Now Live: Discover how much upside your favorite stocks could have using TIKR’s new Valuation Model (It’s free) >>>
What Happened?
S&P Global Inc. (SPGI) dropped 4.15% on May 13, the day after its Mobility division held an inaugural Investor Day in New York, outlining the planned spin-off of Mobility Global Inc. as an independent public company.
That reaction fits the pattern of 2026 for this stock. SPGI beat Q1 2026 revenue and earnings estimates on April 28, and the stock barely moved. Before that, it crashed 30.73% from its peak on February 11 after 2026 guidance came in below analyst expectations. Now the stock sits at $406.55, down 22% year to date and more than 30% off its 52-week high of $579.05, with 23 out of 25 covering analysts rated Buy or Outperform and a mean Street target of $534, roughly 31% above the current price.
The question is simple: Is this a fundamentally impaired company, or is the market wrong? The Investor Day data suggests the latter.
What the Market Sold, and Why It Probably Shouldn’t Have
The May 12 Investor Day was not a hype event. Mobility Global CFO-designate Matt Calderone presented a business with $1.75 billion in annual revenue, adjusted EBITDA margins in the 40% range, and subscription revenue above 80% of the total. The division targets returning 75% or more of free cash flow to shareholders annually, with a medium-term organic growth target of 7.5% to 10% per year.
Mobility isn’t being spun off because it’s weak. It’s being spun off because it’s strong enough to stand alone. After the separation, S&P Global becomes a leaner four-segment company anchored in Ratings, Market Intelligence, Commodity Insights, and Indices. The May 13 sell-off looks like traders rotating out after the catalyst passed, not a verdict on the fundamentals.
The CARFAX Moat Investors Are Underpricing
CARFAX, which represents 65% of Mobility’s revenue, has 38 billion vehicle records sourced from 177,000 data providers and adds 6 million new records every day. Its vehicle history report is viewed more than 25 million times a month. The CarCare app has 53 million consumers actively managing their vehicles across the U.S. and Canada.
Scott Fredericks, President of CARFAX, explained why this is hard to replicate: “It’s a relationship-by-relationship, shop-by-shop, dealer-by-dealer, police agency by police agency, ground truth built over 40 years. Good luck trying to replicate it.”
The result is that 90% of Mobility’s revenue flows from this proprietary data estate. Switching costs are structural. An OEM using Mobility’s forecasting tools cannot easily migrate without revalidating years of historical decisions. A dealer displaying CARFAX in their showroom has no incentive to replace a brand consumers already ask for by name.
The B2B segment, the remaining 35% of Mobility’s revenue, generates $600 million annually with 82% subscription revenue and covers all 40 of the top 40 global OEMs. Joe LaFeir, President of Mobility Business Solutions, framed the opportunity clearly: “We haven’t hit the 50% mark on the stuff we can sell those 40.” That’s a cross-sell story, not a saturation story.

See historical and forward estimates for S&P Global stock (It’s free!) >>>
The Post-Spin SPGI: Four Businesses at a Discount
Once the spin closes in mid-2026, S&P Global’s retained portfolio will be four segments that together generated approximately $13.8 billion in combined revenue in 2025:
- Ratings: $4.72 billion, operating margin above 60%, the dominant global credit rating franchise
- Market Intelligence: $4.92 billion, subscription-led data and analytics tools embedded in institutional workflows
- Commodity Insights: $2.30 billion, benchmark prices and analytics for energy and commodity markets
- Indices: $1.85 billion, asset-linked fees from running the S&P 500 and other major benchmarks
On April 28, S&P Global reported Q1 2026 revenue of $4.17 billion, up 10% year over year, with organic constant currency growth of 9%, an operating margin of 51.8%, and adjusted diluted EPS of $4.97, a 14% increase year over year. CEO Martina Cheung confirmed the company expects to return 100% or more of adjusted free cash flow to shareholders in 2026.
The market has treated the spin-off as an overhang. After it closes, SPGI will trade at 15.83x NTM EV/EBITDA, a discount to Moody’s Corporation (MCO) at 18.74x and CME Group (CME) at 22.01x per TIKR’s Competitors data. The gap to Moody’s is nearly 3 turns, despite both being among the two largest credit rating agencies globally with comparable subscription economics and margins. SPGI also generates around $5.3 billion in trailing free cash flow annually, with 23 out of 25 analysts pointing to $534 or higher.

Two Fears, and Why the Data Pushes Back
Two concerns have kept pressure on SPGI throughout 2026.
The first is the guidance miss. In February, management projected 2026 adjusted EPS of $19.40 to $19.65, below the $19.96 consensus, triggering a 17% single-day premarket decline that established the 30.73% max drawdown. Q1 2026 answered it directly: adjusted EPS came in at $4.97 against a consensus of $4.82, a 3.18% beat, with revenue beating by 2.43%. One guidance reset doesn’t define a trajectory.
The second concern is AI disruption. The bear case is that AI tools erode demand for SPGI’s data products, particularly in Market Intelligence. Jeremy Morehouse, Head of AI at Mobility Global, made the counterargument at the Investor Day: “AI is not replacing the need for a company like ours. It’s actually increasing it because all these people on this slide can’t use public AI models to make their decisions. Public AI models are trained on public data… We have decision-grade data, VIN-level data, and global data that allows us to provide these services to customers in a trustworthy way that public AI can’t do.”
That logic extends to SPGI’s core. Credit ratings, benchmark indices, and commodity pricing assessments are not products AI replicates. They become more valuable as AI workflows require validated, traceable data to function reliably.
See how S&P Global performs against its peers in TIKR (It’s free!) >>>
TIKR Advanced Model Analysis
- Current Price: $406.55
- Target Price (Mid): ~$685
- Potential Total Return: ~69%
- Annualized IRR: ~12% / year
See analysts’ growth forecasts and price targets for S&P Global stock (It’s free!) >>>
Note: this model was built on SPGI as currently constituted, including the Mobility segment. After the spin, SPGI’s financials will reflect the four retained segments only. Treat the model as a directional context for the core business.
The mid-case uses a revenue CAGR of approximately 7% through 2030, in line with management’s guided 6–8% organic growth range. The two primary revenue drivers are Ratings, which benefits from a growing debt maturity wall and normalizing issuance, and Indices, where asset-linked fees scale with equity market appreciation and continued ETF inflows.
The margin driver is operating leverage across the subscription base. SPGI’s EBITDA margin was 51.1% in 2025, with the model projecting expansion toward 53% by 2030. The primary risk is a prolonged credit market contraction, suppressing issuance and hitting Ratings revenue directly. The low case implies around 8% annualized returns through 2030. The high case implies around ~14.5% annualized returns. At 15.83x NTM EV/EBITDA and 20.05x NTM P/E, the stock is not priced for perfection.
Conclusion
The spin-off closes in mid-2026. That is the event to watch. When Mobility Global becomes independent, the overhang disappears, and the retained SPGI portfolio, which posted 51.8% operating margins and 10% revenue growth in Q1 2026, gets judged on its own terms.
Watch for a clean, on-time close. A successful separation removes the biggest source of investor anxiety and sets up multiple re-rating for the leaner core business. A delay extends the uncertainty. Twenty-three out of 25 analysts already expect the upside scenario. The TIKR model puts around 69% total return on the table through 2030 at current prices.
See what stocks billionaire investors are buying so you can follow the smart money with TIKR.
Should You Invest in S&P Global?
The only way to really know is to look at the numbers yourself. TIKR gives you free access to the same institutional-quality financial data that professional analysts use to answer exactly that question.
Pull up S&P Global, and you’ll see years of historical financials, what Wall Street analysts expect for revenue and earnings in the quarters ahead, how valuation multiples have moved over time, and whether price targets are trending up or down.
You can build a free watchlist to track S&P Global alongside every other stock on your radar. No credit card required. Just the data you need to decide for yourself.
Analyze S&P Global on TIKR Free →
Looking for New Opportunities?
- See what stocks billionaire investors are buying so you can follow the smart money.
- Analyze stocks in as little as 5 minutes with TIKR’s all-in-one, easy-to-use platform.
- The more rocks you overturn… the more opportunities you’ll uncover. Search 100K+ global stocks, global top investor holdings, and more with TIKR.
Disclaimer:
Please note that the articles on TIKR are not intended to serve as investment or financial advice from TIKR or our content team, nor are they recommendations to buy or sell any stocks. We create our content based on TIKR Terminal’s investment data and analysts’ estimates. Our analysis might not include recent company news or important updates. TIKR has no position in any stocks mentioned. Thank you for reading, and happy investing!