
Key Stats for Roku Stock
- 52-Week Range: ~$71 to ~$130
- Current Price: $124.02
- TIKR Target Price (Mid): ~$256
- TIKR Annualized IRR (Mid): ~17% per year
- Q1 2026 Total Revenue: $1.25B (up 22% YoY)
- Q1 2026 Platform Revenue: $1.13B (up 28% YoY)
- Q1 2026 Net Income: $86M (vs. -$27M a year ago)
- Q1 2026 Adjusted EBITDA: $148M (up 165% YoY)
- Streaming Hours: 38.7B (up 8% YoY)
- Active Accounts: 100M+
Value your favorite stocks like ROKU with 5 years of analysts’ forecasts using TIKR’s new Valuation Model (It’s free) >>>
Why the Ad Market Migration to Connected TV Is a Structural Tailwind for Roku
Roku (ROKU) is not primarily a hardware company, at least not anymore, as it now builds and sells streaming players and powers the operating system on tens of millions of Roku-branded smart TVs, but it sells those devices at a loss or near breakeven. The business is the platform that sits on top of the hardware.
For investors, the most important thing to know is that every time someone watches something on a Roku device, Roku earns revenue. When a viewer watches an ad-supported app, Roku captures a portion of the ad inventory.
When a viewer signs up for a paid streaming subscription through the Roku interface, Roku takes a revenue share. When a brand buys connected TV advertising through Roku’s OneView demand-side platform, Roku earns a fee. The more devices in living rooms, the more hours watched, the more revenue generated.
The structural backdrop matters here. Linear TV, where viewers watch scheduled programming on traditional cable or broadcast, has been losing viewers steadily for years. The ad dollars that followed those audiences are migrating to streaming, and that migration is still in progress. Roku sits directly in the path of that spending shift as the largest independent streaming platform in the US.
See historical and forward estimates for ROKU stock (It’s free!) >>>
What the EPS Arc Says About Operating Leverage
The EPS chart shows the full story of Roku’s investment cycle. The company was profitable in 2021 at $1.71 per share, then made a deliberate decision to invest aggressively in content, engineering, and international expansion. EPS fell to -$3.62 in 2022 as those costs hit. The company then spent 2023 and 2024 pulling back, rightsizing the cost structure, and letting platform revenue grow into the expense base. By 2025, EPS recovered to $0.60.

That is where the interesting part starts. Consensus projects around $2.40 in 2026, around $3.40 in 2027, and approaching $5 in 2028. The jump from $0.60 to $2.40 in a single year reflects operating leverage: platform revenue grew 28% while costs grew far more slowly. Once a streaming platform reaches Roku’s scale, incremental revenue flows through at very high margins because the infrastructure is already built and paid for.
Q1 2026 confirmed this is happening in real time. Platform revenue grew 28% to $1.13 billion, with a gross margin of 51.6%. Advertising revenue grew 27% to $613 million. Subscriptions grew 30% to $519 million. Roku also broke out these two segments separately for the first time in Q1 2026, giving investors cleaner visibility into each revenue stream.
See what analysts think about ROKU stock right now (Free with TIKR) >>>
Why the Free Cash Flow Chart Is the Proof Point
The FCF chart shows the investment cycle and its resolution in a single visual. Roku generated $188 million in FCF in 2021, burned $150 million in 2022 during peak spending, recovered to $173 million in 2023, grew to $213 million in 2024, then jumped to $478 million in 2025 as the cost structure normalized and platform revenue accelerated. Trailing 12-month free cash flow has now risen to $538.8 million following Q1 2026.
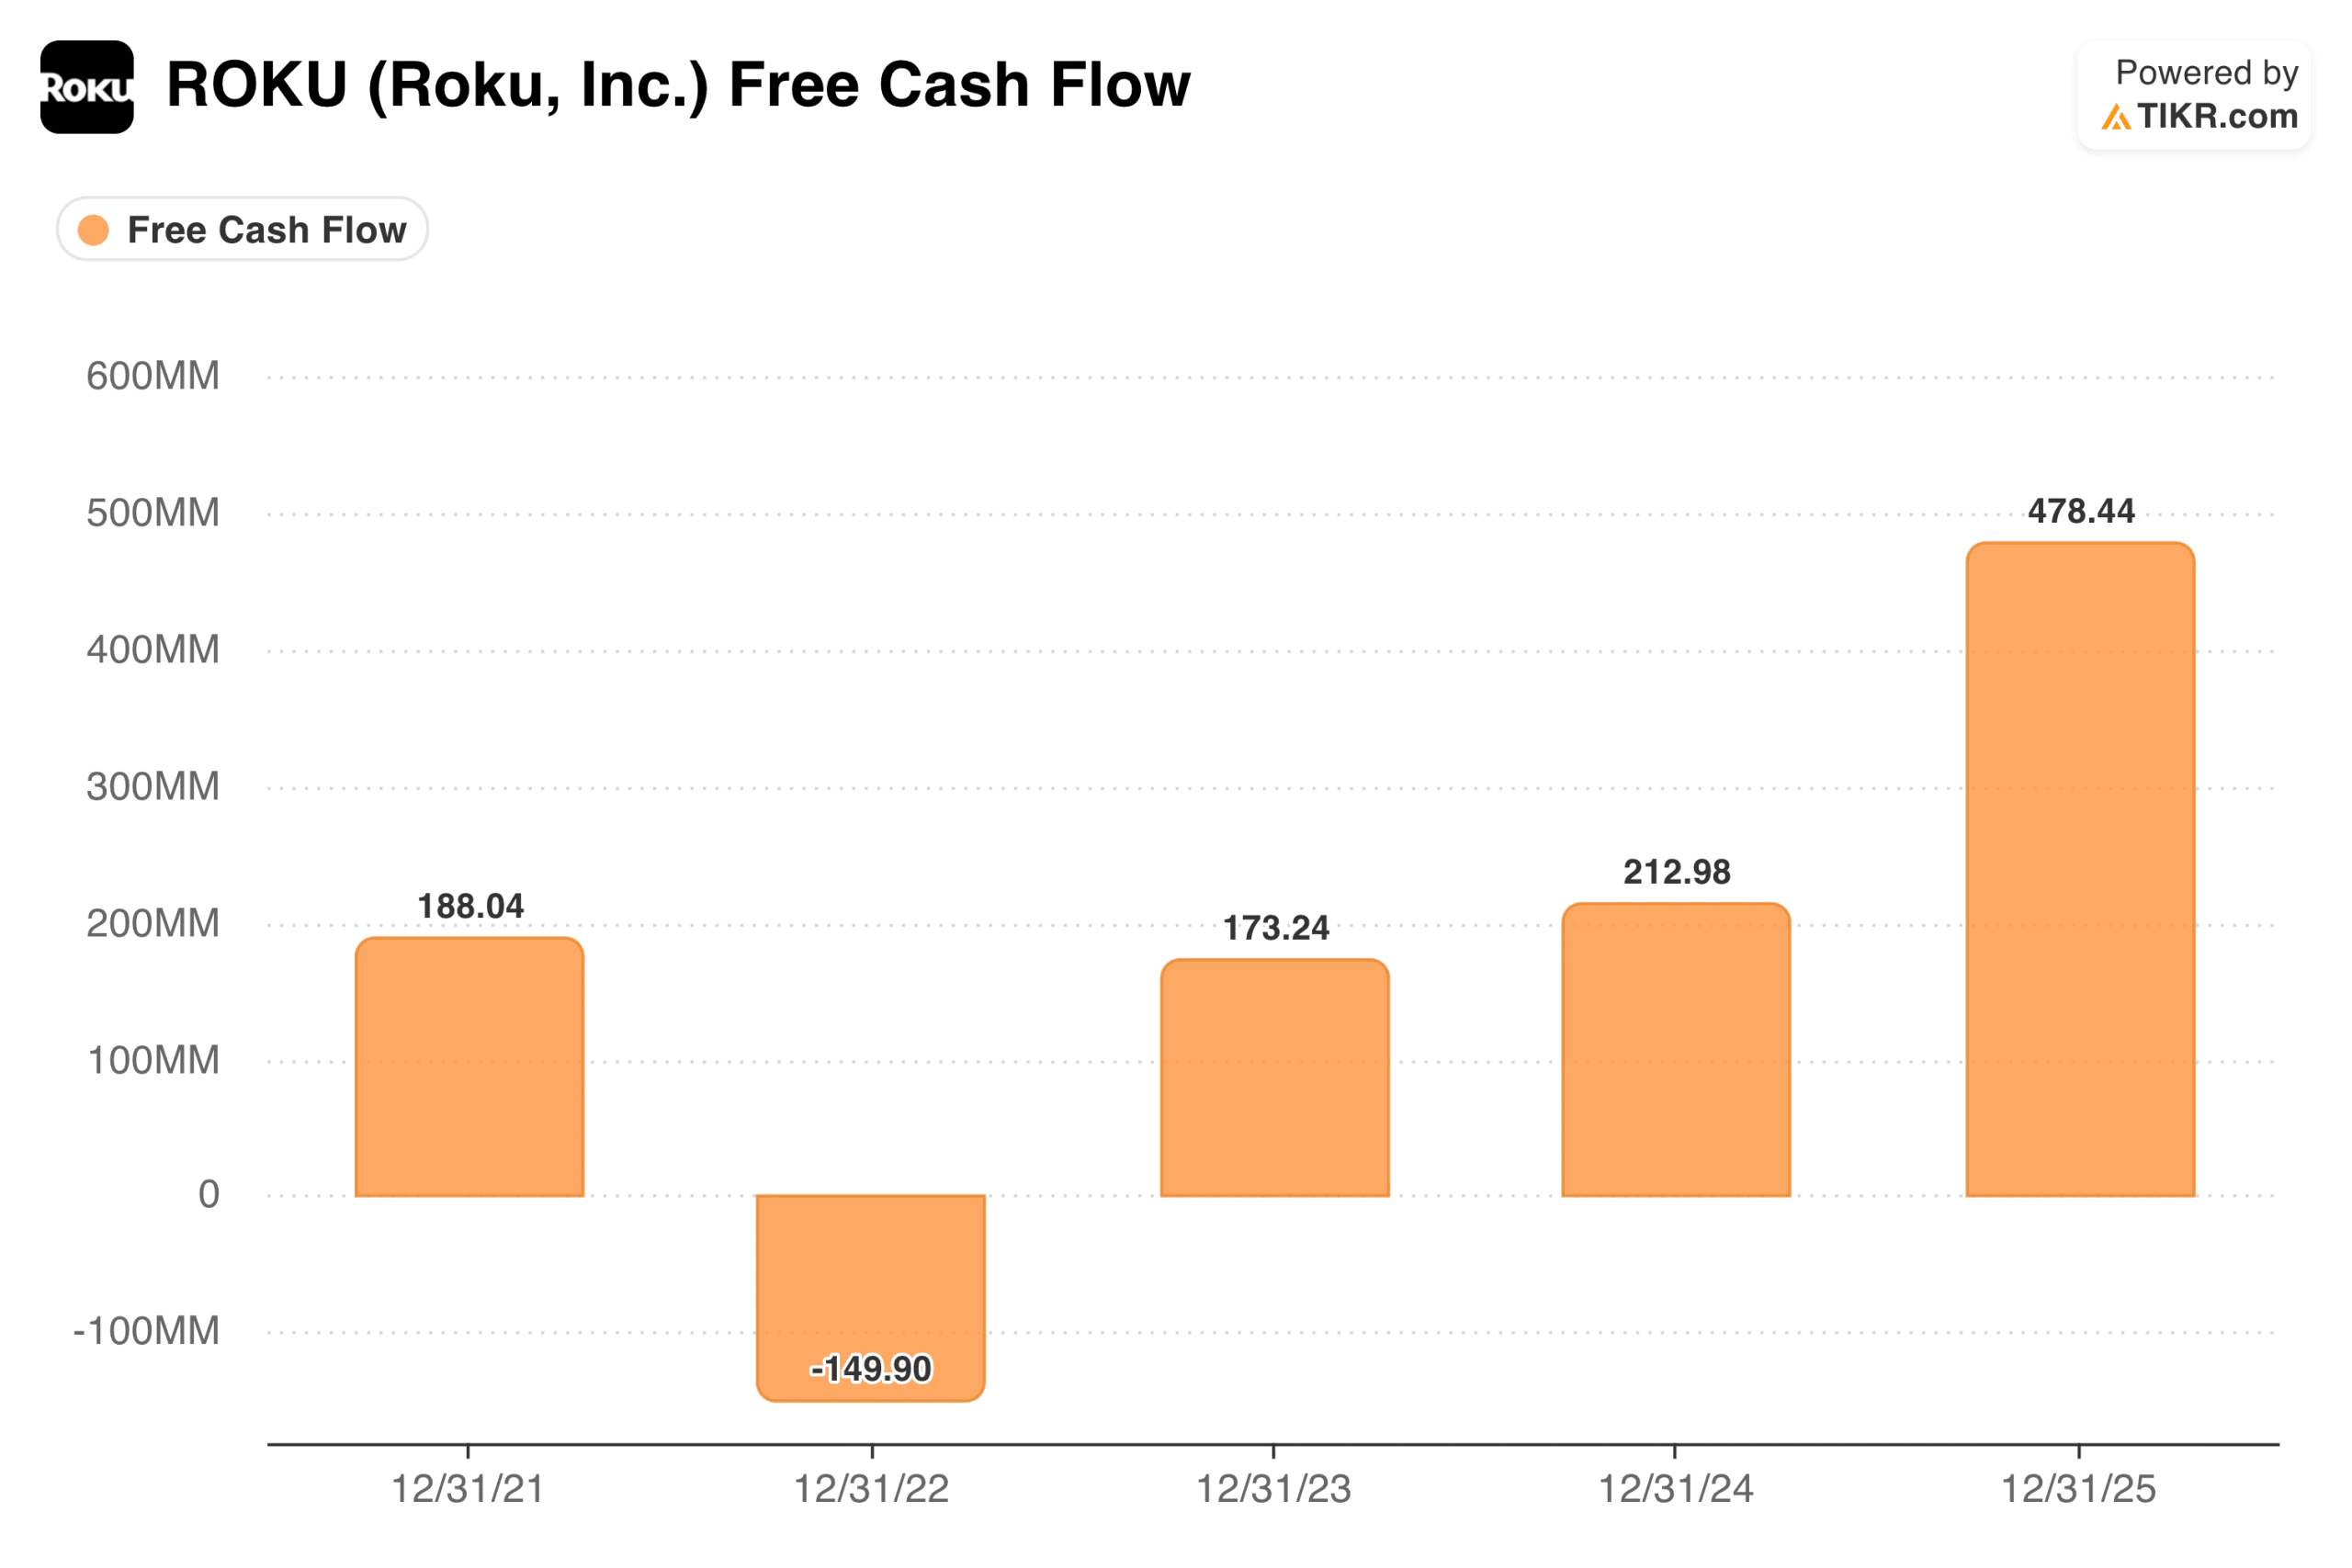
This matters for a specific reason. Roku has been criticized for years for growing revenue without generating cash. That criticism is no longer accurate. A company with 100 million active accounts, $5.5 billion in full-year revenue guidance, and $539 million in trailing FCF is a fundamentally different financial profile than the Roku that burned $150 million in 2022.
What the TIKR Model Implies at $124
The TIKR model targets around $256 per share in the mid case, implying a total return of roughly 107% over about 4.6 years, or about 17% annually. The model uses revenue growth of around 11% per year, net income margins of around 9%, and EPS growth of around 29% annually as the cost structure continues to leverage the platform revenue base.
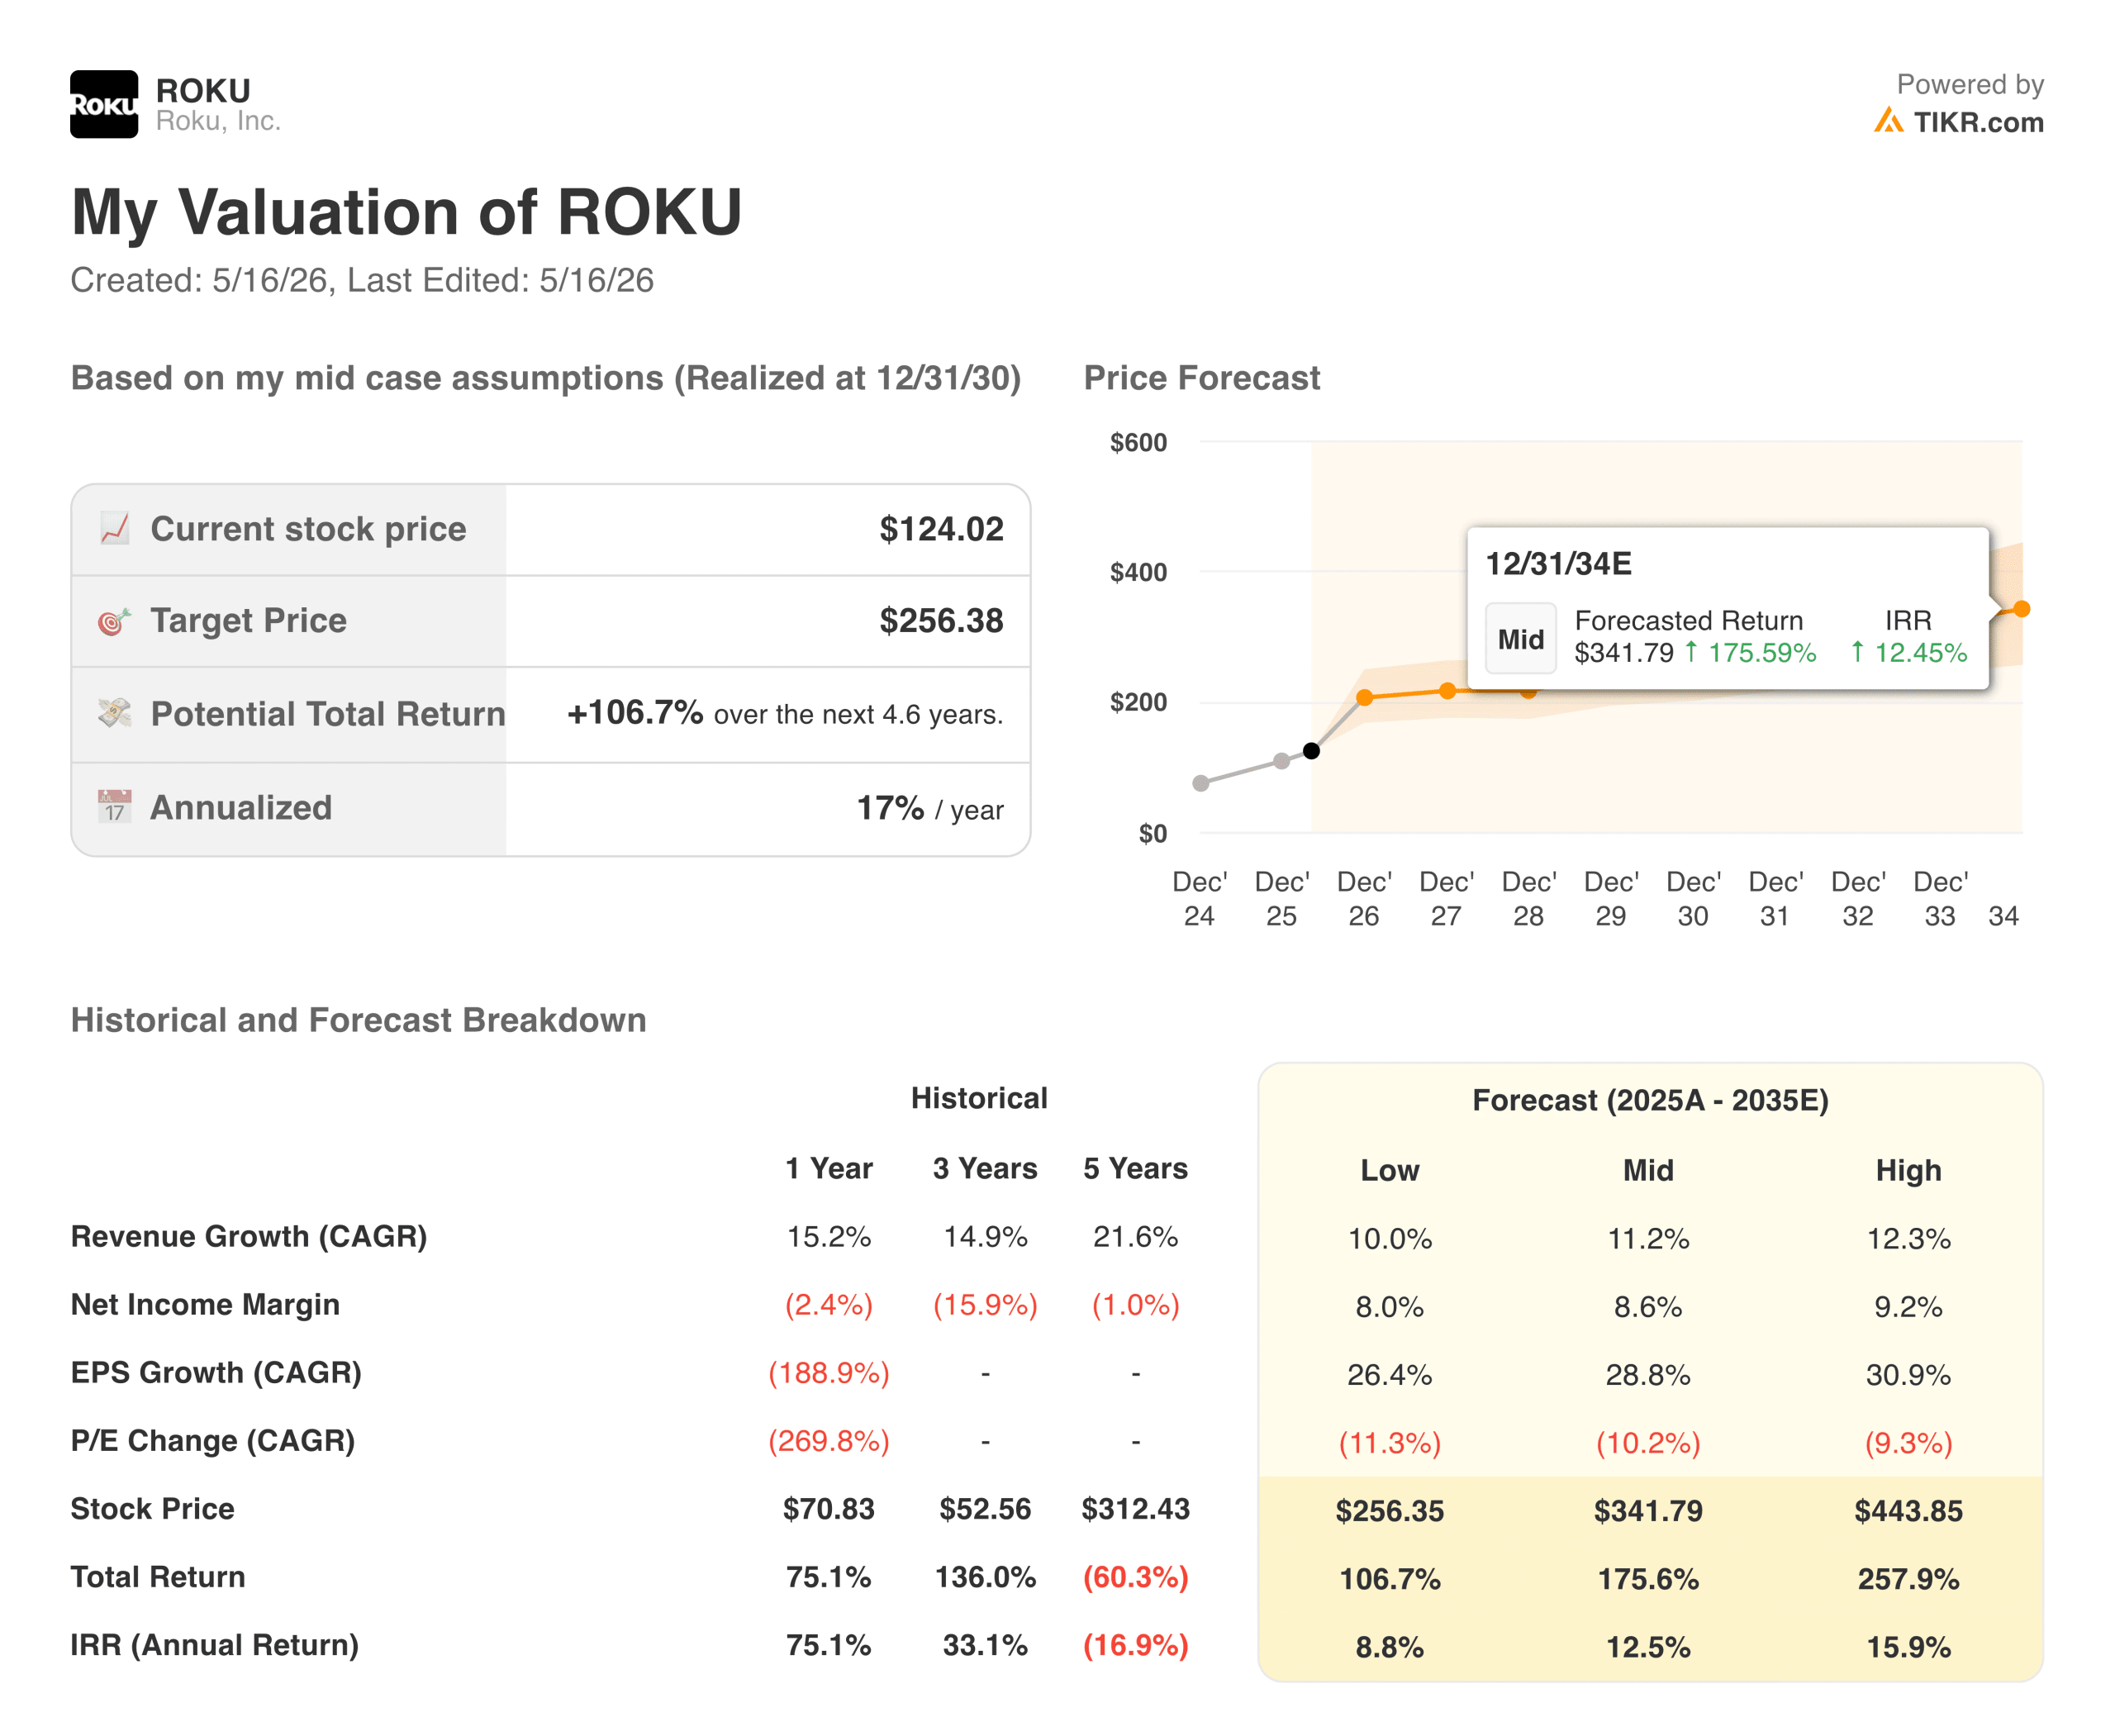
The low case targets around $256 at roughly 9% per year. The high case reaches around $444 at roughly 16% annually. Unlike situations where the stock looks fairly valued in the mid-case, the TIKR model implies meaningful upside across all three scenarios relative to the current price.
What Could Drive the Returns Higher or Lower
The advertising business is the primary engine, and it is growing and becoming more defensible. The Roku Channel ranks as the number two free ad-supported streaming app by usage in the US, behind only YouTube. That position earns advertising revenue without paying content licensing fees, the way Netflix or Disney+ must.
The subscription side at $519 million in Q1 alone is growing 30% year over year, and Roku recently added Apple TV in March and announced Peacock as a new tier-one subscription partner. International is the long-term growth lever that is not yet reflected in the numbers in any meaningful way.
The risk is that platform revenue is advertising-heavy, and advertising is cyclical. If economic conditions weaken and brands cut their marketing budgets, Roku’s growth rate will moderate quickly. The 2022 experience showed how fast the business can deteriorate when ad spending contracts.
Competition from Amazon Fire TV and Google TV remains real, and the major streaming services have been investing in their own ad products, which could reduce the inventory flowing through Roku’s platform over time.
Is ROKU Worth Buying at $124?
Roku is the dominant connected TV operating system in America, generating $539 million in trailing free cash flow and growing platform revenue at 28%. The business that burned $150 million in cash four years ago is now a genuinely profitable platform with operating leverage clearly visible in the numbers.
The TIKR mid case of around $256 at roughly 17% annually is a compelling return if the ad market migration continues and the subscription flywheel keeps scaling. The EPS trajectory from $0.60 in 2025 to an estimated $2.40 this year, and to approaching $6 by 2030, reflects what happens when a platform business reaches scale and starts converting growth into earnings. At $124, the stock is pricing in a scenario well below what the numbers currently suggest the business can deliver.
See analysts’ growth forecasts and price targets for ROKU stock (It’s free!) >>>
Looking for New Opportunities?
- See what stocks billionaire investors are buying so you can follow the smart money.
- Analyze stocks in as little as 5 minutes with TIKR’s all-in-one, easy-to-use platform.
- The more rocks you overturn… the more opportunities you’ll uncover. Search 100K+ global stocks, global top investor holdings, and more with TIKR.
Disclaimer:
Please note that the articles on TIKR are not intended to serve as investment or financial advice from TIKR or our content team, nor are they recommendations to buy or sell any stocks. We create our content based on TIKR Terminal’s investment data and analysts’ estimates. Our analysis might not include recent company news or important updates. TIKR has no position in any stocks mentioned. Thank you for reading, and happy investing!