

Key Takeaways:
- Xometry reported Q1 FY26 revenue of $205 million, up 36% year over year, with adjusted EBITDA of $10.5 million beating the analyst estimate of $7.2 million by a wide margin.
- Siemens invested $50 million in Xometry on May 7, 2026, and the company announced a CEO transition with Sanjeev Singh Sahni taking the top role. XMTR stock trades at $79, near its 52-week high of $82, and the analyst consensus price target is $70.
- Based on our near term valuation assumptions, XMTR stock could move from $79 to around $80 per share by December 2028, implying around 1% annualized returns and suggesting the market may have already priced in strong execution.
What Happened?
Xometry, Inc. (XMTR) delivered its strongest quarterly performance yet in Q1 FY26 and paired it with two major announcements. Revenue jumped 36% year over year to $205 million. Net loss narrowed 65% to $5.3 million. Adjusted EBITDA came in at $10.5 million, beating analyst estimates of $7.2 million and signaling growing operating efficiency.
The company also announced that Siemens invested $50 million in newly issued Xometry shares on May 7, 2026. This is a significant validation of Xometry’s AI-powered manufacturing marketplace from one of the world’s largest industrial companies.
Xometry operates a platform that connects buyers needing custom parts with a network of manufacturing suppliers. Its technology automates quoting, ordering, and fulfillment across machining, 3D printing, and fabrication.
A CEO succession plan was also announced alongside the earnings. Sanjeev Singh Sahni, who joined as President in January 2025, will become CEO. Founder Randy Altschuler will transition to Executive Chair. This leadership shift signals a move toward scaling and profitability rather than pure growth. Investors viewed both announcements as meaningful positive catalysts.
But the stock surged 39% in a single trading session on May 7, 2026, pushing the price well above the analyst consensus target of $70. The market is now pricing in very strong execution across a highly ambitious growth plan. Xometry still operates at a loss and trades at a very high valuation multiple.
Here’s why Xometry stock could deliver very different outcomes depending on how well the business executes on its path to profitability.
What the Model Says for XMTR Stock
We analyzed the upside potential for Xometry stock based on its AI-powered marketplace growth, the path toward operating profitability, and the expanding total addressable market in custom manufacturing.
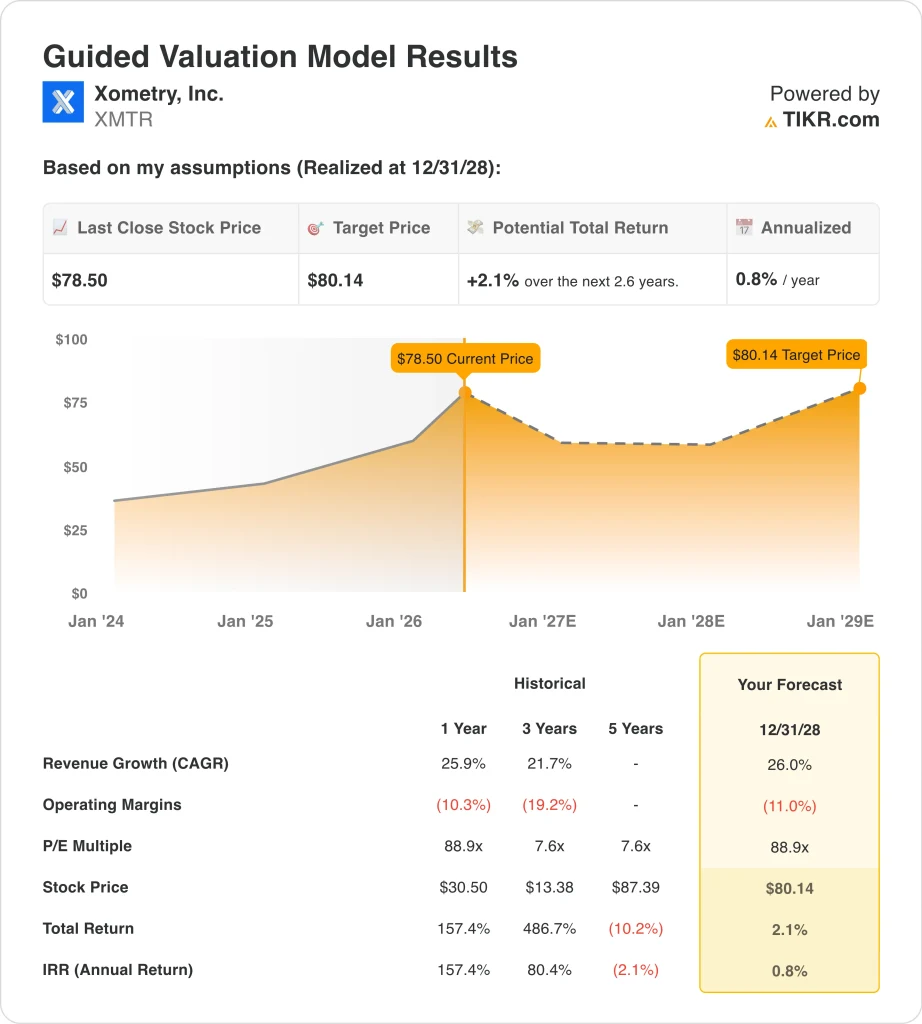
Based on estimates of around 26% annual revenue growth, around negative 11% operating margins, and a normalized P/E multiple of 88.9x, the model projects Xometry stock could rise from $79 to around $80 per share.
That would be a total return of around 2%, or an annualized return of around 1% over the next 2.6 years.
Our Valuation Assumptions
TIKR’s Valuation Model lets you plug in your own assumptions for a company’s revenue growth, operating margins, and P/E multiple, and calculates the stock’s expected returns.
Here’s what we used for XMTR stock:
1. Revenue Growth: 26%
Xometry grew revenue at around 25.9% over the past year. The company has consistently expanded its marketplace by adding suppliers and buyers across North America and Europe. Q1 FY26’s 36% year over year growth accelerated above that recent trend.
Management raised its full-year revenue growth outlook after Q1 results. The Siemens investment adds a strategic enterprise partnership that could accelerate adoption among large industrial buyers. New AI-powered tools like the enterprise machining lead time prediction model also support faster buyer conversion.
Based on analysts’ consensus estimates, we used a forecast of around 26% annual revenue growth. This reflects strong marketplace momentum balanced against the risk of growth normalization as the platform matures.
2. Operating Margins: -11%
Xometry continues to operate at a loss. The trailing annual operating margin is approximately negative 10%. The company is investing heavily in technology, sales, and supplier network expansion. These investments are necessary to scale the marketplace but compress near-term margins.
Adjusted EBITDA of $10.5 million in Q1 FY26 shows that profitability is within reach at the operating level. But GAAP profitability will require continued scale and cost discipline. The CEO transition signals a strategic focus on operational efficiency going forward.
Based on analysts’ consensus estimates, we used an operating margin of around negative 11%. This reflects the current investment phase and acknowledges that profitability will take time to materialize at a meaningful scale.
3. Exit P/E Multiple: 88.9x
Xometry currently trades at a deeply negative trailing price to earnings ratio because the company has not yet reached profitability. The implied forward P/E of 88.9x is based on modeled future earnings when profitability is eventually achieved. This makes the stock highly sensitive to changes in both growth expectations and the timing of profitability.
High-growth technology companies often trade at elevated multiples before profitability. But those multiples compress sharply if growth disappoints or if investors lose patience. Xometry’s valuation requires belief in a large and durable custom manufacturing marketplace opportunity.
Based on analysts’ consensus estimates, we used an exit P/E of 88.9x. This reflects the growth premium currently assigned to Xometry but also highlights the significant execution risk embedded in the current stock price.
Build your own Valuation Model to value any stock (It’s free!) >>>
What Happens If Things Go Better or Worse?
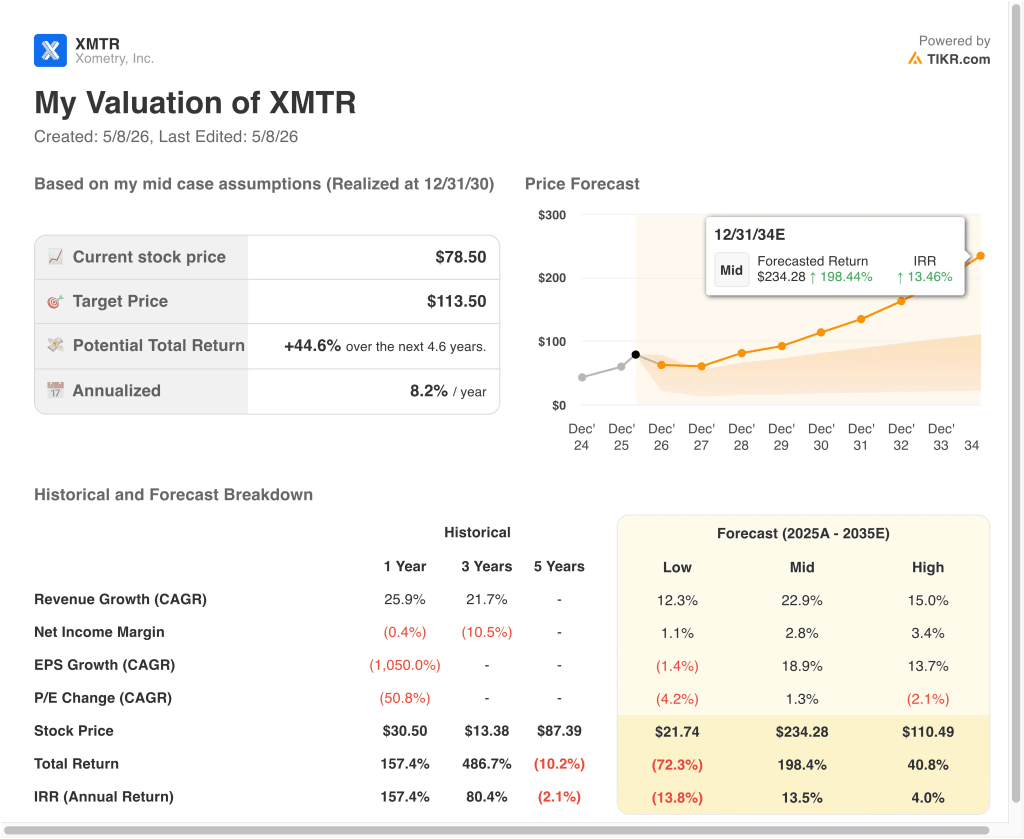
Different scenarios for XMTR stock through 2034 show highly varied outcomes based on revenue growth and the pace of margin improvement (these are estimates, not guaranteed returns):
- Low Case: Revenue growth falls short of targets and valuation multiples compress sharply → around -14% annual returns
- Mid Case: Marketplace accelerates to around 23% growth and margins improve steadily → around 14% annual returns
- High Case: Revenue grows around 15%, but valuation normalizes downward → around 4% annual returns
Going forward, Xometry’s Q1 results and the Siemens investment represent meaningful validation of the company’s model. But the stock’s 39% single session surge has pushed the valuation well above levels that reflect a balanced risk-reward.
The wide range of outcomes in the model reflects the binary nature of high growth, pre-profitability investing, and requires conviction in long-term execution from new management.
See what analysts think about XMTR stock right now (Free with TIKR) >>>
Should You Invest in Xometry?
The only way to really know is to look at the numbers yourself. TIKR gives you free access to the same institutional-quality financial data that professional analysts use to answer exactly that question.
Pull up XMTR, and you’ll see years of historical financials, what Wall Street analysts expect for revenue and earnings in the quarters ahead, how valuation multiples have moved over time, and whether price targets are trending up or down.
You can build a free watchlist to track XMTR alongside every other stock on your radar. No credit card required. Just the data you need to decide for yourself.
Analyze the stock on TIKR Free→
Looking for New Opportunities?
- See what stock billionaire investors are buying so you can follow the smart money.
- Analyze stocks in as little as 5 minutes with TIKR’s all-in-one, easy-to-use platform.
- The more rocks you overturn… the more opportunities you’ll uncover. Search 100K+ global stocks, global top investor holdings, and more with TIKR.
Disclaimer:
Please note that the articles on TIKR are not intended to serve as investment or financial advice from TIKR or our content team, nor are they recommendations to buy or sell any stocks. We create our content based on TIKR Terminal’s investment data and analysts’ estimates. Our analysis might not include recent company news or important updates. TIKR has no position in any stocks mentioned. Thank you for reading, and happy investing!


