

Key Stats for Apollo Global Stock
- Current Price: $129.53
- Target Price (Mid): ~$343
- Street Target: ~$138 (mean of 16 price target estimates)
- Potential Total Return: ~165%
- Annualized IRR: ~23% / year
- Earnings Reaction: +2.85% premarket (May 6, 2026)
Now Live: Discover how much upside your favorite stocks could have using TIKR’s new Valuation Model (It’s free) >>>
What Happened?
Apollo Global Management (APO) rose 2.85% in premarket trading on May 6 after posting record fee earnings and crossing $1 trillion in assets under management. Yet the stock still sits about 18% below its 52-week high of $157.28. Bulls say the underlying business is running well ahead of what the current multiple implies. Bears point to an ongoing securities class action and lingering pressure in the retail private credit channel. The central question: do Q1 results give the recovery thesis a durable foundation, or does the reputational discount stay embedded in the price?
The numbers made a strong case for the former.
What the Quarter Delivered
Apollo’s investor relations page showed Q1 2026 fee-related earnings (FRE, the recurring management fee income Apollo earns from its funds) of $728 million, up 30% year-over-year and 6% quarter-over-quarter. That was a new quarterly record. Spread-related earnings (SRE, the profit Apollo’s insurance subsidiary Athene earns on the difference between its investment returns and the cost of its insurance liabilities) came in at $719 million. Together they produced adjusted net income of $1.21 billion, or $1.94 per share, beating the $1.88 consensus estimate.
The GAAP headline showed a net loss of $3.27 per share, driven entirely by a $1.7 billion one-time tax charge linked to new guidance under Bermuda’s Corporate Income Tax Act of 2023. Analysts treated it as non-recurring, and the premarket rally confirmed investors did too.
Management reaffirmed its full-year 2026 guidance: 20%+ FRE growth and 10% SRE growth.
The $1 Trillion Story
Fee-generating AUM grew 40% year-over-year, which directly drives FRE. Martin Kelly, CFO, called the $1.03 trillion AUM figure “a significant milestone in the context of trust that our clients continue to place in us.”
Capital formation of $115 billion for the quarter broke into $65 billion from the closing of the Pension Insurance Corporation (PIC) acquisition through Athora (Apollo’s European insurance platform), and $50 billion of organic inflows. Of that organic total, asset management contributed $30 billion and Athene $20 billion.
Origination, the deal sourcing engine that feeds Athene’s balance sheet and generates capital solutions fees, hit $71 billion, up 25% year-over-year. The average spread was 350 basis points over Treasuries with an average BBB credit rating.
Capital solutions fees (ACS fees) came in at $246 million, the fourth straight quarter above $200 million, spanning approximately 90 discrete transactions. Two deals illustrated the scale. Apollo provided a $19 billion bridge commitment for Paramount’s acquisition of Warner Bros. and led two AI data center financings totaling more than $8 billion, both structured with investment-grade counterparty risk.
James Zelter, President of Apollo, framed the AI opportunity directly: “Across the 5 primary hyperscalers, CapEx investment of AI infrastructure is estimated to exceed $800 billion this year and almost $1 trillion next year.” Apollo is not making equity bets on individual companies. It is acting as a structured investment-grade lender to the infrastructure that hyperscalers are building.
Holding Up Where Others Didn’t
Q1 2026 was a genuinely rough quarter for markets. The S&P 500 fell 17%. The Russell 2000 dropped 16%. Levered private equity strategies were down more than 20%. Apollo’s alternatives portfolio returned 6% for the quarter, anchored by its AAA fund, which now manages more than $27.5 billion and has generated 12% net returns since inception.
Marc Rowan, Chairman and CEO, was direct about what that means: “We were up 6% for the quarter. While this is not in line with our long-term expectations, this is not a miss. This is entirely how we invest.”
At Athene, net spread came in at 97 basis points for the quarter, below management’s 120 to 125 basis point full-year target. Two non-recurring items explain the gap: an impairment at Atlas and a mark-to-market impact from Athora’s capital raise for PIC. Adjusting for both, the spread would have been approximately 25 basis points higher, squarely within the guidance range. Athene’s net investment assets grew to $300 billion, up 14% year-over-year, with approximately $40 billion held in cash and Treasuries as deliberate defensive dry powder.

See historical and forward estimates for Apollo Global stock (It’s free!) >>>
The Discount That Remains
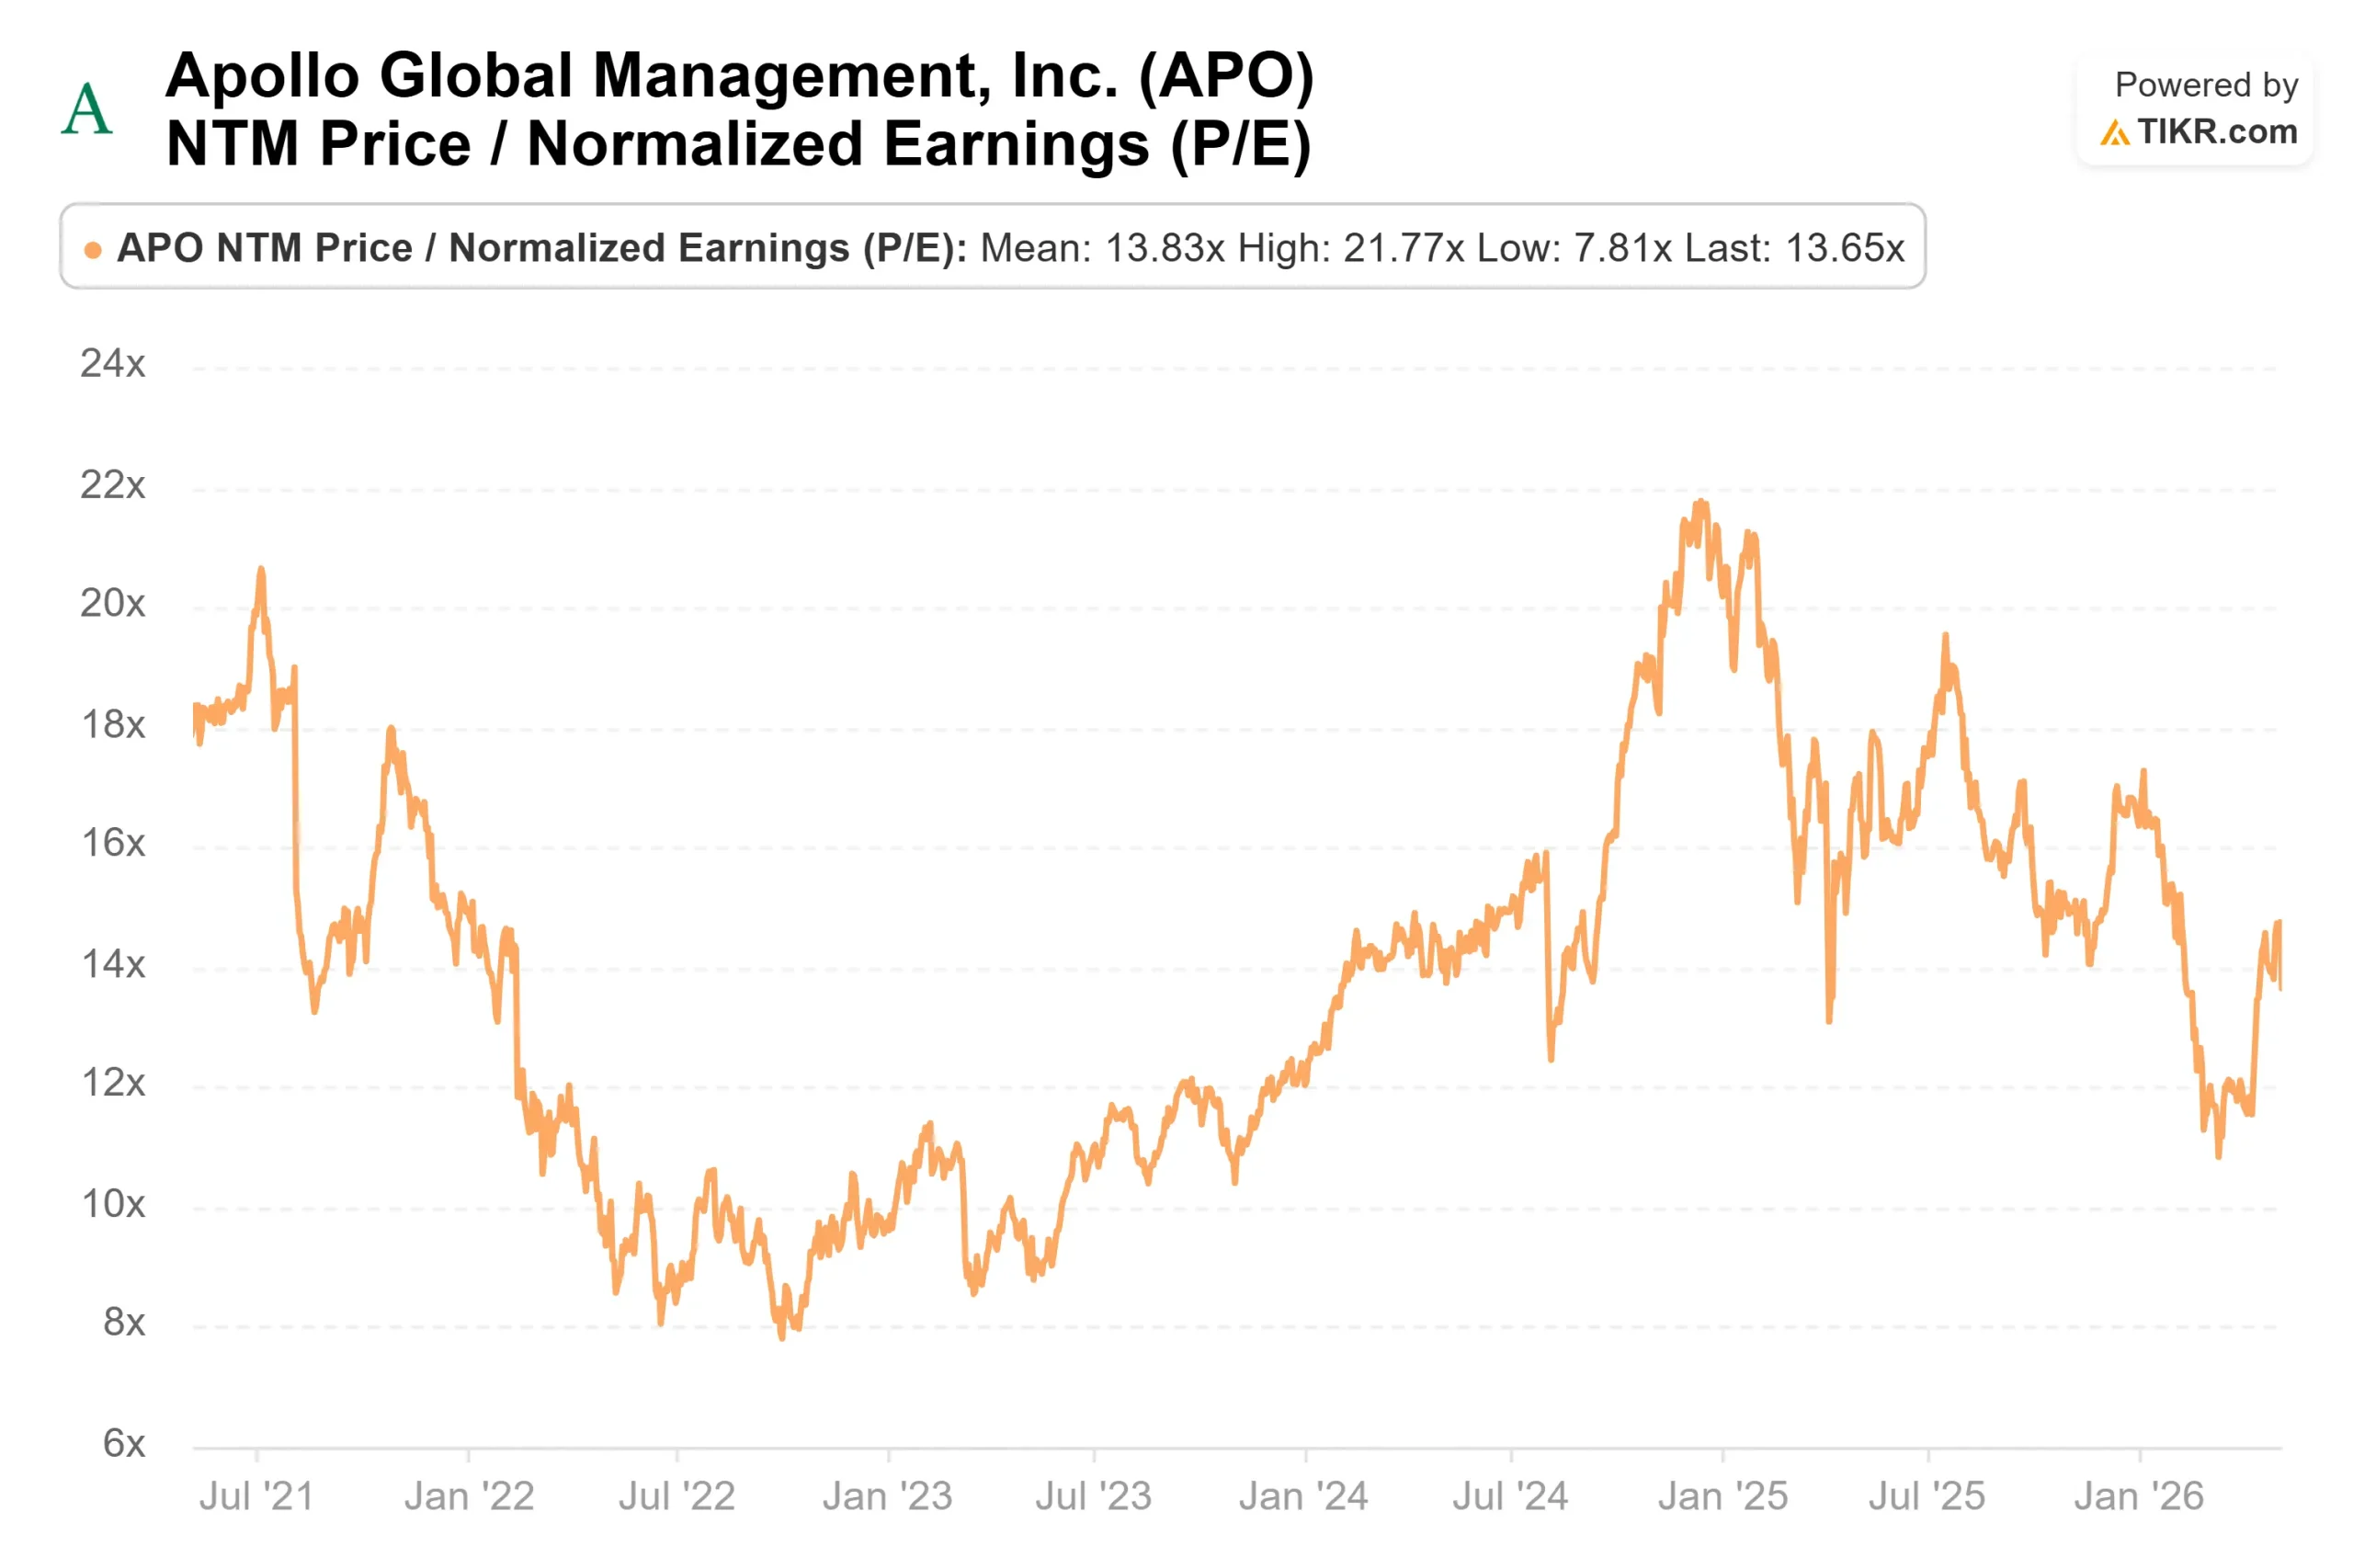
The valuation question is why a firm posting 30% FRE growth trades at 13.65x next twelve months earnings rather than the 16x to 17x it commanded through most of 2025. The answer is specific.
In early February 2026, the Financial Times reported that CEO Marc Rowan and other executives had held discussions with Jeffrey Epstein regarding Apollo’s tax arrangements in the 2010s. On February 21, after CNN published related commentary, the stock fell approximately 5% in a single session. The cumulative damage drove APO to a max drawdown of 35.73% on March 12, falling from its 52-week high of $157.28 to a low of $99.56. A securities class action, Feldman v. Apollo Global Management, Inc., No. 1:26-cv-01692, was filed in the Southern District of New York. The lead plaintiff deadline passed on May 1, 2026.
The complaint centers on historical disclosure practices, not Apollo’s credit portfolio or Athene’s financials. But reputational risk affects institutional allocator behavior, and that is where the multiple compression has lived.
What Q1 changed is the weight of evidence on the operating side. Apollo Debt Solutions (ADS), Apollo’s retail private credit BDC (business development company) that faced elevated redemption pressure earlier in 2026, saw 94% of investors submit no redemption request in Q1. Net flows for ADS were flat, and preliminary April performance came in at approximately positive 80 basis points. The retail channel is stabilizing.
Forward revenues are expected to grow at around 18% annually over the next two years, per TIKR consensus. The earnings surprises across the past four quarters on an adjusted EPS basis have all been positive. The operating engine is not slipping. Rowan assessed the macro risk on the call, putting the probability of a disruptive out-of-consensus event at 65-35 to 70-30 against normal outcomes. Apollo’s response is to hold investment grade, keep software exposure across all credit buckets below 2%, and maintain the $40 billion Athene cash cushion.
See how Apollo Global performs against its peers in TIKR (It’s free!) >>>
TIKR Advanced Model Analysis
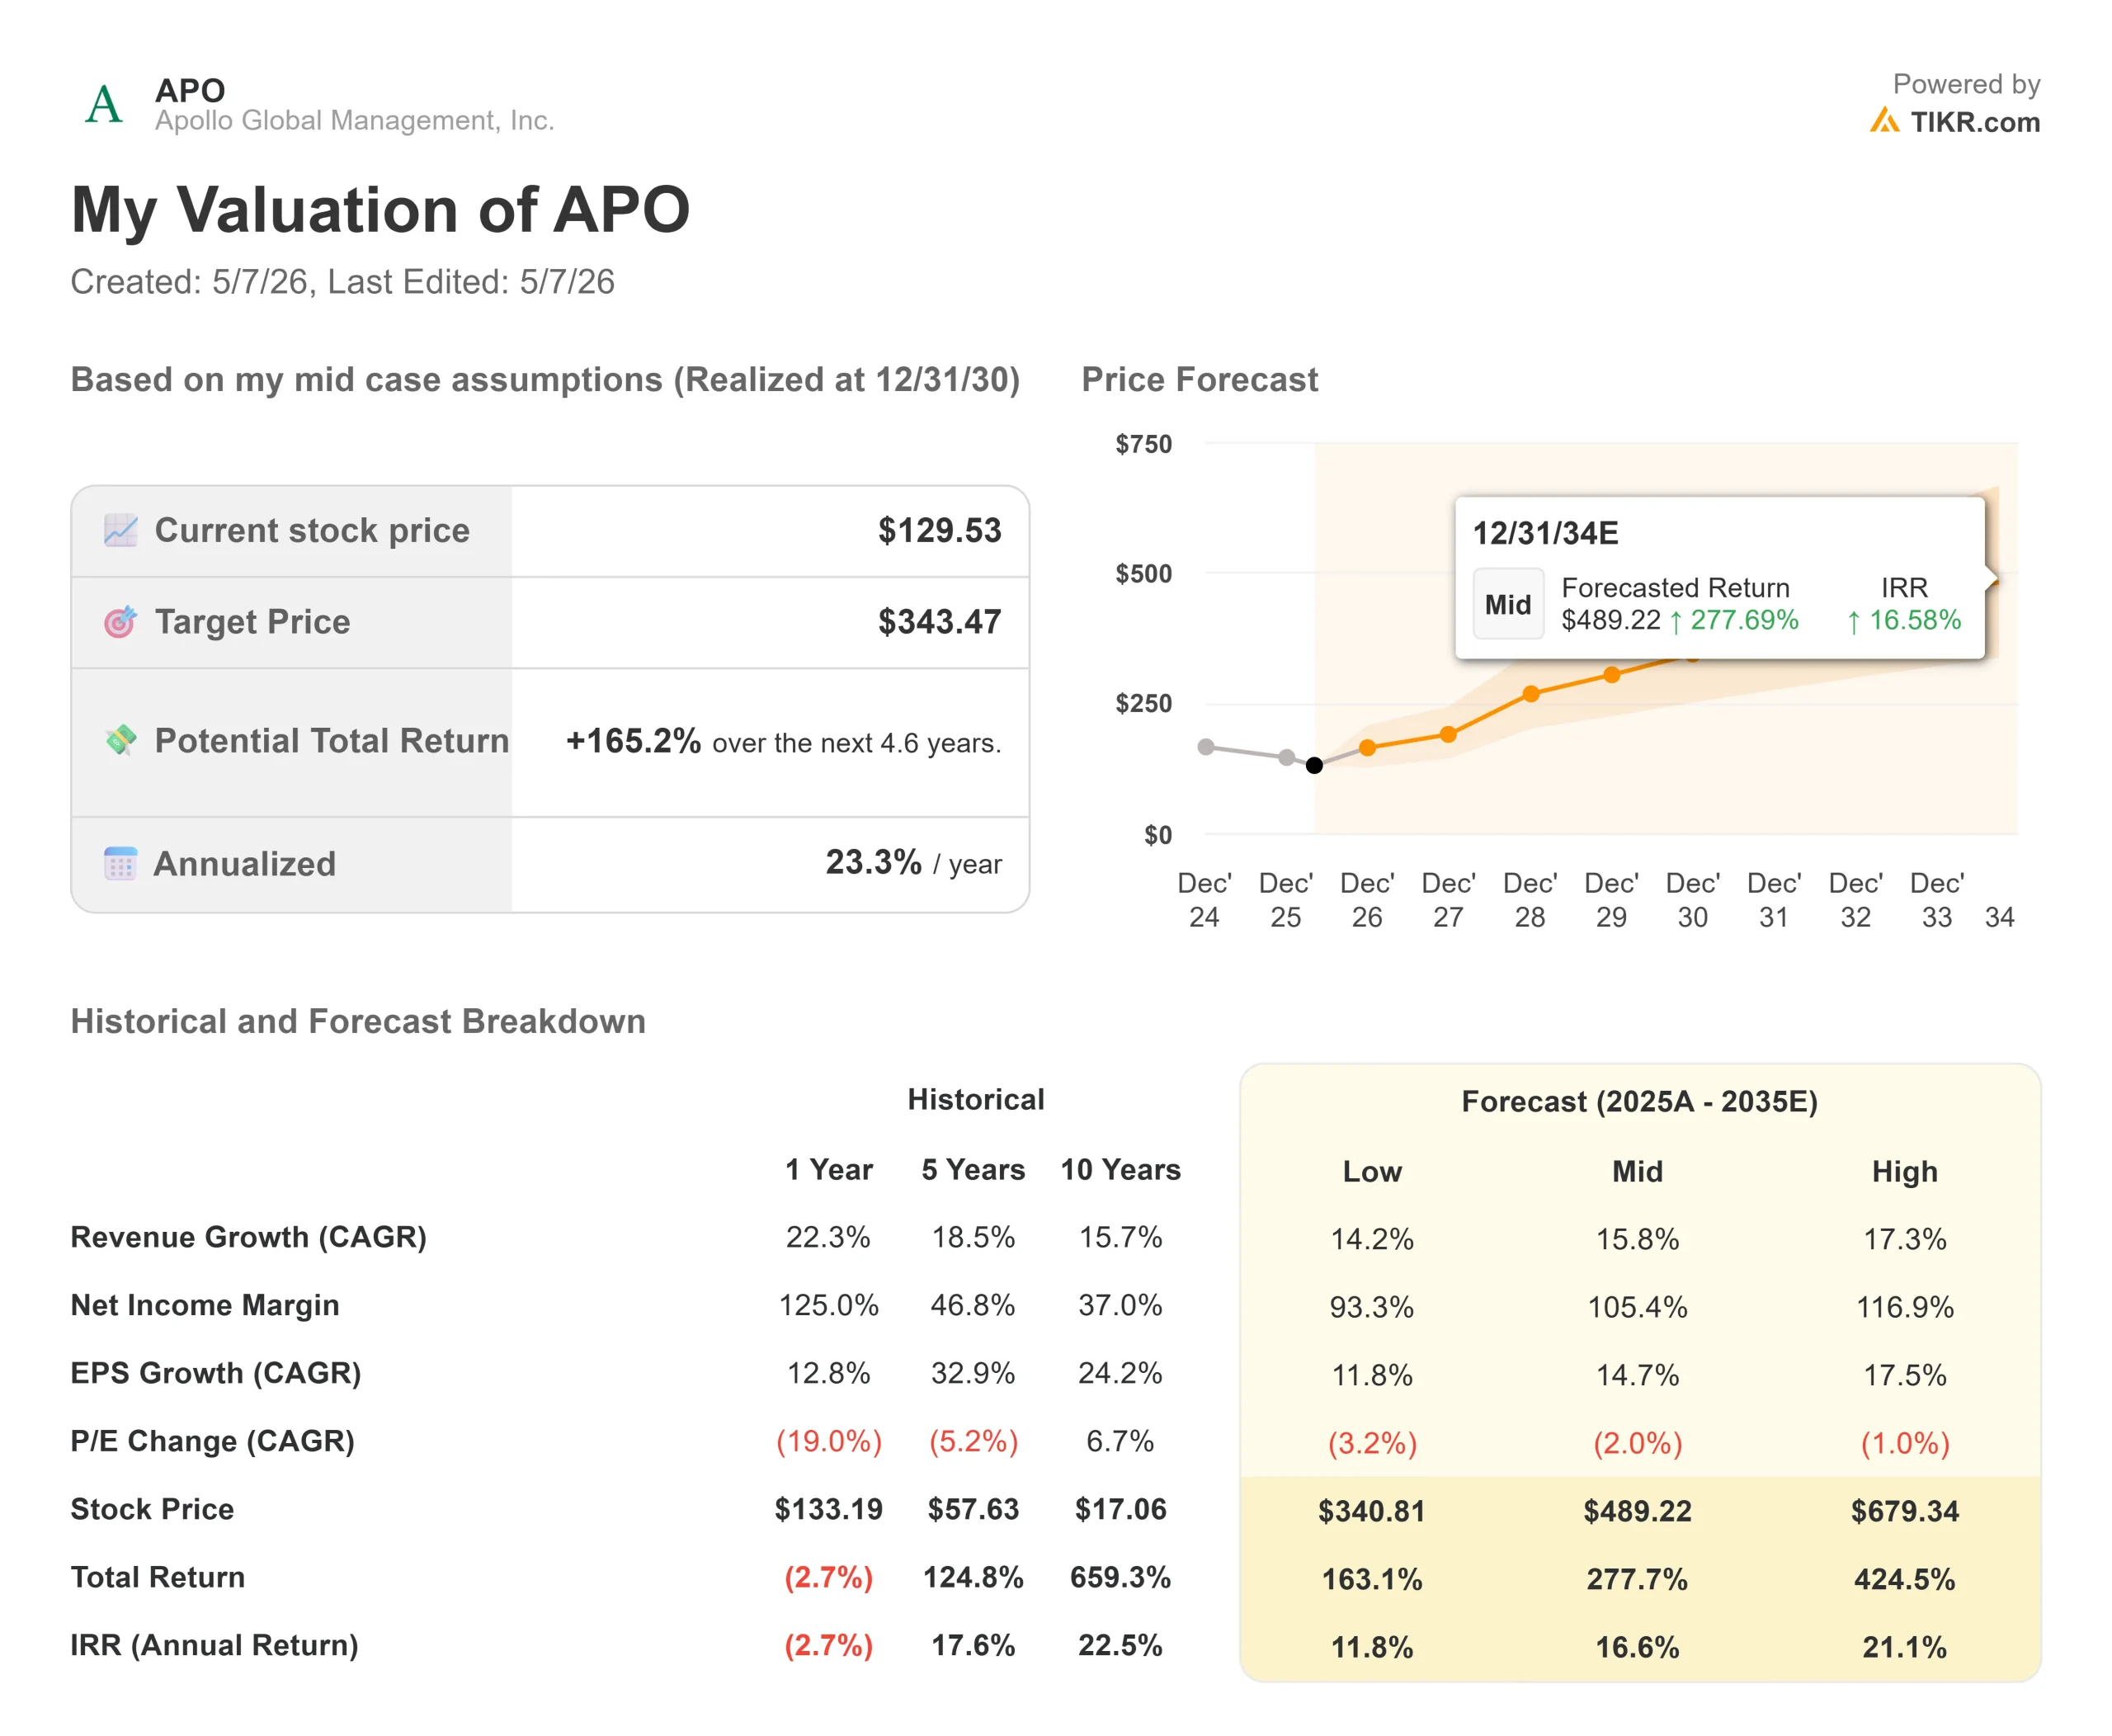
- Current Price: $129.53
- Target Price (Mid): ~$343
- Potential Total Return: ~165%
- Annualized IRR: ~23% / year
See analysts’ growth forecasts and price targets for Apollo Global stock (It’s free!) >>>
The mid-case assumes around 16% annual revenue CAGR. The two primary growth drivers are fee-generating AUM expansion as origination scales across credit, equity, and hybrid strategies, and continued organic inflow growth at Athene as new channels, including stable value, structured settlements, and the U.K. pension market, through PIC ramp up. The margin driver is FRE operating leverage: the FRE margin reached 58% in Q1 2026 and is expected to expand as revenues scale faster than expenses.
The primary risk is a credit cycle severe enough to sustain a net spread below 120 basis points at Athene. A secondary risk is that the legal overhang impairs fundraising momentum before the multiple can normalize. The high case assumes the legal narrative fades, the wealth channel recovers, and revenue CAGR accelerates toward 17% annually. The low case assumes revenue growth of around 14% annually with margin pressure from a weaker SRE recovery.
This article uses the mid-case because it aligns most closely with management’s own 2026 guidance and the trajectory Q1 demonstrated.
Conclusion
Watch the net spread at Athene in Q2 2026 results. Management guided for 120 to 125 basis points for the full year, and Q1 came in at 97 basis points due to two non-recurring items. If Q2 spreads normalize back toward that range as prepayment headwinds dissipate and the AMAPS pipeline (Apollo’s new multi-asset structured product replacing CLO exposure on Athene’s balance sheet) continues to grow, the SRE re-rating case becomes material. Q1 confirmed the fee engine is intact and the $1 trillion milestone is real. What happens to net spread in Q2 will tell investors whether the recovery has a second leg.
See what stocks billionaire investors are buying so you can follow the smart money with TIKR.
Should You Invest in Apollo Global?
The only way to really know is to look at the numbers yourself. TIKR gives you free access to the same institutional-quality financial data that professional analysts use to answer exactly that question.
Pull up Apollo Global, and you’ll see years of historical financials, what Wall Street analysts expect for revenue and earnings in the quarters ahead, how valuation multiples have moved over time, and whether price targets are trending up or down.
You can build a free watchlist to track Apollo Global alongside every other stock on your radar. No credit card required. Just the data you need to decide for yourself.
Analyze Apollo Global on TIKR Free →
Looking for New Opportunities?
- See what stocks billionaire investors are buying so you can follow the smart money.
- Analyze stocks in as little as 5 minutes with TIKR’s all-in-one, easy-to-use platform.
- The more rocks you overturn… the more opportunities you’ll uncover. Search 100K+ global stocks, global top investor holdings, and more with TIKR.
Disclaimer:
Please note that the articles on TIKR are not intended to serve as investment or financial advice from TIKR or our content team, nor are they recommendations to buy or sell any stocks. We create our content based on TIKR Terminal’s investment data and analysts’ estimates. Our analysis might not include recent company news or important updates. TIKR has no position in any stocks mentioned. Thank you for reading, and happy investing!


