


Key Takeaways for Robinhood Stock as of July 2026
- Across-the-Board Beat: Robinhood posted Q2 revenue of $1.31B, up 32.25% YoY and 22.59% QoQ, beating estimates by 2%, and adjusted EPS of $0.61 cleared Street’s $0.55 estimate by 12.40%.
- Cost Guide Cut: New 2026 range: $2.675B to $2.775B for adjusted OpEx and SBC.
- Margin Divergence: EBITDA margin expanded 660bps QoQ to 56.65%, beating Street’s 49.15% estimate by 750bps, even as EBIT margin slipped 50bps YoY.
- Self-Funding Bet: CFO Shiv Verma said Robinhood is now self-funding new ventures like Rothera and WonderFi without adding to its overall cost base.
Robinhood’s Q2 Earnings Show a Margin Story Bigger Than the Revenue Beat
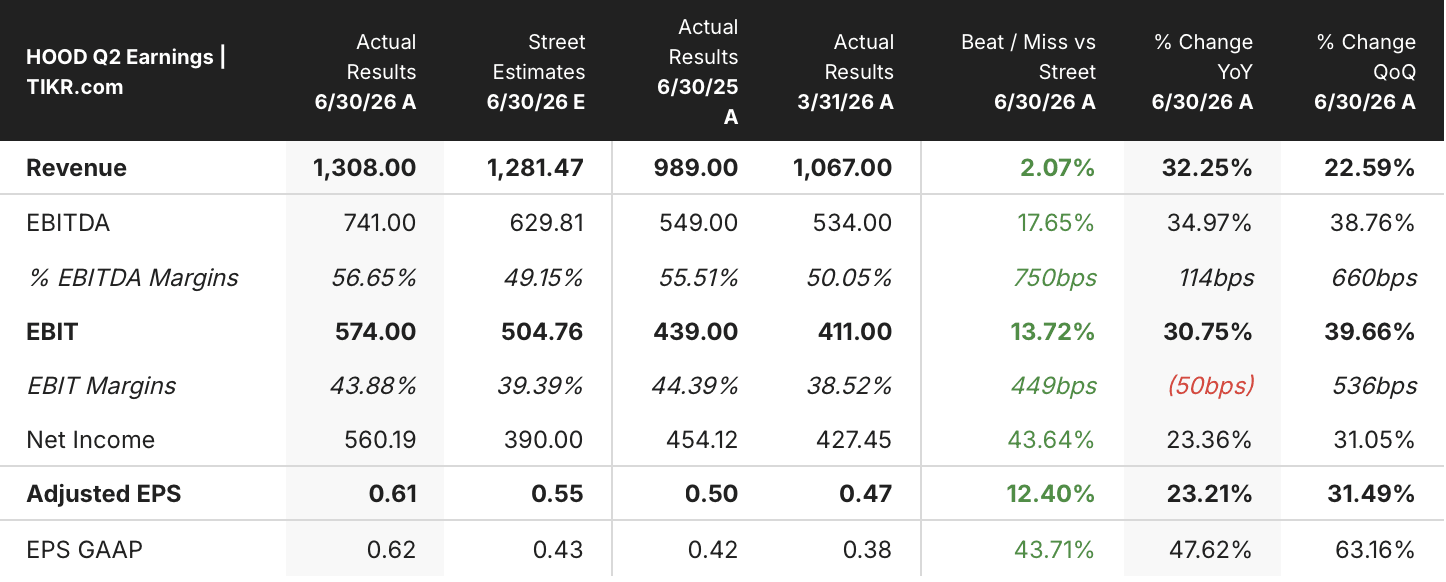
Robinhood (HOOD) closed its second quarter of 2026 with revenue of $1.31 billion, beating Wall Street’s $1.28 billion estimate by 2% and growing 32% year over year. Management delivered the print on the July 29 call, and Robinhood stock was still digesting it two days later, trading at $88.67 and up 2.39% on the day. The headline was clear before the CFO said a word: this was Robinhood’s biggest quarter yet, and it wasn’t close. Management delivered the print on the July 29 Q2 earnings call, and Robinhood stock was still digesting it two days later, trading at near $89 and up 2% on the day. The headline was clear before the CFO said a word: this was Robinhood’s biggest quarter yet, and it wasn’t close. That breadth matters: Robinhood has sold off after each of its last five earnings reports, averaging roughly 8%, even as those beats kept narrowing. This one didn’t narrow.
Underneath that top line, the margin story mattered more than the beat itself. EBITDA came in at $741 million, a 56.65% margin that expanded 660 basis points from the prior quarter and cleared Street’s 49.15% estimate by 750 basis points. Net income of $560.19 million beat estimates by 43.64%, the widest margin of outperformance on the sheet. But EBIT margin, at 43.88%, slipped 50 basis points from a year ago even as EBIT dollars grew 30.75% year over year, a gap that points to rising depreciation and stock-based comp tied to the two businesses Robinhood just added to its books.
Those two businesses are Rothera, the prediction markets joint venture with SIG that became a top three designated contract market within a month of launch, and WonderFi, the Canadian crypto acquisition Robinhood closed in the quarter. Adjusted operating expenses and stock-based compensation totaled $641 million, below the high end of Robinhood’s prior outlook even with both new cost bases layered in. CFO Shiv Verma addressed how that math works on Q2 earnings call: “We believe it is a competitive advantage to not only be a growth company that can invest for the long term, but also leverage our lean and disciplined operating model to self-fund a meaningful amount of these new investments.” Robinhood followed through by lowering its full-year 2026 guide for adjusted OpEx and SBC to $2.675 billion to $2.775 billion.
Net deposits told a similar story of scale funding scale. Robinhood pulled in a record $22 billion, a 28% annualized growth rate, and added nearly 1 million funded customers, the most since its 2021 IPO. July cooled from there. Verma pointed to net deposits tracking toward the $4 billion area for the month, the softest reading of the year, though he called it seasonal, not a trend shift, and noted deposits are still running above the company’s 20% annual growth target year to date.
Where that funding goes next showed up elsewhere on the call. Robinhood Chain crossed 150 million transactions since launch, while Trump Accounts signed up 7 million children with nearly $1.5 billion contributed since the July rollout. None of it added a dollar to the widened cost guide, which is what makes Robinhood stock more than a bet on any single product.
TIKR Values Robinhood Stock at $170, Eyeing a 97% Total Return
TIKR’s mid case model values Robinhood stock at $170 by December 2030, implying a 97% total return from the current price of $87, or 17% annualized over 4.4 years.

That return profile puts Robinhood stock in rare territory for a company already generating over a billion dollars of quarterly revenue, pricing in continued compounding rather than a single product cycle.
The model’s math leans on exactly what Q2 proved: revenue outgrowing expenses, EBITDA margin expanding even as new ventures get funded, and net deposits compounding fast enough to keep assets, and future revenue, on the same trajectory.
Should You Invest in Robinhood Markets, Inc.?
The only way to really know is to look at the numbers yourself. TIKR gives you free access to the same institutional-quality financial data that professional analysts use to answer exactly that question.
Pull up Robinhood Markets, Inc. stock and you’ll see years of historical financials, what Wall Street analysts expect for revenue and earnings in the quarters ahead, how valuation multiples have moved over time, and whether price targets are trending up or down.
You can build a free watchlist to track Robinhood Markets, Inc. alongside every other stock on your radar. No credit card required. Just the data you need to decide for yourself.
Access Professional Tools to Analyze HOOD stock on TIKR for Free →
Looking for New Opportunities?
- See what stocks billionaire investors are buying so you can follow the smart money.
- Analyze stocks in as little as 5 minutes with TIKR’s all-in-one, easy-to-use platform.
- The more rocks you overturn… the more opportunities you’ll uncover. Search 100K+ global stocks, global top investor holdings, and more with TIKR.
Disclaimer:
Please note that the articles on TIKR are not intended to serve as investment or financial advice from TIKR or our content team, nor are they recommendations to buy or sell any stocks. We create our content based on TIKR Terminal’s investment data and analysts’ estimates. Our analysis might not include recent company news or important updates. TIKR has no position in any stocks mentioned. Thank you for reading, and happy investing!


