


Key Takeaways: Costco Stock vs Altria Stock as of July 2026
- Total Return Verdict: TIKR’s models give Costco stock a 48% total return at 10% a year through Aug 2030, double Altria’s 24% at 5%.
- Income Head Start: Altria stock yields 6% today, ten times Costco’s 0.6%, and it beat Costco stock over the past year, 22.8% total return to 1.8%.
- Decade Gap: A decade in Costco stock returned 469%; Altria delivered 8%.
- Coverage Split: Costco pays out 27% of earnings, while Altria’s $4.16 dividend ran past its $4.12 in reported 2025 EPS.
Costco Stock vs Altria Stock: Does a 6% Yield Beat Dividend Growth?
Altria stock (MO) pays a 6% dividend yield as of July 2026, ten times the 0.6% Costco stock (COST) offers, and that gap frames the oldest argument in income investing. Take the big check now, or take the small one that grows? The answer isn’t obvious.

Altria raised its dividend from $3.52 per share in 2021 to $4.16 in 2025, an increase every single year, and its shares returned 23% over the past twelve months. Costco’s 1.8% return over the same stretch looks feeble next to that.
The two payouts come from opposite businesses.
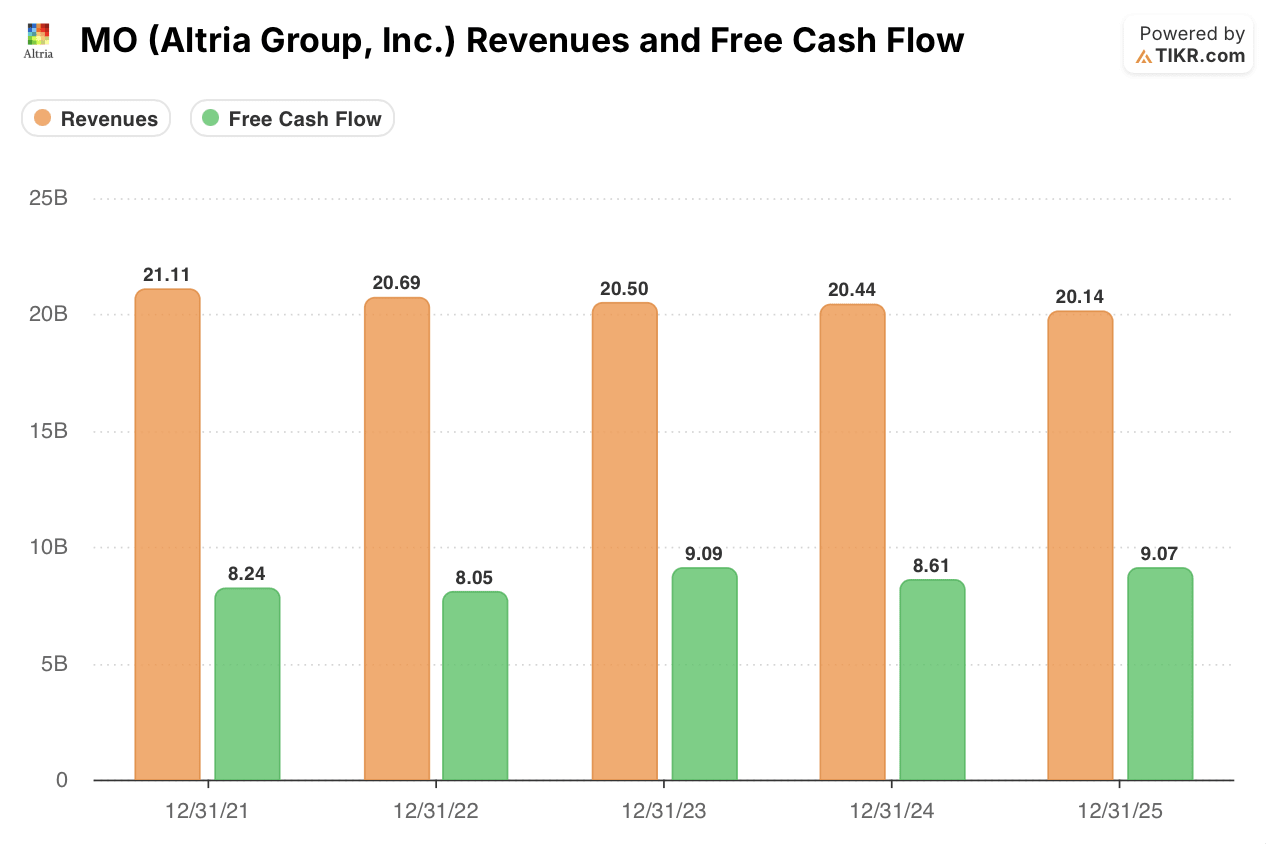
Altria, the Marlboro maker, runs a shrinking operation: revenue slipped from $21.11 billion in 2021 to $20.14 billion in 2025, declining in each of the last four years. It converts what remains into cash at a rate few companies match, with $9.07 billion in 2025 free cash flow, 45.1% of sales.

Meanwhile, Costco, the membership warehouse retailer, grew revenue from $195.93 billion to $275.24 billion over the same window and now runs at $293.59 billion on a trailing twelve-month basis.

The high-yield case deserves its due. Altria’s payout ratio, the share of earnings paid out as dividends, sat at a covered 61% in 2024.

Analysts expect the dividend to reach $5.10 per share by 2030, with normalized earnings climbing to $6.43. A holder collecting 6% a year needs nothing heroic from the share price to earn a decent return, and over the past five years Altria stock delivered 50% at an 8.4% annual rate. Income now is certain in a way growth never is.

Costco counters with speed. Its regular dividend grew 13.4% in fiscal 2022 and 13.6% in fiscal 2023, reached $4.92 in fiscal 2025, and consumed just 27% of earnings. Fiscal 2024 holders collected $19.36 per share after a $15 special dividend landed on top of the $4.36 regular payout. The deciding evidence is total return, the combination of price change and dividends, and that is where these two stocks separate.
Dividend Growth, Coverage, and Total Return: The COST vs MO Scorecard
Costco’s dividend has far more room to grow than Altria’s, and the payout ratios prove it. Costco paid out 27% of fiscal 2025 earnings. Altria’s $4.16 dividend exceeded its $4.12 in reported earnings per share, a 100.19% payout ratio, after reported earnings fell 37%. Normalized earnings of $5.42 per share still cover the check. But a dividend running ahead of reported profit leaves no slack, while a payout under 27 cents per earnings dollar leaves decades of raises.
Growth settles the coverage question over time.

TIKR’s mid case pencils in 7% annual revenue growth for Costco through 2035 against 2% for Altria, with earnings compounding at 9% versus 4%. Analysts see Costco’s dividend at $5.30 in fiscal 2026 and $7.88 by fiscal 2030, while Altria’s reaches $5.10. At today’s 6% and 0.6% yields, Altria’s income lead stays enormous for years. The question is what the share price does underneath it.

History answers bluntly. Altria stock traded at $68 ten years ago and trades at $73 today; TIKR scores that decade at a 7.7% total return, 0.7% a year. Costco stock climbed from $167 to $952 over the same ten years, a 469% return at 19.0% annually, with the rising payout and specials layered on top. The forward view keeps the same order.
TIKR’s mid case gives Costco a $1,404 target and a 48% total return at 10% a year through August 2030. The same framework gives Altria stock $90 and 24%, or 5% a year, through December 2030. Stretch both to 2035 and the gap narrows but never closes: 100% cumulative for Costco, 71% for Altria.
Why Costco Stock Beats Altria Stock for Building Long-Term Wealth
Costco stock wins the wealth-building matchup. TIKR’s mid case projects a 48% total return at 10% a year through August 2030, double the 24% at 5% a year it projects for Altria stock.
The income case for Altria is real: a 6.0% yield covered by $5.42 in normalized earnings, and a 22.8% past-year return that beat Costco outright. The verdict already accounts for it, because the decade behind and the decade ahead both run the other way, 469.1% against 7.7% behind, 100% against 71% ahead.
One number flips this call: Costco’s multiple. The stock grew earnings 13.0% last year yet returned just 1.8% because its P/E compressed 6.4%, and a de-rating running faster than the 1.2% annual drag TIKR’s mid case assumes hands the matchup to Altria’s yield.
Should You Invest in Costco or Altria?
The only way to really know is to look at the numbers yourself. TIKR gives you free access to the same institutional-quality financial data that professional analysts use to answer exactly that question.
Pull up Costco and Altria side by side and you’ll see years of historical financials, what Wall Street analysts expect for revenue and earnings in the quarters ahead, how valuation multiples have moved over time, and whether price targets are trending up or down for either stock.
You can build a free watchlist to track Costco, Altria, and every other stock on your radar. No credit card required. Just the data you need to decide for yourself.
Access Professional Tools to Analyze COST stock and MO stock on TIKR for Free →
Looking for New Opportunities?
- See what stocks billionaire investors are buying so you can follow the smart money.
- Analyze stocks in as little as 5 minutes with TIKR’s all-in-one, easy-to-use platform.
- The more rocks you overturn… the more opportunities you’ll uncover. Search 100K+ global stocks, global top investor holdings, and more with TIKR.
Disclaimer:
Please note that the articles on TIKR are not intended to serve as investment or financial advice from TIKR or our content team, nor are they recommendations to buy or sell any stocks. We create our content based on TIKR Terminal’s investment data and analysts’ estimates. Our analysis might not include recent company news or important updates. TIKR has no position in any stocks mentioned. Thank you for reading, and happy investing!


