
Key Takeaways: Lululemon Stock vs Nike Stock as of July 2026
- Verdict Call: Nike stock is the dip: revenue held within 1.1% of flat across all four fiscal 2026 quarters after a year of steep declines, and TIKR’s mid case models a 100% total return at 15% annualized.
- Valuation Cushion: Lululemon stock trades at 11x NTM earnings, under half Nike’s 25x.
- Earnings Trajectory: The Street models NKE EPS climbing 21% and 49% YoY in back-to-back quarters by mid-2027, while LULU’s next print falls 42% before growth crawls back at single digits.
- Margin Tell: Lululemon’s gross margin fell 410 bps YoY to 54% in Q1 while Nike’s held at 40% ex-tariff items, and that divergence is what separates a decline from a dip.
Lululemon Stock vs Nike Stock: Which Slump Is Actually a Buying Chance?

Nike stock (NKE) lost 47% over the past year while Lululemon stock (LULU) lost 46%, yet as of July 2026 only one of these slumps behaves like a dip. Telling them apart is a repeatable skill, not a guess. A stock in a temporary dip and a stock in a lasting decline look identical on a price chart; they look nothing alike on four specific warning signs: sales falling at existing stores, unsold inventory stacking up, margins shrinking, and customers defecting to rivals. A dip shows those signs fading. A decline shows them multiplying.

Nike enters the test two years into its stumble. Revenue fell as much as 12% year over year in fiscal 2025, then held within 1.1% of flat across all four quarters of fiscal 2026. CEO Elliott Hill told investors on the Q4 earnings call that “overall, the results aren’t there yet,” and he’s right about the remaining problem: Sportswear and Jordan Streetwear, close to half of revenue, are still declining double digits. But Running has grown double digits for five straight quarters, adding $1 billion, and Foot Locker comps turned positive for the first time in four years. The warning signs are fading, not multiplying.

Lululemon on the other hand is sitting earlier in its arc. Growth cooled from 13% in the January 2025 quarter to 0.8% a year later, and North America comparable sales fell 6% last quarter. The sharper tell came from Interim Co-CEO and CFO Meghan Frank, who told analysts on their Q1 2027 earnings call that the company is “seeing some stability in our category right now, and we’re seeing ourselves drop below where we were performing.” A stable category and a falling brand is the textbook signature of share loss.

Still, the case for Lululemon stock deserves real weight. It trades at 11x forward earnings against Nike’s 25x, China Mainland revenue grew 30% last quarter with a 20% full-year guide intact, and even its worst quarter in years produced an 11.2% operating margin. Incoming CEO Heidi O’Neill arrives in September with $1 billion of buyback capacity waiting. Cheap plus a fresh leader has rescued brands before.
The Four Warning Signs of a Real Decline, Tested on LULU and NKE
A real decline announces itself through four signals: falling sales at existing stores, inventory outgrowing revenue, shrinking margins, and customers defecting to rivals. A dip shows these signs fading. A decline shows them multiplying, and the Financials tab exposes each one.
Start with sales at existing stores, because total revenue can misrepresent the health of the core business. New locations add sales even while the core erodes, so comparable sales, the growth from stores already open, is the honest number. Lululemon grew revenue 4% last quarter while global comps fell 2% and North America comps fell 6%, with square footage up 11%. Expansion is papering over erosion in the home market. Nike’s stabilization came the opposite way, through demand: wholesale grew 4% for the fiscal year because retail partners reordered, not because Nike opened doors.
Second, inventory. Stock that grows faster than sales forces markdowns later, and markdowns eat the third signal, margins. Neither company fails the inventory test outright: Nike’s is flat at $7.50 billion with Greater China units down double digits, and Lululemon’s units are down 4%. The discounting direction differs, though. Nike cut EMEA off-price revenue by over 50% and lifted full-price realization 15 points, while Lululemon guided markdowns up 50 basis points this quarter with added seasonal clearance.

Margins are where the two stories fully separate. Lululemon’s gross margin has slid from 58.5% to 54.2% in three quarters, and costs rose 310 basis points as a share of sales at the same time, crushing operating margin from 18.5% to 11.2%.
Both jaws are closing at once.
Nike’s margins, detailed in the next section, spent fiscal 2026 doing the opposite: grinding higher off the bottom. On the fourth signal, share, Frank’s own words did the diagnosing for Lululemon, while Nike gained 5 points of running share in statement footwear across North America and Western Europe.
Running the Checklist on NKE and LULU Financials
Nike’s numbers are worse in absolute terms, and that is precisely why the direction matters more. The dip-or-decline question is never about which company earns higher margins today; it’s about which margin line is pointing up. Lululemon still out-earns Nike on every profitability measure. It also just guided full-year operating margin down 380 basis points and cut its EPS outlook to a range of $10.95 to $11.15 from $13.26 earned a year ago. Elevated numbers falling fast are how declines start.
Nike’s depressed numbers are inflecting the other way. Excluding a one-time $986 million tariff recovery, fourth quarter gross margin held at 40.2%, down just 10 basis points, after four quarters of sequential improvement. Departing CFO Matt Friend told analysts the quarter “has given us increasing confidence that our margins are stabilizing, and that we’re starting to see a pathway back towards gross margin expansion,” with that expansion guided to begin in the current quarter. Severance and supply chain restructuring costs of nearly $400 million are already absorbed.
The honest caveat cuts both ways. Nike still guides revenue down low to mid-single digits near term, and its Sportswear problem is unsolved. But Lululemon’s guidance moved from growth to flat-to-down 1% within a single quarter, and its two interim co-CEOs are holding the wheel until September. One company is two years into fixing a known problem. The other is still discovering the size of its own.
Cheap for a Reason: NKE and LULU on the Valuation and Estimates Tabs
Lululemon stock is the cheapest it has been in years, and that fact alone proves nothing. Again, Lululemon’s next-twelve-month P/E sits at 11x, down from 13x a year ago and 14x as recently as February. A multiple that keeps falling while the stock falls means analysts are cutting estimates as fast as the price drops. Cheap against your own history only counts when the earnings under the multiple have stopped shrinking. Lululemon’s haven’t.

Analyst estimates date each company’s recovery, and the dates diverge sharply. Consensus has Lululemon’s EPS falling 42% next quarter, then rebuilding at single-digit rates into 2028.
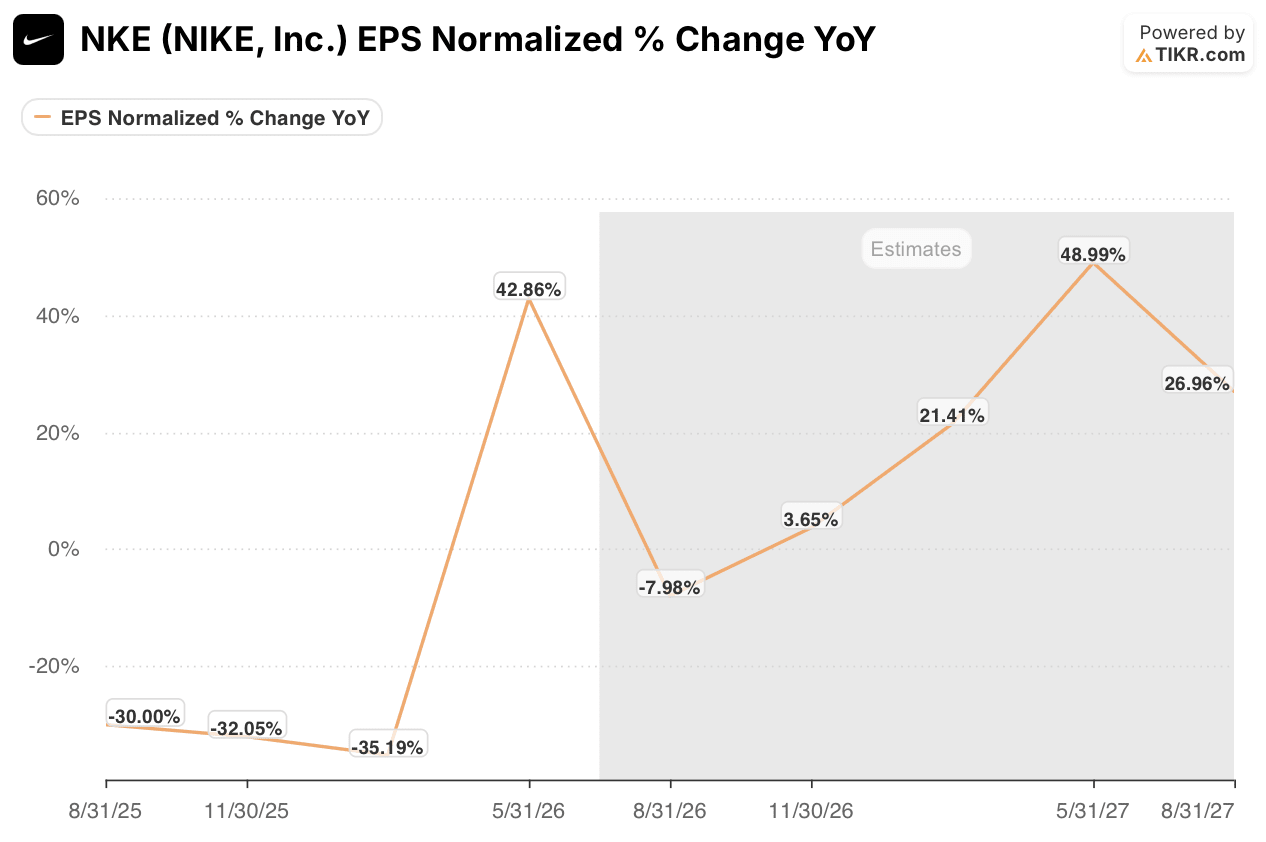
Nike’s EPS grows 21% and then 49% in consecutive quarters by mid-2027, which is why NKE’s forward multiple compressed from 47x last August to 25x now: the E is finally rising into the P. The market charges more for Nike stock because the Street can see the other side of its valley.

In dollar terms, the Street’s path takes Nike’s normalized EPS from $1.58 in fiscal 2026, excluding the tariff benefit, to $2.31 by fiscal 2028, growth of 34% in that second year. Nike’s per-share figures run small because its profit spreads across 1,483.5 million shares, roughly thirteen times Lululemon’s count, so the growth rate is the number to watch, not the dollar gap.
The Model tab turns those paths into returns.

TIKR’s mid case takes Nike stock from $42 to an $84 target, a 100% total return at 15% annualized over 4.8 years, built on a 4.4% revenue growth assumption and net margin recovering to 8%.
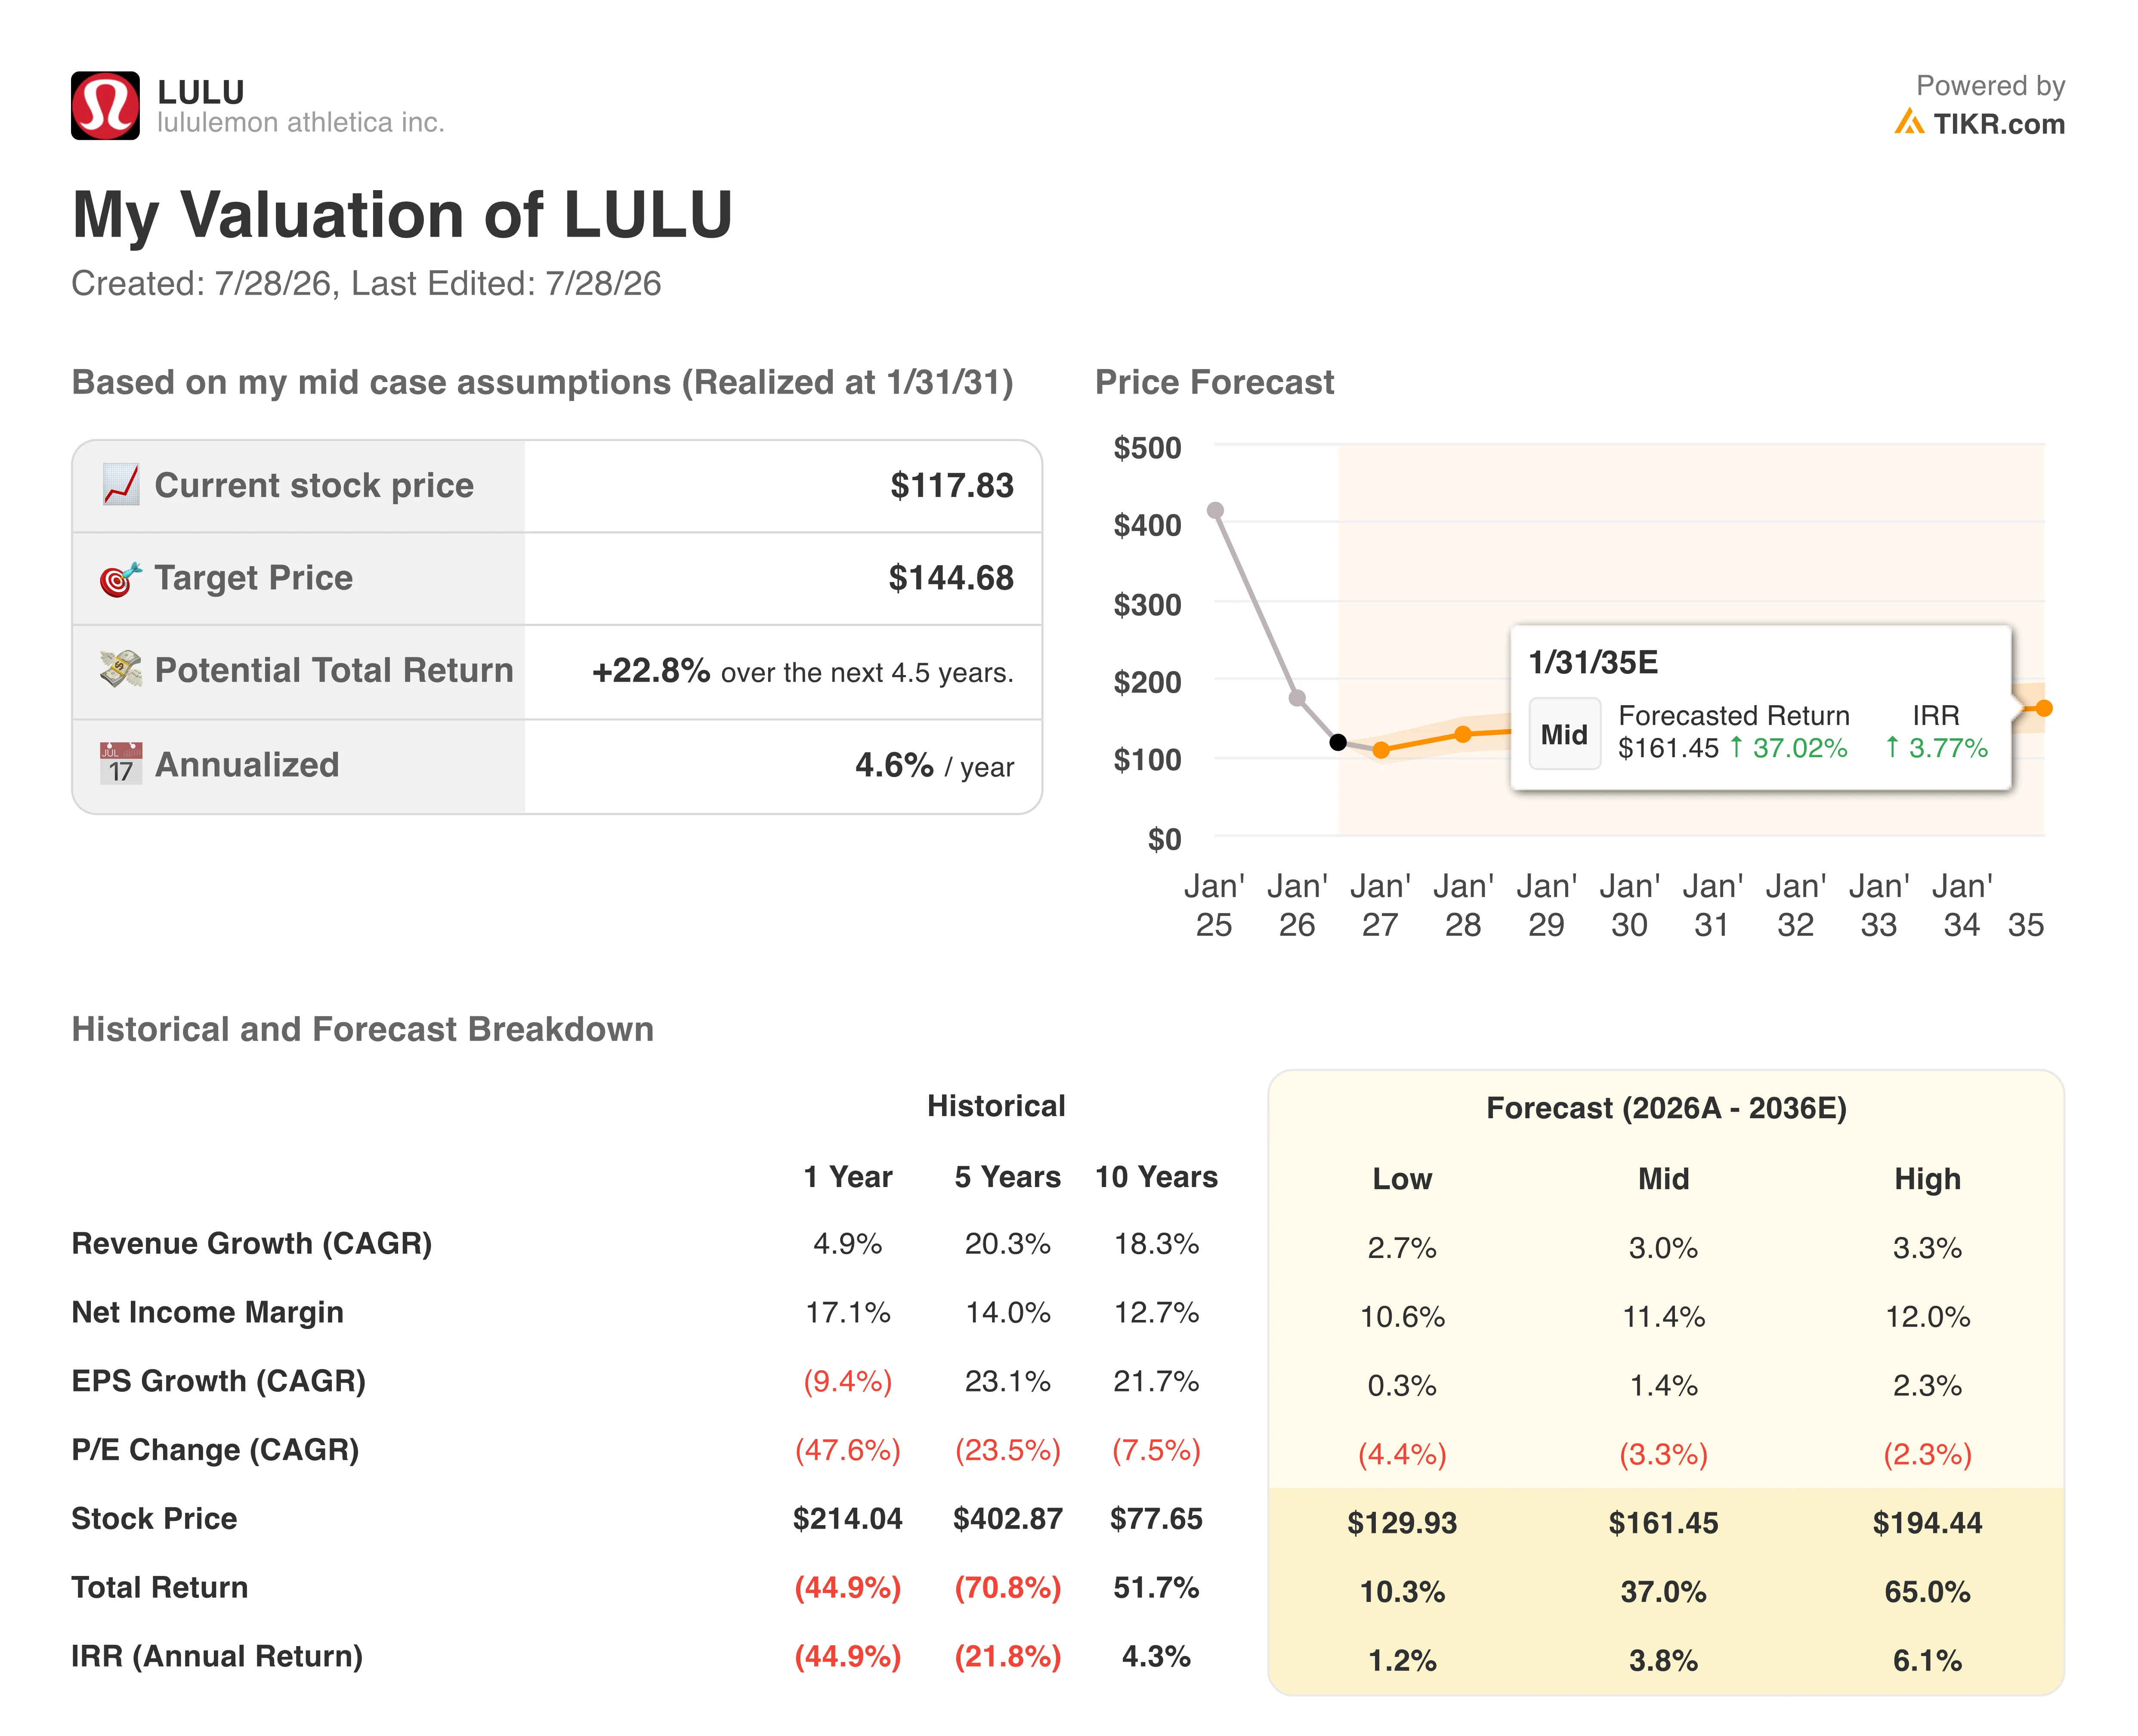
Lululemon stock goes from $118 to a $145 target, worth 23% total and 5% annualized over 4.5 years. The scenario spread is the sharper lesson: through 2035, TIKR’s low case for Nike returns 9% a year, beating Lululemon’s high case at 6%. The bear case for one out-earns the bull case for the other.
That is the repeatable framework. Check the direction of comps, inventory, and margins on the Financials tab; ask whether a cheap multiple sits on falling estimates on the Valuation tab; date the recovery on the Estimates tab; and stress the scenario spread on the Model tab. Any beaten-down stock will sort itself into dip or decline under those four steps.
Why Nike Stock Is the Dip and Lululemon Stock Is the Warning
Nike stock wins this matchup. It shows the only pattern that marks a true dip, stabilized sales and stabilized margins at the bottom, and the Street’s 49% EPS growth forecast by mid-2027 dates the recovery rather than hoping for one.
Lululemon’s 10.65x multiple is the strongest counterargument, and it still loses. A discount that formed while gross margin fell 410 basis points in a year is the market grading a decline in progress, not mispricing a dip, and estimates that dropped all year give that discount no floor.
One print flips this call: a positive North America comp at Lululemon in the same quarter its gross margin stops falling. Nike carries its own tripwire, a Sportswear and Jordan half of revenue that has to stop shrinking by late fiscal 2027.
TIKR’s model states the margin of victory plainly: a 100% total return for Nike stock over 4.8 years against 23% for Lululemon stock over 4.5.
Should You Invest in Nike or Lululemon?
The only way to really know is to look at the numbers yourself. TIKR gives you free access to the same institutional-quality financial data that professional analysts use to answer exactly that question.
Pull up Nike and Lululemon side by side and you’ll see years of historical financials, what Wall Street analysts expect for revenue and earnings in the quarters ahead, how valuation multiples have moved over time, and whether price targets are trending up or down for either stock.
You can build a free watchlist to track Nike, Lululemon, and every other stock on your radar. No credit card required. Just the data you need to decide for yourself.
Access Professional Tools to Analyze NKE stock or LULU stock on TIKR for Free →
Looking for New Opportunities?
- See what stocks billionaire investors are buying so you can follow the smart money.
- Analyze stocks in as little as 5 minutes with TIKR’s all-in-one, easy-to-use platform.
- The more rocks you overturn… the more opportunities you’ll uncover. Search 100K+ global stocks, global top investor holdings, and more with TIKR.
Disclaimer:
Please note that the articles on TIKR are not intended to serve as investment or financial advice from TIKR or our content team, nor are they recommendations to buy or sell any stocks. We create our content based on TIKR Terminal’s investment data and analysts’ estimates. Our analysis might not include recent company news or important updates. TIKR has no position in any stocks mentioned. Thank you for reading, and happy investing!