Key Stats for Norwegian Cruise Line Stock
- Price change for Norwegian Cruise Line stock: -10%
- $NCLH Stock Price as of Jul. 30: $19
- 52-Week High: $27
- $NCLH Stock Price Target: $22
Now Live: Discover how much upside your favorite stocks could have using TIKR’s new Valuation Model (It’s free)>>>
What Happened?
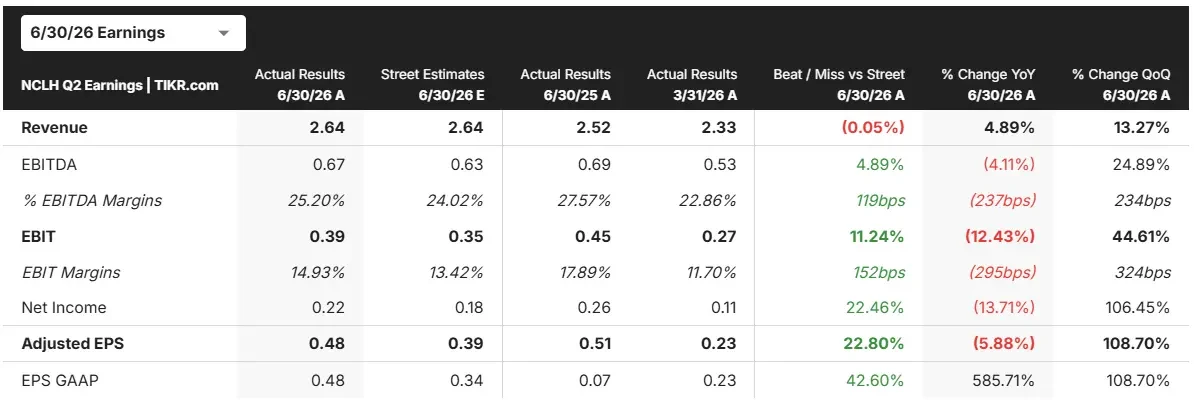
Norwegian Cruise Line (NCLH) stock dropped almost 10% on Thursday, even though the company actually beat its own Q2 targets.
Adjusted EPS came in at $0.48, ten cents ahead of guidance. It came in ahead of analysts’ expectations of $0.39.
Adjusted EBITDA hit $666 million, beating expectations by $34 million, and net income landed at $222 million.
Net yield fell 2.6%, which was actually 100 basis points better than the company had initially expected.
So why did Norwegian Cruise Line stock fall on a quarter that beat expectations? The answer is guidance.
Management now expects full-year net yield to decline around 5%, landing at the low end of its prior range. Full-year adjusted EBITDA guidance dropped to about $2.5 billion, with adjusted EPS now expected near $1.50.
The company said demand generation problems, especially on the core Norwegian brand, will keep weighing on results into next year, with Q1 2027 expected to be a particular drag.
CEO John Chidsey didn’t blame the market for the shortfall. Unlike some rivals pointing to Middle East conflict disruptions, Chidsey was blunt: “The vast, vast majority of our problems, as I’ve said all along, are self-inflicted.”
He said the issues are execution-related, not macro-driven, which means they’re fixable through better internal work rather than waiting for outside conditions to improve.
Since taking over this spring, Chidsey has moved fast. He replaced Norwegian’s head of marketing, brought in new revenue management leadership, and identified $100 million in fresh annualized cost savings this quarter alone.
Combined with $125 million found last quarter, that’s $225 million in total annualized savings over just two quarters. The company is also shifting to a “baseloading” pricing strategy, setting more competitive prices earlier in the booking window instead of holding prices high and discounting later.
There’s a bright spot on the horizon too.
Norwegian is soft-launching a new private island water park next week, with a full grand opening set for early September. Management believes this island experience could become a real demand driver once fresh marketing campaigns roll out in the coming weeks.
The company also noted that its luxury brands, Oceania and Regent Seven Seas, are performing well. The trouble is concentrated at the core Norwegian brand.
See analysts’ growth forecasts and price targets for Norwegian Cruise Line stock (It’s free) >>>
What the Market Is Telling Us About Norwegian Cruise Line Stock
The market’s reaction shows investors care more about the road ahead than the quarter just finished.
Beating guidance wasn’t enough to offset a full-year outlook that pushes real improvement out to the back half of 2027. That’s a long wait, and Norwegian Cruise Line stock is being priced accordingly.

Still, management’s own explanation offers a silver lining: if the problems are self-inflicted rather than driven by the broader market, they’re within the company’s control to fix.
With cost cuts already showing results and new marketing and pricing strategies just getting started, the real test for Norwegian Cruise Line stock will be whether execution actually improves as promised, or whether investors are left waiting even longer than expected.
Estimate a company’s fair value instantly (Free with TIKR) >>>
How Much Upside Does Norwegian Cruise Line Stock Have From Here?
With TIKR’s new Valuation Model tool, you can estimate a stock’s potential share price in under a minute.
All it takes is three simple inputs:
- Revenue Growth
- Operating Margins
- Exit P/E Multiple
If you’re not sure what to enter, TIKR automatically fills in each input using analysts’ consensus estimates, giving you a quick, reliable starting point.
From there, TIKR calculates the potential share price and total returns under Bull, Base, and Bear scenarios so you can quickly see whether a stock looks undervalued or overvalued.
See a stock’s true value in under 60 seconds (Free with TIKR) >>>
Looking for New Opportunities?
- See what stocks billionaire investors are buying so you can follow the smart money.
- Analyze stocks in as little as 5 minutes with TIKR’s all-in-one, easy-to-use platform.
- The more rocks you overturn… the more opportunities you’ll uncover. Search 100K+ global stocks, global top investor holdings, and more with TIKR.
Disclaimer:
Please note that the articles on TIKR are not intended to serve as investment or financial advice from TIKR or our content team, nor are they recommendations to buy or sell any stocks. We create our content based on TIKR Terminal’s investment data and analysts’ estimates. Our analysis might not include recent company news or important updates. TIKR has no position in any stocks mentioned. Thank you for reading, and happy investing!