Key Stats for Workday Stock
- Price change for Workday stock: 8%
- $WDAY Stock Price as of Jul. 27: $152
- 52-Week High: $250
- $WDAY Stock Price Target: $169
Now Live: Discover how much upside your favorite stocks could have using TIKR’s new Valuation Model (It’s free)>>>
What Happened?
Workday (WDAY) stock jumped 8% on Tuesday, climbing close to $160. Investors are positioning ahead of the company’s next earnings report, expected around August 20, 2026, and Wall Street sees meaningful year-over-year growth ahead.
The rally looks like a mix of pre-earnings optimism and a valuation bounce-back. Analysts project fiscal Q2 2027 earnings per share of about $1.26, which would mark roughly 26% growth from a year ago.
The overall analyst community holds a moderate buy consensus on Workday stock, with a price target near $173, well above where shares trade today.
This move comes right after two bearish calls earlier in July, a Morgan Stanley downgrade to underweight and a CLSA underperform initiation.
Those calls had pressured the stock, and today’s bounce suggests some investors see those downgrades as overly pessimistic.
The earnings setup lines up with strong momentum the company already showed last quarter.
Workday reported its best Q1 of new annual contract value growth in five years, driven by both its core business and rising AI adoption.
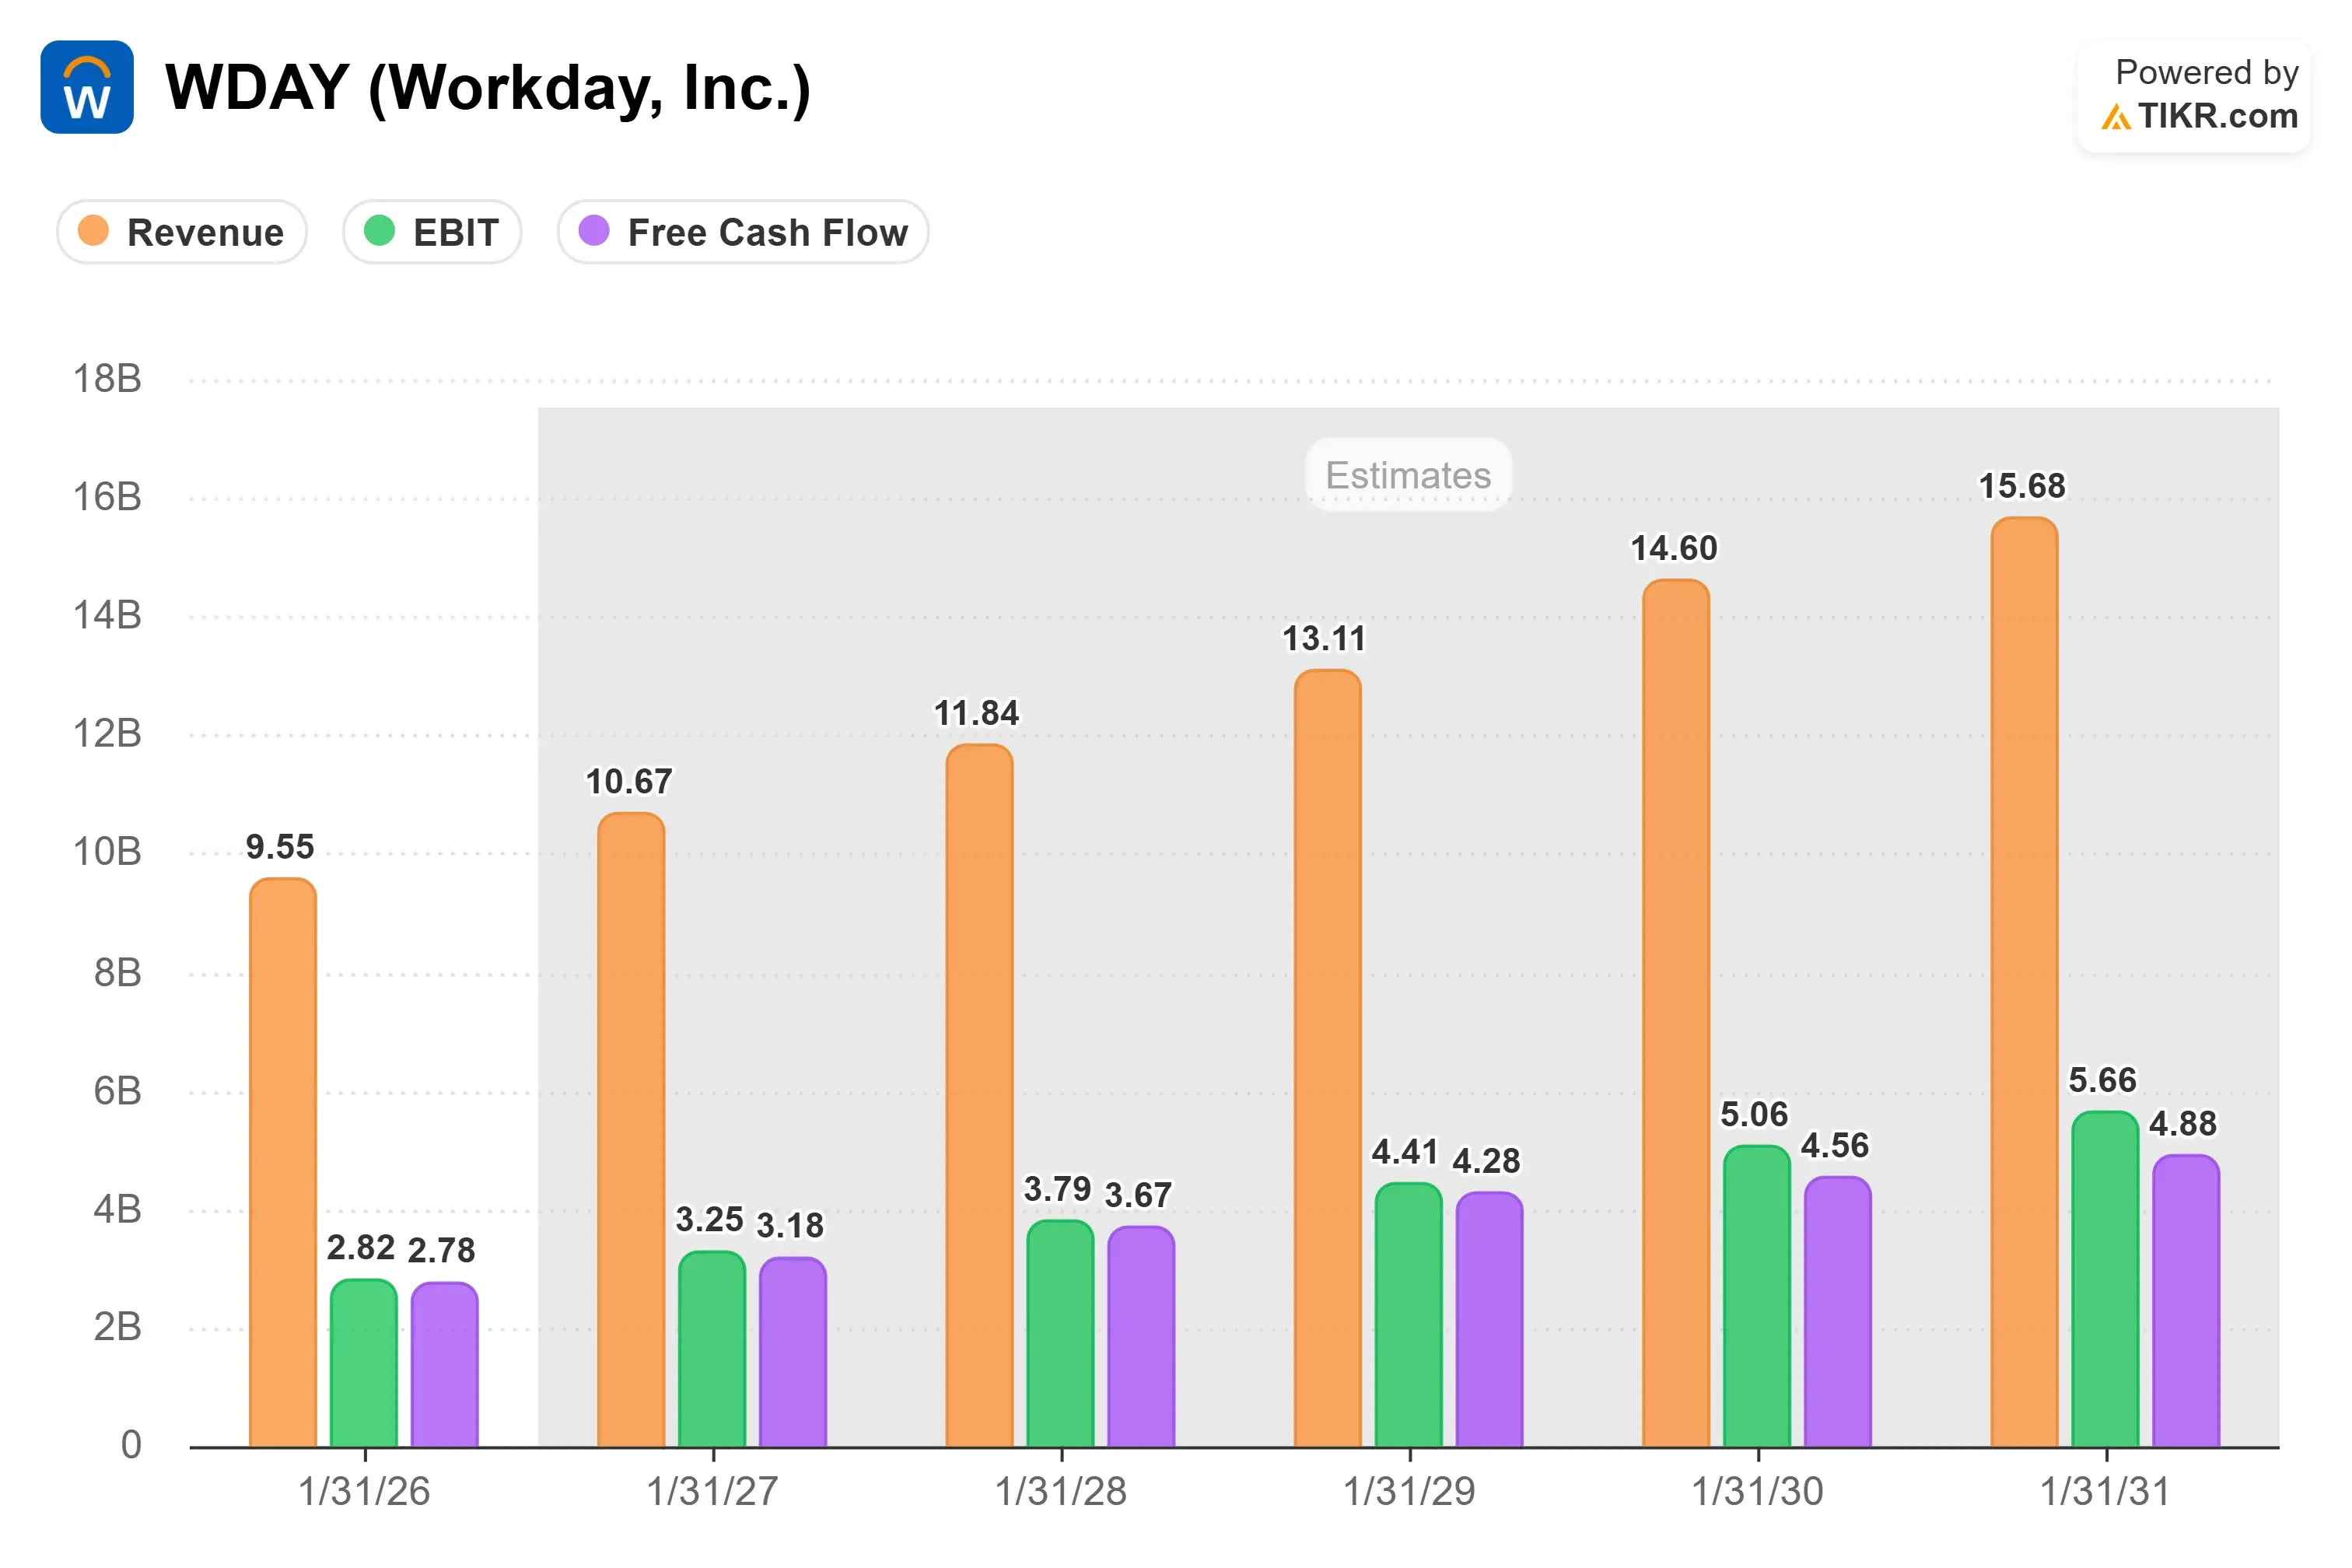
Subscription revenue reached $2.354 billion, up 14%, while total revenue hit $2.542 billion, up 13%.
Non-GAAP operating margin came in at 31.8%, and free cash flow grew 46% to $616 million.
AI is becoming a bigger part of the growth story. New contract value from agentic AI products grew more than 200% year-over-year last quarter, and the company is approaching $500 million in annual recurring revenue from its AI solutions.
More than a quarter of new contract value from existing customer expansions came from AI, and AI-related expansion deals were over 50% larger on average than typical deals.
Adoption numbers back this up.
The company supported 14 million hiring processes through its Recruiting Agent, up 44% year-over-year, and analyzed more than 1.1 million contracts with its Contract Intelligence tool, up 53% from the prior quarter.
More than 4,000 customers are now using at least one organically built AI agent, more than double the count from the previous quarter.
Management also raised its full-year outlook slightly, increasing non-GAAP operating margin guidance to 30.5% for fiscal 2027, while reiterating subscription revenue guidance of $9.925 billion to $9.950 billion for the year.
See analysts’ growth forecasts and price targets for Workday stock (It’s free) >>>
What the Market Is Telling Us About Workday Stock
Today’s jump in Workday stock signals that investors are regaining confidence after a rough stretch tied to those July downgrades.
With shares still trading well below the average analyst target and well off the 52-week high of $249.85, the setup looks like a discounted entry point to some buyers heading into earnings.
The broader enterprise software sector is also getting a lift from improving sentiment around AI monetization, and Workday stock’s outperformance today, even as the Nasdaq slipped, suggests investors view the company’s AI-driven agent business as a real growth driver rather than just a buzzword.
Whether that optimism holds will likely depend on how the upcoming earnings report matches these high expectations.
Estimate a company’s fair value instantly (Free with TIKR) >>>
How Much Upside Does Workday Stock Have From Here?
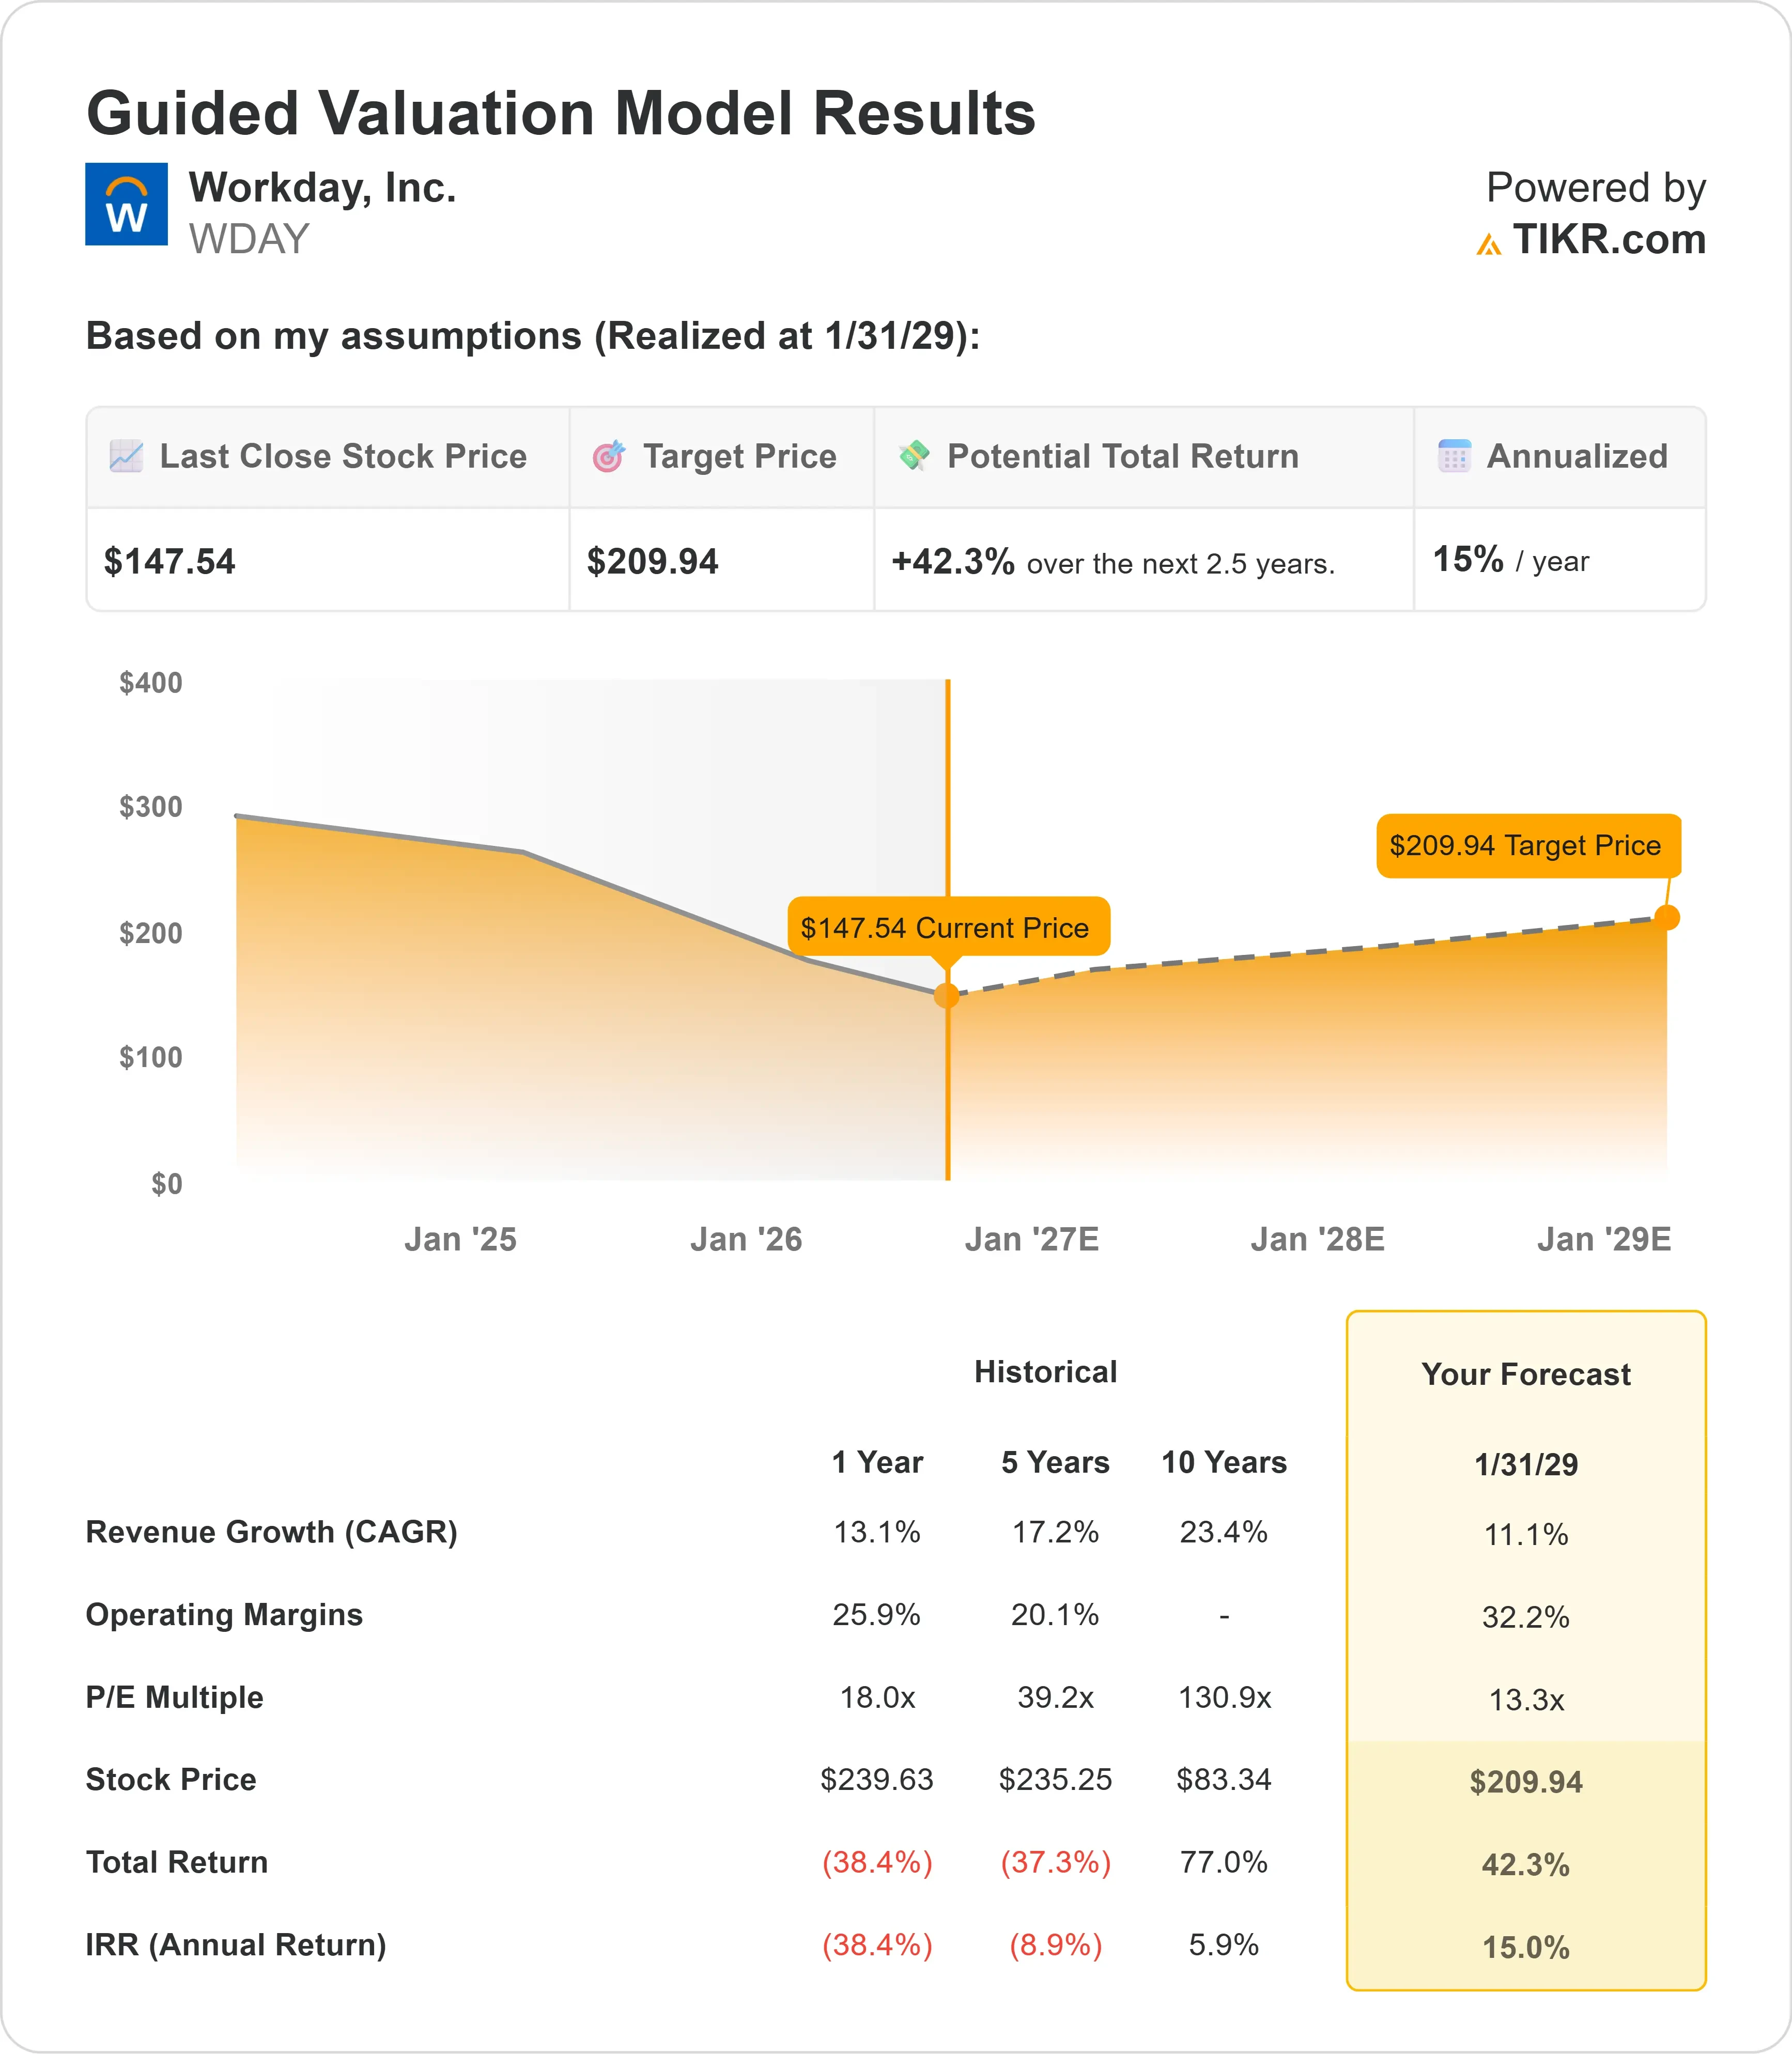
With TIKR’s new Valuation Model tool, you can estimate a stock’s potential share price in under a minute.
All it takes is three simple inputs:
- Revenue Growth
- Operating Margins
- Exit P/E Multiple
If you’re not sure what to enter, TIKR automatically fills in each input using analysts’ consensus estimates, giving you a quick, reliable starting point.
From there, TIKR calculates the potential share price and total returns under Bull, Base, and Bear scenarios so you can quickly see whether a stock looks undervalued or overvalued.
See a stock’s true value in under 60 seconds (Free with TIKR) >>>
Looking for New Opportunities?
- See what stocks billionaire investors are buying so you can follow the smart money.
- Analyze stocks in as little as 5 minutes with TIKR’s all-in-one, easy-to-use platform.
- The more rocks you overturn… the more opportunities you’ll uncover. Search 100K+ global stocks, global top investor holdings, and more with TIKR.
Disclaimer:
Please note that the articles on TIKR are not intended to serve as investment or financial advice from TIKR or our content team, nor are they recommendations to buy or sell any stocks. We create our content based on TIKR Terminal’s investment data and analysts’ estimates. Our analysis might not include recent company news or important updates. TIKR has no position in any stocks mentioned. Thank you for reading, and happy investing!