Key Takeaways:
- The price-to-earnings ratio compares a stock’s price with its profit per share, but the same number can mean very different things depending on the company.
- Nvidia trades below its historical average P/E even as earnings are expected to nearly quadruple by fiscal 2031, according to TIKR data.
- Costco trades above its historical average P/E despite far slower growth, a premium investors pay for its unusual consistency.
- The ratio alone hides future growth, business quality, and how cyclical a company’s earnings really are.
Now Live: Discover how much upside your favorite stocks could have using TIKR’s new Valuation Model (It’s free)>>>
Two of the most talked about stocks in the market right now could not look more different on paper. One sells bulk toilet paper and rotisserie chicken. The other sells the chips powering artificial intelligence data centers around the world.
Yet investors size up Nvidia (NVDA) and Costco (COST) using the same basic tool: the price-to-earnings ratio, or P/E. It is one of the oldest and most widely used numbers in investing. But it can also be one of the most misleading if taken at face value.
Here is what the ratio measures, what it hides, and what these two very different companies reveal about using it wisely.
See analysts’ full growth forecasts and estimates for Nvidia stock (It’s free) >>>
What the price-to-earnings ratio actually measures
The price-to-earnings ratio is simple in concept. It compares a company’s stock price with how much profit it earns per share. A P/E of 40 means investors are paying $40 for every $1 of annual earnings.
A high P/E generally means investors expect a lot of future growth, or they trust the quality and reliability of that company’s earnings.
A low P/E can mean a stock is cheap, or it can mean the market doubts the company’s future.
That is the tricky part. The same number can tell two completely different stories depending on the company behind it.
Nvidia’s PE ratio tells a growth story
According to TIKR data, Nvidia’s normalized earnings per share have exploded from just $0.25 in fiscal 2021 to $4.77 in fiscal 2026. Analysts expect that number to nearly quadruple again, reaching $18.82 by fiscal 2031.

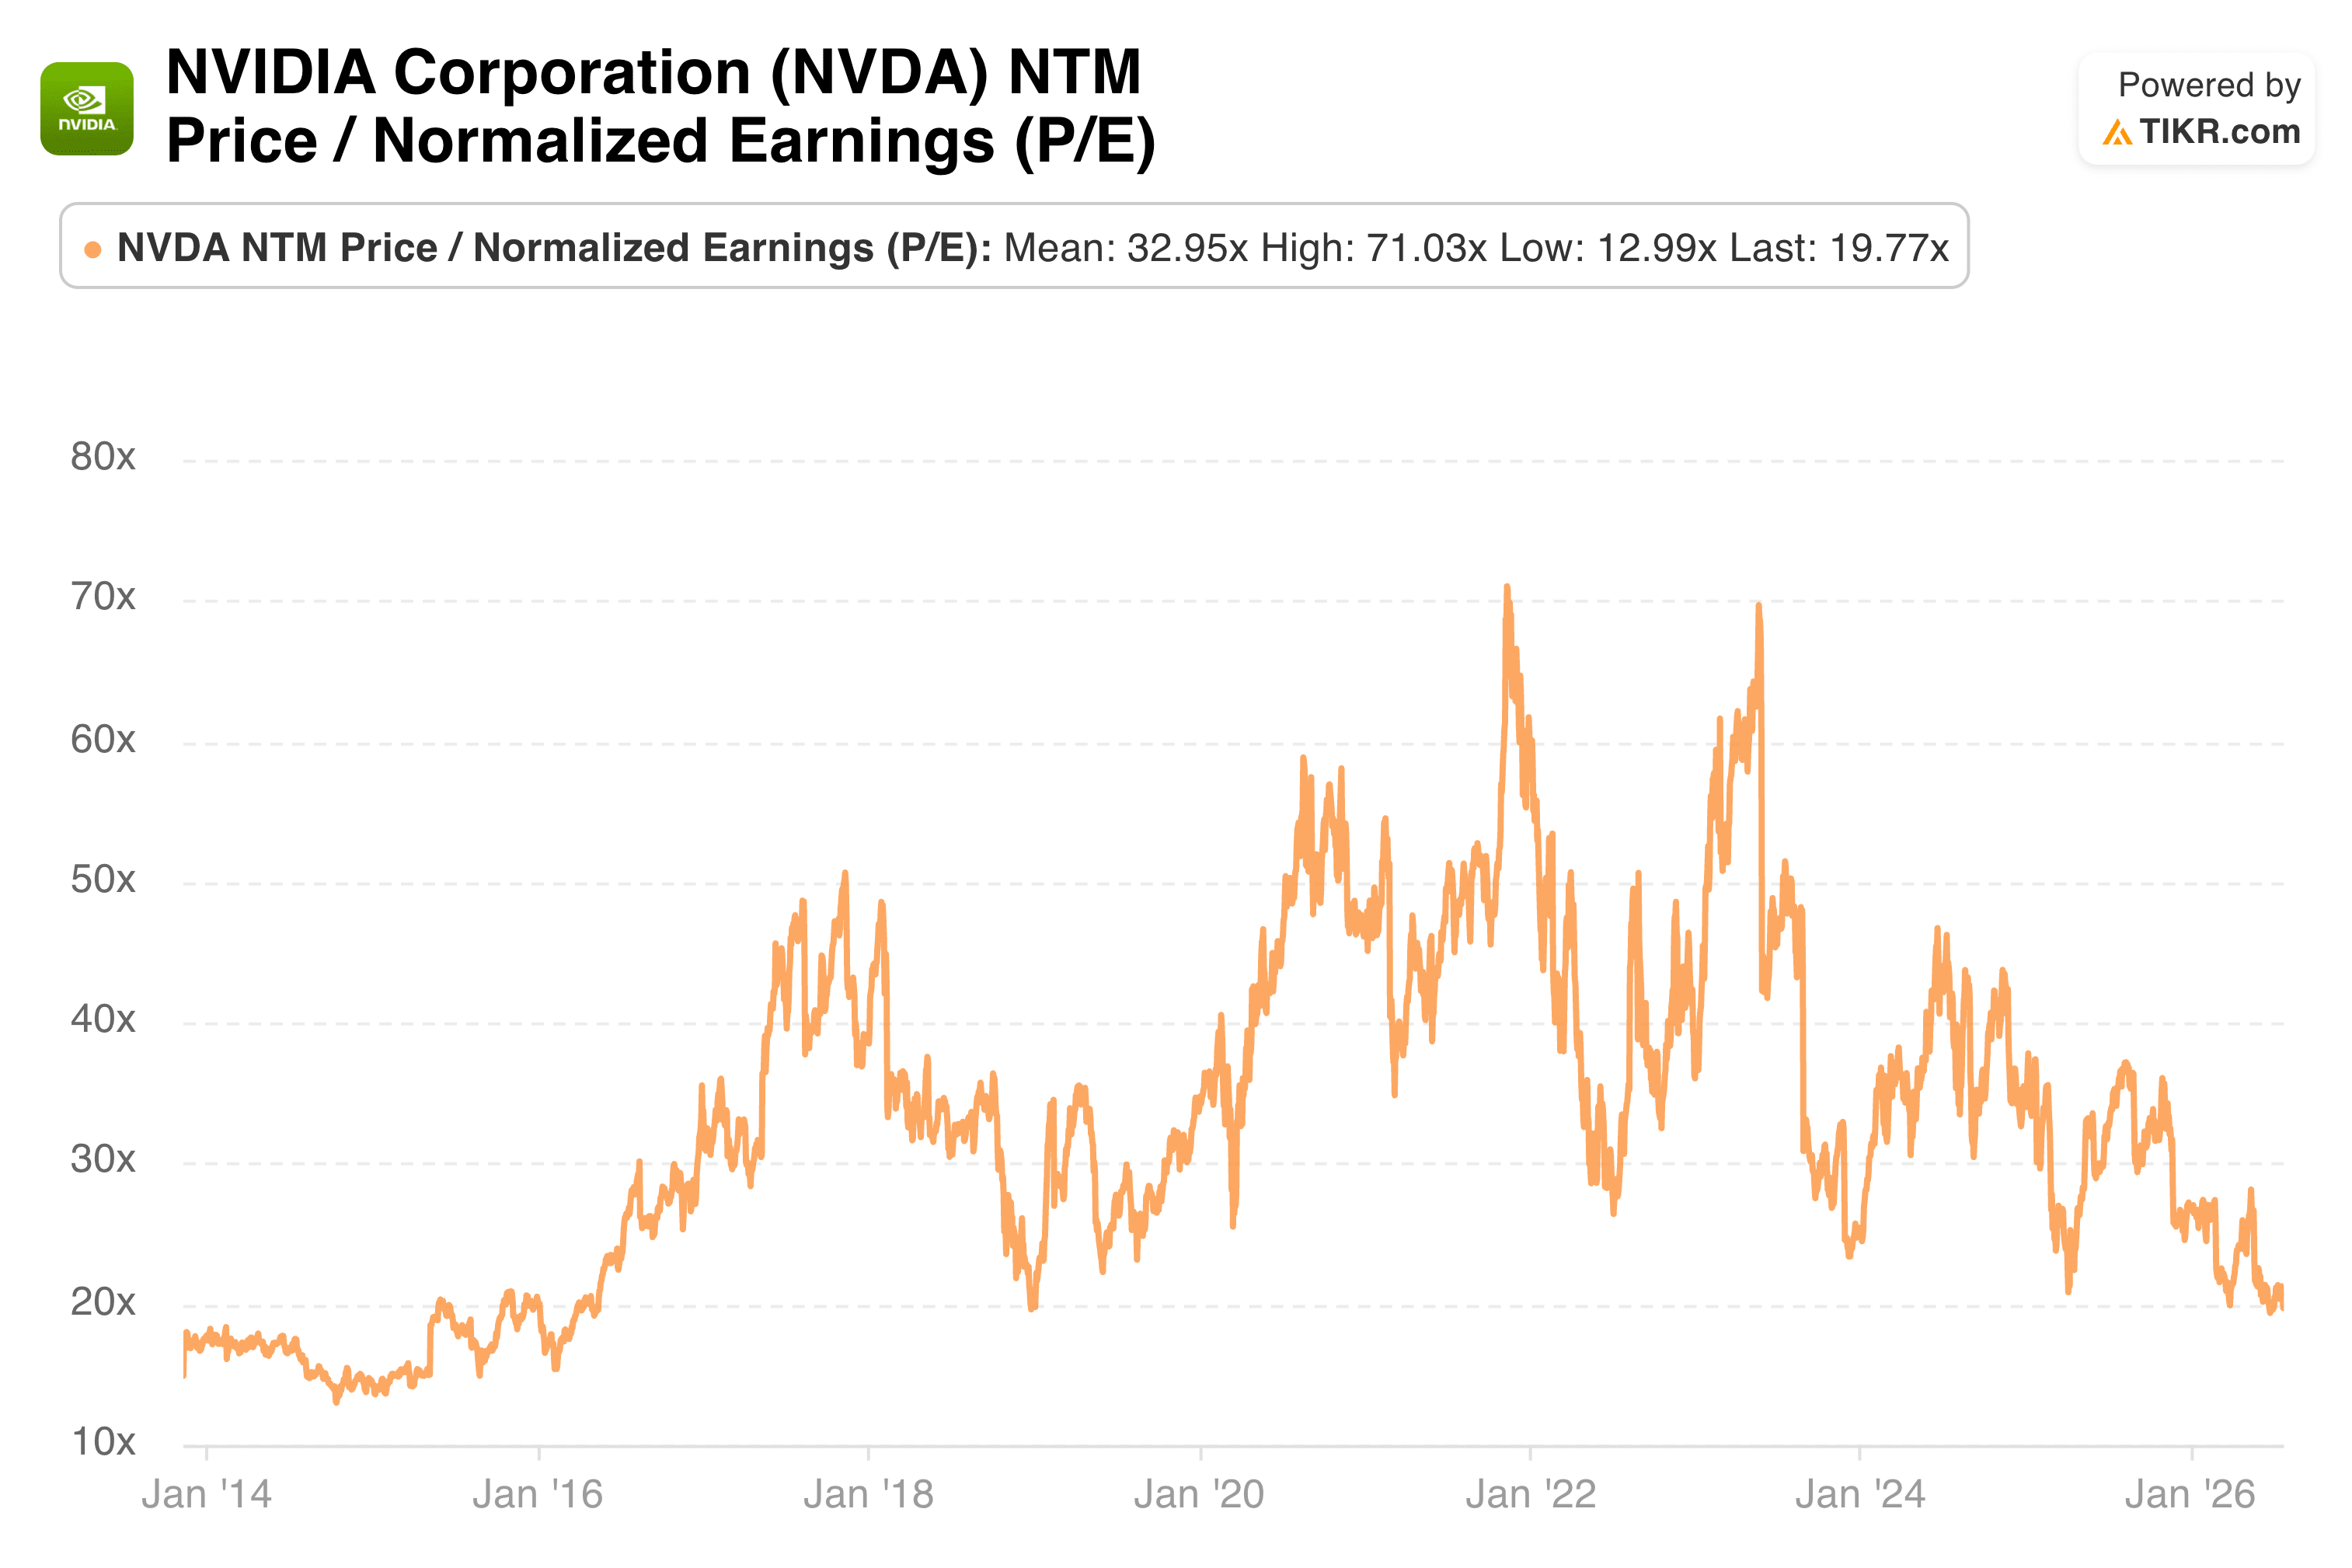
That kind of growth changes how a P/E ratio should be read. Nvidia’s forward P/E has swung wildly over the past decade, from a low of about 13 times earnings to a high above 71 times, with a historical average near 33 times, based on TIKR data.
As of the most recent reading, the stock trades at roughly 20 times forward normalized earnings, well below its own historical average.
That is notable given how fast the business is growing. During NVIDIA’s presentation at the Bank of America 2026 Global Technology Conference, Executive Vice President and CFO Colette Kress described the scale of demand the company is trying to keep up with.
“Most of them right now are in a position that says the compute is tight. There is still a shortage of supply of compute stood up that they want more and more that they are trying to get,” Kress said.
She also pointed to the company’s forward commitments to suppliers as a sign of how much growth Nvidia is planning for.
“We’re essentially at about $124 billion of commitments,” Kress said, describing it as an enormous number even by the standards of the entire semiconductor industry.
In Nvidia’s case, a moderate-looking P/E paired with rapid earnings growth can suggest the stock is not as expensive as the headline number might imply once future years are considered.
Build your own Valuation Model to value any stock (It’s free!) >>>
Costco’s PE ratio tells a quality and consistency story
Costco is a completely different animal. Its normalized earnings per share have grown steadily, from $11.08 in fiscal 2021 to $18.21 in fiscal 2025, with analysts expecting a climb to $28.87 by fiscal 2030, according to TIKR data. That is real growth, but nowhere near Nvidia’s pace.

Yet Costco’s forward P/E sits around 44 times earnings, well above its own historical average of about 34 times and far above Nvidia’s current multiple, based on TIKR data. Investors are paying a premium for a company growing far slower than Nvidia.

Why would the market do that? Because Costco’s earnings are viewed as unusually dependable. Membership fees, high renewal rates, and loyal foot traffic make its profits far more predictable than a company riding a fast-moving technology cycle.
Costco CFO Gary Millerchip touched on that consistency during the company’s third quarter 2026 earnings call, noting how the business has performed even amid inflation and tariff pressures.
“Overall, when we look at the trajectory of our gross margin rate over the last sort of 12 to 24 months, generally, it’s been stable,” Millerchip said, adding that results tend to land “in that 6% to 7% range” quarter after quarter.
Estimate a company’s fair value instantly (Free with TIKR) >>>
What the ratio hides from investors
A P/E ratio alone cannot tell you why a number is high or low. It does not show future growth rates, how cyclical a business is, or how reliable its earnings truly are.
Two stocks can share the same P/E for entirely different reasons, and two stocks with very different P/E ratios can both be reasonably priced.
Nvidia’s premium multiple in past years was tied to explosive expected growth. Costco’s premium multiple today is tied to trust in its consistency.
Neither story shows up in the number itself. Context always matters more than the ratio alone.
The bottom line for investors
The price-to-earnings ratio is a useful starting point, not a final answer. It works best paired with a company’s growth outlook, margin trends, and business quality, the same details buried inside the charts above.
TIKR lets investors pull up this exact valuation history, current and historical P/E ranges included, for any public stock in seconds.
See what analysts think about RKLB stock right now (Free with TIKR) >>>
How Much Upside Does EchoStar Stock Have From Here?
With TIKR’s new Valuation Model tool, you can estimate a stock’s potential share price in under a minute.
All it takes is three simple inputs:
- Revenue Growth
- Operating Margins
- Exit P/E Multiple
If you’re not sure what to enter, TIKR automatically fills in each input using analysts’ consensus estimates, giving you a quick, reliable starting point.
From there, TIKR calculates the potential share price and total returns under Bull, Base, and Bear scenarios so you can quickly see whether a stock looks undervalued or overvalued.
See a stock’s true value in under 60 seconds (Free with TIKR) >>>
Looking for New Opportunities?
- See what stocks billionaire investors are buying so you can follow the smart money.
- Analyze stocks in as little as 5 minutes with TIKR’s all-in-one, easy-to-use platform.
- The more rocks you overturn… the more opportunities you’ll uncover. Search 100K+ global stocks, global top investor holdings, and more with TIKR.
Disclaimer:
Please note that the articles on TIKR are not intended to serve as investment or financial advice from TIKR or our content team, nor are they recommendations to buy or sell any stocks. We create our content based on TIKR Terminal’s investment data and analysts’ estimates. Our analysis might not include recent company news or important updates. TIKR has no position in any stocks mentioned. Thank you for reading, and happy investing!