Key Stats for Robinhood Stock
- Current Price: $94.91
- Target Price (Mid): ~$220
- Potential Total Return: ~136%
- Annualized IRR: ~21% / year
- Max Drawdown: 57.26% on 3/30/26
Now Live: Discover how much upside your favorite stocks could have using TIKR’s new Valuation Model (It’s free) >>>
What Happened?
Robinhood Markets (HOOD) closed at $94.91 on July 24, down 6.57% and about 16% below where it started 2026. No company announcement has been identified as the cause. The drop landed four days before second-quarter results, which Robinhood will release on July 29 after the close.
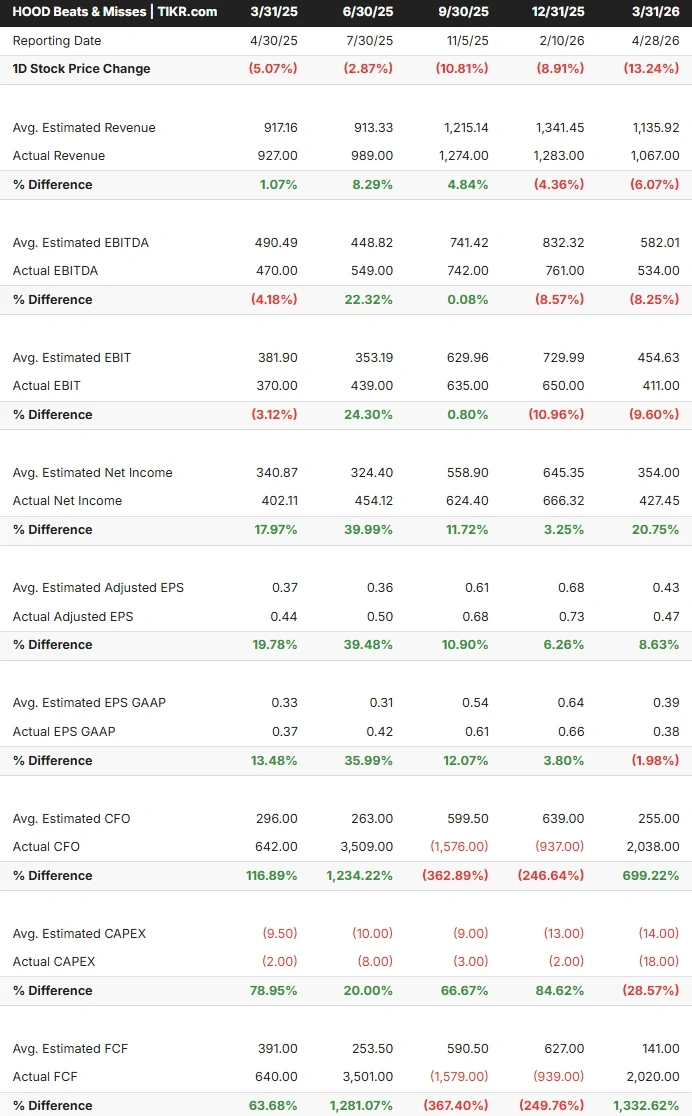
The timing is awkward because Robinhood has a problem with its own earnings days. Shares have fallen after each of the last five reports by an average of roughly 8%, and the quality of those results has been deteriorating underneath the headline numbers.
Five Straight Selloffs, and Beats That Kept Narrowing
The one-day reactions, going back to the April 2025 report, read -5.07%, -2.87%, -10.81%, -8.91%, and -13.24%. The most instructive is the middle one. In the quarter reported on November 5, 2025, Robinhood beat consensus on revenue, EBITDA, EBIT, net income, and both earnings per share lines. The stock fell 10.81%.
What has changed since is how much of the report still clears. In the March quarter, revenue came in at $1.067 billion against roughly $1.136 billion expected, EBITDA missed by about 8%, EBIT by nearly 10%, and GAAP earnings of $0.38 fell a cent short. Adjusted earnings beat, at $0.47 against $0.43 on TIKR’s normalized basis, but by then it was the only line still doing so.
Five observations are not a law. But the direction is consistent: the beats have grown narrower, and the market has stopped extending credit for them.
See historical and forward estimates for Robinhood stock (It’s free!) >>>
Management Already Described the Quarter That Is About to Print
Unusually for a preview, much of the June quarter is already on the record.
Reporting first-quarter results on April 28, Chief Financial Officer Shiv Verma said “Q2 is off to a good start in April,” with equity and option trading volumes tracking toward the highest month of the year and net deposits at approximately $5 billion month-to-date.
Steve Quirk, Robinhood’s Chief Brokerage Officer, extended that at the Piper Sandler Global Exchange and Fintech Conference on June 4. He described April as the second-highest month the company had seen in equity and options trading and its highest in futures and prediction markets. May, he said, was “very strong.” Relaying remarks Vlad Tenev had made on CNBC, Quirk said June 1 was the company’s biggest day ever in equity trading.
Volume is therefore close to a known quantity, and investors have heard it twice. July 29 has to answer what that activity converted into.
The Quarter Carries the Spending Before It Carries the Benefits
Robinhood’s three biggest structural changes all landed too late to show up properly in this print.
FINRA’s pattern day trader rule, and the $25,000 minimum equity requirement attached to it, was approved for elimination by the SEC on April 14, 2026, but the amendments did not take effect until June 4. That left less than four weeks of the quarter. Quirk, speaking the day the change went live, said Robinhood’s average account sits near $13,000 and argued its customers were far more constrained by the rule than those at larger brokers, with some having moved accounts elsewhere after being flagged. The change helps every retail broker. If Quirk is right about the account math, it helps this one more, and almost none of it lands in Q2.
Rothera, the exchange and clearinghouse Robinhood built with Susquehanna, also went live in June per Quirk’s comments at the same conference. Worth correcting a common assumption about it: he said Robinhood would pass some of the economics it previously gave Kalshi to customers rather than keep them, so the near-term gain is control over pricing and product, not a wider take rate. Trump Accounts were scheduled to go live July 4, placing them in the current quarter rather than the reported one.
The costs are already committed. Robinhood raised its 2026 adjusted operating expense and share-based compensation outlook by $100 million to fund the Trump Accounts build-out, work it has said should generate revenues exceeding its costs. Consensus reflects the squeeze: revenue growth near 13% in 2026 against roughly flat normalized earnings. At about 36 times NTM earnings, down from 41 times at the end of June, the market has already taken some risk out of this print.

See how Robinhood performs against its peers in TIKR (It’s free!) >>>
TIKR Advanced Model Analysis
- Current Price: $94.91
- Target Price (Mid Case): ~$220
- Potential Total Return: ~136%
- Annualized IRR: ~21% / year

See analysts’ growth forecasts and price targets for Robinhood stock (It’s free!) >>>
This is a scenario built on stated assumptions, not a forecast. The mid case assumes revenue compounds near 12% a year, well below the 19% forward two-year CAGR in consensus today, and that net margin settles around 39%. The ~$122 Street mean, and the ~$220 model figure are not in conflict: one is a 12-month target, the other sits 4.4 years out.
The two revenue drivers are a larger active-trader base following the margin rule change, and net deposit growth converting into interest revenue and Gold subscriptions. The margin driver is operating leverage once the Trump Accounts and exchange spending annualize. The primary risk is that the cost base is now fixed while the offsets are timing-dependent: if the volume and asset gains fail to materialize in the second half, the higher spending compresses margins against a multiple still priced for growth.
The upside is a broker that widened its addressable base and its product set in one quarter. The downside is a high-beta name, a five-year beta of 2.35, paying for a transition before it earns from it.
Conclusion
Consensus sits around $1.2 billion in revenue, more than 20% above the $989 million posted a year ago. Clearing it after two straight misses matters, but the more useful read is what management says about July and August. The margin rule change, the exchange, and the new account product all sit almost entirely in the current quarter, not the reported one.
A soft print on July 29 would not tell you the second half is soft. A soft print plus cautious commentary on third-quarter volumes would.
See what stocks billionaire investors are buying so you can follow the smart money with TIKR.
Should You Invest in Robinhood?
The only way to really know is to look at the numbers yourself. TIKR gives you free access to the same institutional-quality financial data that professional analysts use to answer exactly that question.
Pull up Robinhood, and you’ll see years of historical financials, what Wall Street analysts expect for revenue and earnings in the quarters ahead, how valuation multiples have moved over time, and whether price targets are trending up or down.
You can build a free watchlist to track Robinhood alongside every other stock on your radar. No credit card required. Just the data you need to decide for yourself.
Analyze Robinhood on TIKR Free →
Looking for New Opportunities?
- See what stocks billionaire investors are buying so you can follow the smart money.
- Analyze stocks in as little as 5 minutes with TIKR’s all-in-one, easy-to-use platform.
- The more rocks you overturn… the more opportunities you’ll uncover. Search 100K+ global stocks, global top investor holdings, and more with TIKR.
Disclaimer:
Please note that the articles on TIKR are not intended to serve as investment or financial advice from TIKR or our content team, nor are they recommendations to buy or sell any stocks. We create our content based on TIKR Terminal’s investment data and analysts’ estimates. Our analysis might not include recent company news or important updates. TIKR has no position in any stocks mentioned. Thank you for reading, and happy investing!