

Key Takeaways:
- Compagnie de Saint-Gobain S.A. is reshaping its portfolio around higher-value construction and renovation solutions while focusing on operational efficiency and capital discipline.
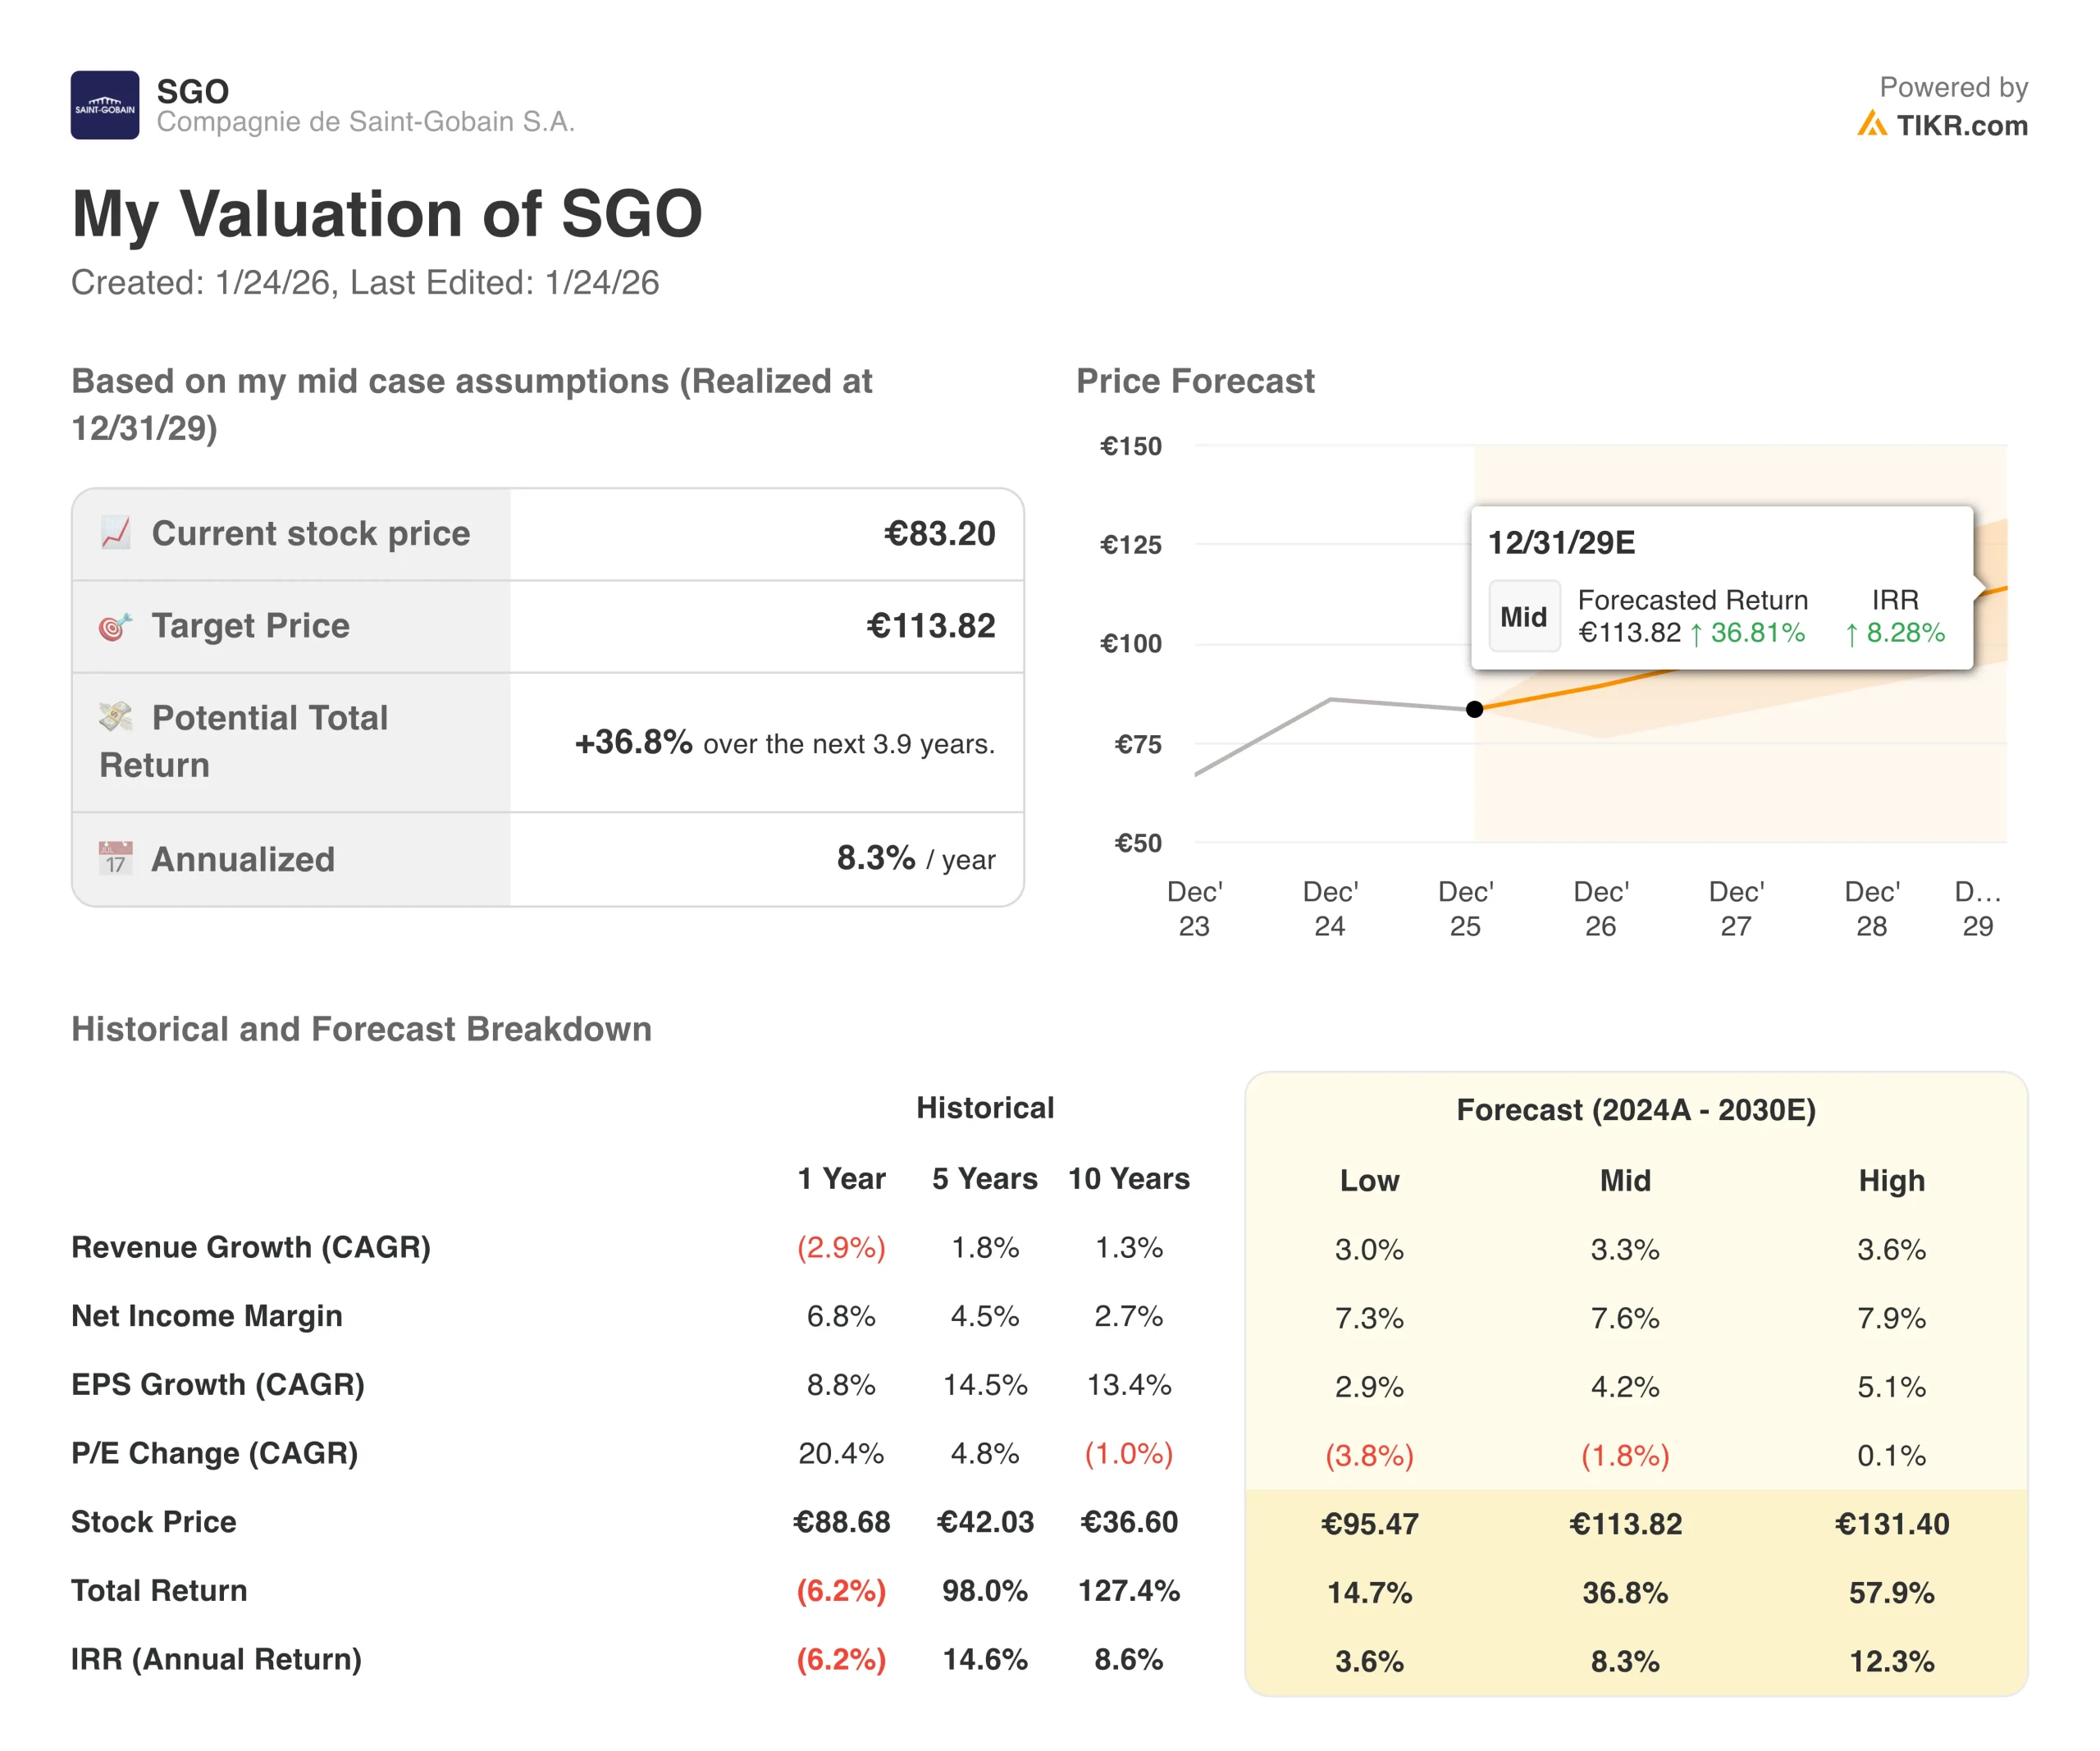
- SGO stock could reasonably reach €114 per share by December 2029, based on our valuation assumptions.
- This implies a total return of 36.8% from today’s price of €83, with an annualized return of 8.3% over the next 3.9 years.
Compagnie de Saint-Gobain S.A. (SGO) is a global leader in building materials that designs, manufactures, and distributes solutions for construction and industrial customers across more than 70 countries.
The company has been streamlining its portfolio, exiting lower-margin activities and reinvesting in higher-growth renovation, energy-efficiency, and specialty materials segments.
Because of this ongoing shift, Saint-Gobain aims to balance resilient cash generation in Europe with growth opportunities in North America and emerging markets.
Here’s why Saint-Gobain’s stock could still provide solid, though not spectacular, returns through 2029 if it continues executing on its strategy while maintaining disciplined capital allocation.
What the Model Says for Saint-Gobain Stock
We analyzed the upside potential for Saint-Gobain stock using valuation assumptions anchored in its recent revenue trends, margin profile, and a normalized valuation multiple. It uses both a shorter-term guided view through 2027 and a more detailed forecast through 2029 to gauge potential returns.
Based on estimates of 2.0% annual revenue growth, 11.6% operating margins, and a normalized exit P/E multiple of 12x, the model projects Saint-Gobain stock could rise from €83 to €95 per share in the next 1.9 years.
That would be a 14.7% total return, or a 7.3% annualized return.

Our Valuation Assumptions
TIKR’s Valuation Model lets you plug in your own assumptions for a company’s revenue growth, operating margins, and P/E multiple, and calculates the stock’s expected returns.
Here’s what we used for Saint-Gobain stock:
1. Revenue Growth: 2.0%
- Revenue Growth: 2.0%
Saint-Gobain’s reported revenue contracted slightly over the last twelve months, with one‑year revenue CAGR around negative low single digits, as softer new construction activity and lower volumes weighed on sales.
At the same time, the company’s five‑ and ten‑year revenue CAGRs have been modestly positive, supported by acquisitions, pricing actions, and a growing renovation mix.
Based on analysts’ consensus estimates, we assume a conservative 2.0% annual revenue growth rate through 2027. This forecast reflects a cautious outlook that balances cyclical headwinds in certain markets against structural drivers such as energy-efficiency renovation demand, infrastructure needs, and ongoing portfolio optimization.
2. Operating Margins: 11.6%
Saint-Gobain has gradually improved its profitability, with recent operating margins around the low double‑digit range thanks to cost efficiencies, mix upgrades, and disciplined pricing. The company’s strategy emphasizes higher-value solutions, industrial efficiency programs, and tighter portfolio focus, which together support a more resilient margin profile even when volumes are under pressure.
Based on analysts’ consensus estimates, we use an 11.6% operating margin assumption for 2027. This level is slightly above the most recent one‑year margin but broadly consistent with the direction of management’s efficiency and value‑creation initiatives.
3. Exit P/E Multiple: 12x
Historically, Saint-Gobain’s shares have traded in a low‑teens P/E range, reflecting its cyclical exposure to construction and industrial markets but also its strong market position and earnings diversification.
Over the last year, the stock’s P/E multiple has hovered around the low‑ to mid‑teens, with 13.5x on a one‑year view and approximately 11x to 12x on five‑ and ten‑year averages.
Based on analysts’ consensus estimates, we apply a 12.0x exit P/E multiple. This level sits close to the longer‑term average and assumes that the market continues to value Saint-Gobain as a cyclical but steadily improving building‑materials leader rather than re‑rating it as a high‑growth compounder.
Build your own Valuation Model to value any stock (It’s free!) >>>
What Happens If Things Go Better or Worse?
Different scenarios for SGO stock through 2030 show varied outcomes based on different combinations of revenue growth, margins, and valuation outcomes (these are estimates, not guaranteed returns):
- Low Case: Stock would deliver positive but modest returns, suggesting it could be closer to fairly valued → 3.6% annual returns
- Mid Case: Revenue increases near 3.3% annually, margins trend toward the high single‑digit net income range → 8.3% annual returns
- High Case: Revenue growth accelerates toward 3.6% per year with stronger EPS compounding and a slightly more supportive valuation backdrop → 12.3% annual returns
Even in the more cautious low case, Saint-Gobain still generates positive expected returns thanks to its diversified portfolio, ongoing efficiency efforts, and shareholder‑friendly capital allocation.
However, because the central mid‑case return sits below 10% annually, the stock does not currently screen as deeply undervalued on these assumptions, especially compared with opportunities that might offer 15%+ expected annual returns.
See what analysts think about SGO stock right now (Free with TIKR) >>>
How Much Upside Does Saint-Gobain Stock Have From Here?
With TIKR’s new Valuation Model tool, you can estimate a stock’s potential share price in under a minute.
All it takes is three simple inputs:
- Revenue Growth
- Operating Margins
- Exit P/E Multiple
If you’re not sure what to enter, TIKR automatically fills in each input using analysts’ consensus estimates, giving you a quick, reliable starting point.
From there, TIKR calculates the potential share price and total returns under Bull, Base, and Bear scenarios so you can quickly see whether a stock looks undervalued or overvalued.
See a stock’s true value in under 60 seconds (Free with TIKR) >>>
Looking for New Opportunities?
- See what stocks billionaire investors are buying so you can follow the smart money.
- Analyze stocks in as little as 5 minutes with TIKR’s all-in-one, easy-to-use platform.
- The more rocks you overturn… the more opportunities you’ll uncover. Search 100K+ global stocks, global top investor holdings, and more with TIKR.
Disclaimer:
Please note that the articles on TIKR are not intended to serve as investment or financial advice from TIKR or our content team, nor are they recommendations to buy or sell any stocks. We create our content based on TIKR Terminal’s investment data and analysts’ estimates. Our analysis might not include recent company news or important updates. TIKR has no position in any stocks mentioned. Thank you for reading, and happy investing!


